ASAP 2020 update: an open, scalable and interactive web-based portal for (single-cell) omics analyses
←
→
Page content transcription
If your browser does not render page correctly, please read the page content below
Published online 25 May 2020                                       Nucleic Acids Research, 2020, Vol. 48, Web Server issue W403–W414
                                                                                                               doi: 10.1093/nar/gkaa412

ASAP 2020 update: an open, scalable and interactive
web-based portal for (single-cell) omics analyses
Fabrice P.A. David1,2,3 , Maria Litovchenko1,2 , Bart Deplancke1,2,* and Vincent Gardeux                                                               1,2,*

1
 Institute of Bioengineering, School of Life Sciences, École Polytechnique Fédérale de Lausanne (EPFL), CH-1015
Lausanne, Switzerland, 2 Swiss Institute of Bioinformatics, CH-1015 Lausanne, Switzerland and 3 BioInformatics
Competence Center, École Polytechnique Fédérale de Lausanne (EPFL), Switzerland

Received February 24, 2020; Revised April 12, 2020; Editorial Decision April 29, 2020; Accepted May 21, 2020

                                                                                                                                                                  Downloaded from https://academic.oup.com/nar/article/48/W1/W403/5843818 by guest on 01 October 2020
ABSTRACT                                                                          ditional bulk RNA-seq bioinformatics tools. In a very short
                                                                                  amount of time, however, sample sizes exploded (3). This
Single-cell omics enables researchers to dissect bio-                             is exemplified by recent efforts aiming to create ‘cell at-
logical systems at a resolution that was unthinkable                              lases’ for entire tissues (4,5) or organisms (6–9) at resolu-
just 10 years ago. However, this analytical revolution                            tions and scales that are more difficult to handle compu-
also triggered new demands in ‘big data’ manage-                                  tationally (>100k or even millions of cells and thus tran-
ment, forcing researchers to stay up to speed with in-                            scriptomes). As the field evolves, so are the underlying an-
creasingly complex analytical processes and rapidly                               alytical approaches and tools, making it increasingly more
evolving methods. To render these processes and                                   difficult to see ‘the forest through the methodological trees’
approaches more accessible, we developed the web-                                 and to select the proper analysis pipeline (10,11). The lat-
based, collaborative portal ASAP (Automated Single-                               ter is also in part dictated by the size of the focal dataset,
cell Analysis Portal). Our primary goal is thereby to                             with powerful tools now emerging that aim to handle single-
                                                                                  cell omics datasets in a scalable manner (12). However, these
democratize single-cell omics data analyses (scRNA-
                                                                                  tools have yet to take firm root in the field, especially with re-
seq and more recently scATAC-seq). By taking ad-                                  searchers who have so far been accustomed to working with
vantage of a Docker system to enhance reproducibil-                               smaller-sized datasets (∼1–10k cells). The urgency for these
ity, and novel bioinformatics approaches that were                                tools to become widely implemented is illustrated by recent
recently developed for improving scalability, ASAP                                cell atlasing projects, which clearly demonstrate the need for
meets challenging requirements set by recent cell at-                             both scalable computing power and analytical approaches
lasing efforts such as the Human (HCA) and Fly (FCA)                              (10). Finally, novel single-cell omics approaches such as
Cell Atlas Projects. Specifically, ASAP can now han-                              single-cell ATAC-seq (scATAC-seq) are rapidly emerging,
dle datasets containing millions of cells, integrating                            posing additional problems in terms of data management
intuitive tools that allow researchers to collaborate                             and integration (13).
on the same project synchronously. ASAP tools are                                    To reduce the complexity of single-cell omics analyses, we
                                                                                  developed ASAP (14), enabling standardized analyses that
versioned, and researchers can create unique access
                                                                                  can be run in minutes by any user without requiring sig-
IDs for storing complete analyses that can be repro-                              nificant computing power. The entire, canonical scRNA-
duced or completed by others. Finally, ASAP does                                  seq pipeline is available in ASAP, and can be summarized
not require any installation and provides a full and                              into 8 consecutive steps: (i) filtering low quality cells and
modular single-cell RNA-seq analysis pipeline. ASAP                               lowly expressed genes, (ii) normalization across cells, (iii)
is freely available at https://asap.epfl.ch.                                      scaling and covariate removal (such as read depth, mi-
                                                                                  tochondrial content, etc.), (iv) computing highly variable
                                                                                  genes of interest, (v) performing dimension reduction us-
INTRODUCTION                                                                      ing PCA followed by high dimensional methods such as
Single-cell omics is a recent field that started to bloom in                      t-SNE or UMAP, (vi) clustering of cells to identify sub-
2013–15 with the advent of commercially available single-                         populations, (vii) differential expression analysis to identify
cell RNA-seq (scRNA-seq) protocols (1,2). At its origin,                          marker genes of identified subpopulations and (viii) func-
platforms could process hundreds of cells at a time, whose                        tional enrichment of these marker genes into pathways or
corresponding transcriptomes could still be handled by tra-                       cell types. Of course, all these steps are parametrizable, and

* To
   whom correspondence should be addressed. Tel: +41 216930983; Email: vincent.gardeux@epfl.ch
Correspondence may also be addressed to Bart Deplancke. Email: bart.deplancke@epfl.ch

C The Author(s) 2020. Published by Oxford University Press on behalf of Nucleic Acids Research.
This is an Open Access article distributed under the terms of the Creative Commons Attribution Non-Commercial License
(http://creativecommons.org/licenses/by-nc/4.0/), which permits non-commercial re-use, distribution, and reproduction in any medium, provided the original work
is properly cited. For commercial re-use, please contact journals.permissions@oup.com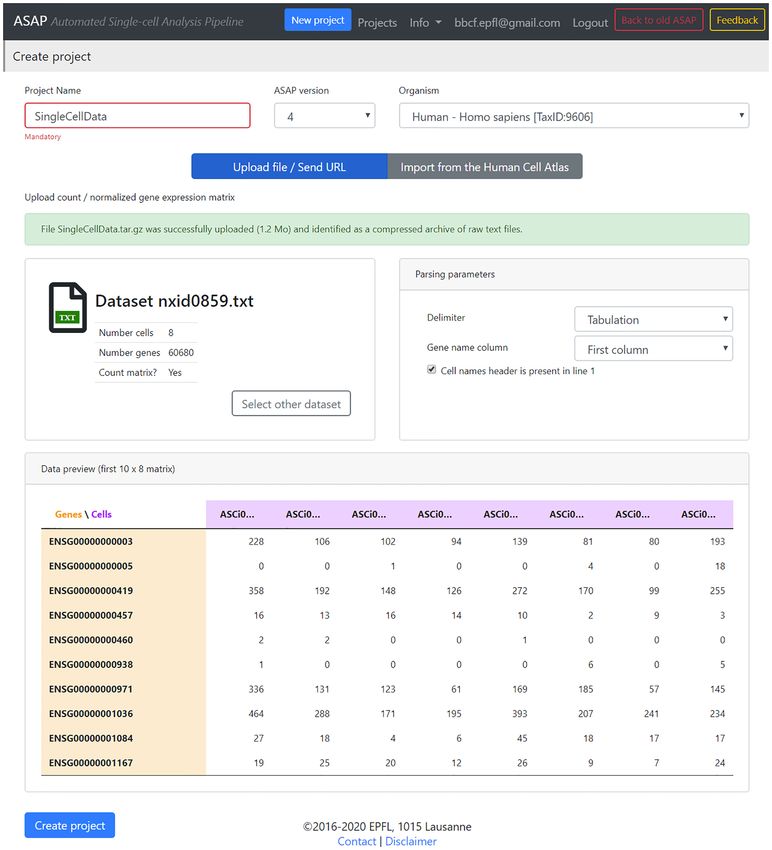
W404 Nucleic Acids Research, 2020, Vol. 48, Web Server issue

we acknowledge that it may be difficult to find one fixed         depth, etc.) that are immediately added to the parsed .loom
pipeline that will fit all dataset types (10). A trained bioin-   file and available downstream, such as for example when
formatician tends to therefore tune the parameters to the         coloring plots during visualization.
dataset of interest. Given this, ASAP allows users to choose
from a panel of tools, thereby providing guiding tutorials to
help researchers with their selection of the correct tools or     Web application
parametrization for their datasets.                               The ASAP web application is developed with Ruby-on-
   Here, we report a major ASAP upgrade, with several sub-        Rails (RoR). The backend is implemented as a PostgreSQL
stantial improvements such as a completely remodeled user         relational database. The frontend uses different JavaScript
interface, a fully Dockerized (15,16) system, and the inter-      libraries and is set to enable front-end scalability with big
nal implementation of the .loom file format. We chose this        datasets. Specifically, (i) scattergl plots from plotly.js (18)
format since it substantially increased the scalability of the    to render dimension reduction plots scalable; (ii) pako-
tools used to perform out-of-RAM computations, allow-             inflate.js (https://github.com/nodeca/pako) to compress big

                                                                                                                                    Downloaded from https://academic.oup.com/nar/article/48/W1/W403/5843818 by guest on 01 October 2020
ing the analysis of high-dimensional datasets of virtually        integer arrays between the client and the server and (iii)
any size. This new format also enhances the communication         an adapted version of JQuery (https://jquery.com/) file in-
between existing portals such as SCope (17), the Human            put for scalable file uploads. Other important javascript li-
Cell Atlas (7), and many others that are adopting the same        braries that are used include Cytoscape.js (19,20) to gener-
file format for storing complete analyses into one single         ate a graphical display of the analysis pipeline composition
file.                                                             or of Jquery autocomplete for gene selection in the visual-
                                                                  ization tool.
RESULTS AND METHODS                                                  As mentioned previously (see Figure 1), the ASAP web
                                                                  application runs in a Docker container called asap web. To-
Implementation overview                                           gether with other containers for the (i) websockets (Cable,
ASAP is now using the Docker technology (15,16) to make           Redis containers), (ii) PostgreSQL server and (iii) Puma web
the whole platform modular and versioned (Figure 1).              server, they are embedded in a docker-compose that guar-
Docker containers separate the main website (the Ruby-on-         antees independence with respect to the hosting system and
rails web server code) from the running jobs (R, Python and       that could facilitate further migration / deployment of the
Java bioinformatics tools), enabling jobs to run on a differ-     system.
ent machine than the main server hosting the web applica-
tion. Moreover, this architecture allows the asap run con-        Reproducibility
tainer (hosting the versioned bioinformatics tools) to be dis-
patched to many external machines for enhanced comput-            The ASAP server incorporates a versioning system that en-
ing power, and maybe in the future, to the cloud.                 sures full reproducibility of the analyses that are carried out
   Since the single-cell community is very active, and new        on the web application. This release handles new projects
methods appear or are upgraded almost on a monthly                and retro-compatibility of old projects starting from ver-
basis, this architecture allows an easier versioning of the       sion 4 (v4). When starting a project, users have the option
portal with each asap run container encapsulating its own         to use the stable version of their choice (i.e. v4 or v5 at the
tool versions. This will enhance reproducibility and retro-       moment).
compatibility with previous studies. The Dockerized archi-           Version stability is enabled by two key components
tecture also keeps all tool versions fixed for a given global     of the system: (i) all external (project-independent) data
version of ASAP, thus all listed tools are embedded at a          are stored in a versioned PostgreSQL relational database
fixed version and correspond to a single versioned Docker.        asap data vN; and (ii) all scripts and executables are in-
                                                                  stalled with the necessary dependencies in an r-base docker
                                                                  container asap run:vM that is available on Dockerhub
.loom files
                                                                  (https://hub.docker.com/r/fabdavid/asap run/tags).
.loom files represent a standardized file format for                 Note that for a given global ASAP version, versions of
storing/handling single-cell datasets. It was proposed            the docker container and of the relational database M and
and developed by the Linnarsson Lab (http://loompy.org/).         N can be different, since the database or the docker con-
.loom files are HDF5 (Hierarchical Data Format) files fol-        tainer are not necessarily updated each time.
lowing certain constraints in terms of group/dataset names           For every run, we also provide the user with the ex-
and types. They allow for very efficient computation and          act list of commands that was used to produce the output
access to row/columns of datasets, thus greatly enhancing         (using the Docker module). Therefore, all steps are com-
the scalability of computational methods. The matrices can        pletely reproducible, and a default pipeline can be read-
be chunked, which allows out-of-RAM computation by                ily implemented using Docker and the scripts generated by
processing the data ‘chunk by chunk’. The new version of          ASAP. A global script is also dynamically generated for
ASAP now internally handles .loom files for every project.        each project, so users can reproduce their complete anal-
When a user submits a dataset (plain text, archive, 10×,          ysis locally on their machine/server. The script loads the
etc.), it is automatically transformed into a .loom file during   right version of the docker container and of the relational
the parsing step. This step also computes basic statistics        database and runs the whole pipeline, as designed by the
(number of detected genes, ratio mitochondrial content,           users.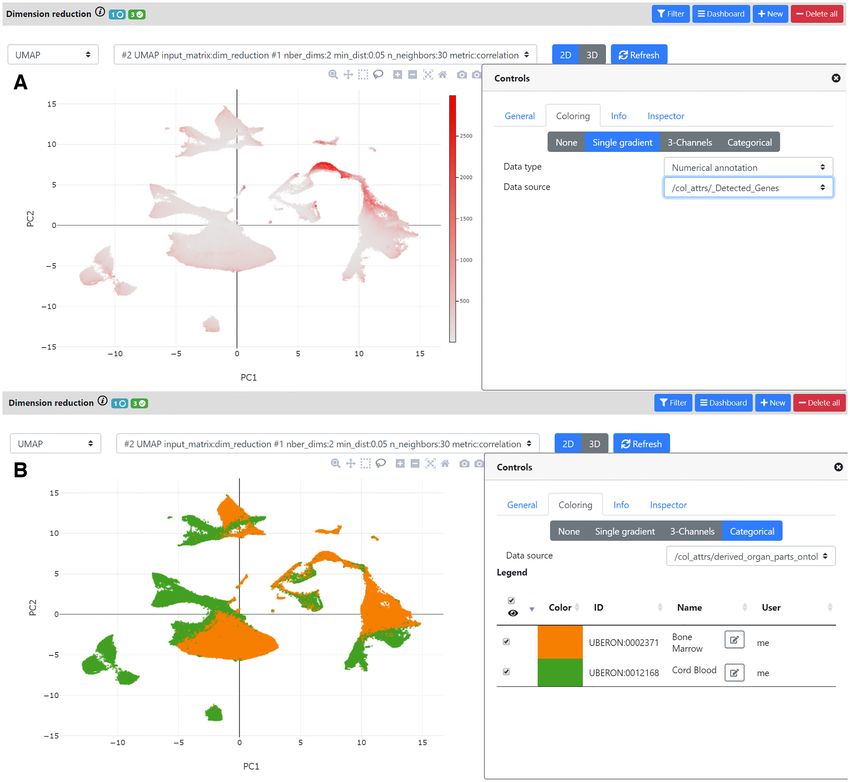
Nucleic Acids Research, 2020, Vol. 48, Web Server issue W405
Downloaded from https://academic.oup.com/nar/article/48/W1/W403/5843818 by guest on 01 October 2020
Figure 1. ASAP architecture. The ASAP application is a docker-compose-based Ruby-on-Rails application. ASAP implements web-sockets (using Redis
and Cable containers) for an interactive display of results at the client end. Analyses launched by users are submitted to a scheduler that will run third
party software (Python, R, Java) in versioned docker containers ASAP run:vM, enabling scalability and reproducibility of the platform. The scheduler
also ensures that the number of cores that are used on the machine and the level of RAM used on the machine are not exceeding hardware capacities. The
ASAP core database stores users, projects and job stats (for benchmarking the tools) and is thus not versioned. A versioned ASAP data vN (currently
v5) database stores external public data on genes, gene sets and future ontologies. Results of analyses are written on a fast-access disk (NVME) shared by
the Ruby-on-Rails and the ASAP run:vM docker containers. Projects that are not accessed for a long period are automatically saved on an object storage
system (through a CRON job) for saving space on the fast access NVME disk.
Execution of analyses retrieve lists of projects that are associated with any GEO,
ArrayExpress or BioProject project, based on identifiers or
On the ASAP server, the different analysis scripts and exe-
free-text descriptions.
cutables are run within the asap run vN docker containers
by a scheduler that evaluates if the system can accept a new
analysis at a given time. The scheduler assesses the status of Input
the system (checking the load on the machine and the num-
ber of free CPUs). For each analysis, the amount of RAM ASAP can handle read/UMI count matrices in several for-
required, and the execution time are monitored and stored; mats: (i) plain-text files (compressed or not), (ii) archives
this information is then available to the users through the of text files (compressed or not), (iii) .loom files or (iv)
interface. .h5 files produced by the 10× CellRanger pipeline (https:
Operations requiring a minimal amount of resources, //github.com/10XGenomics/cellranger). When the data fin-
such as unarchiving projects, are directly launched (with- ishes uploading on the server, ASAP starts to parse the file
out waiting) on a queue through DelayedJob, a RoR mod- and shows a snapshot (preview) of the dataset (10 first rows,
ule that allows to run a piece of code asynchronously. 10 first columns) as well as cell/gene names (Figure 2). This
allows the user to change some parsing options, such as the
separator or the column id containing the gene names, with-
Referencing and searching ASAP projects
out having to re-upload the dataset.
Identifiers from GEO (21) or ArrayExpress (22) can be as- Users can also choose to create a new project from data
sociated manually to an ASAP project. If users publish hosted by the HCA DCP. This feature uses an API provided
the results of an ASAP analysis, they can also provide the by the HCA (Matrix Service API) to query the available
PubMed ID of the article (at the same time as setting the datasets. The user can choose specific datasets for import
project as ‘public’). If a project is loaded from the Human into ASAP, and the HCA API will automatically generate
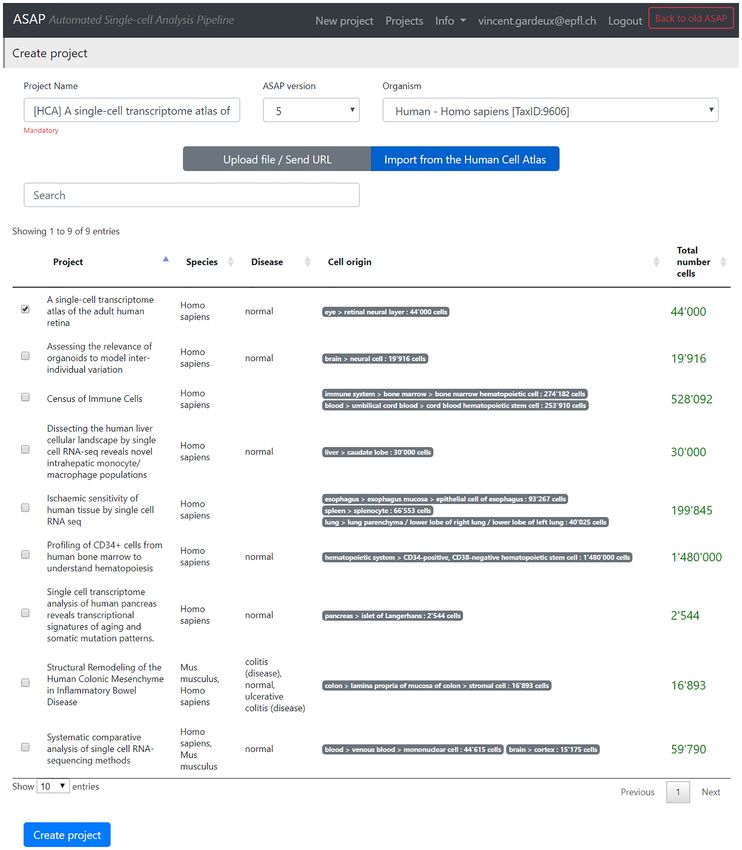
Cell Atlas (HCA) Data Coordination Platform (DCP), then a .loom file containing all selected cells (Figure 3). Finally,
GEO and ArrayExpress identifiers are automatically asso- a new project is created on ASAP with the imported .loom
ciated to the ASAP project. From these identifiers (assigned file, with which the user can start analysis and visualization.
manually or automatically), information from GEO, Array- Internally, all inputs are transformed into .loom files as a
Express and BioProject (23) (mainly literature references, common format for all steps. Of course, the users can down-
description and identifiers) is automatically extracted and load the .loom files for their projects and also load them into
associated to the ASAP project. R (using loomR, https://github.com/mojaveazure/loomR)
In addition, an instance of SunSpot/SolR runs on the or Python (using loompy, http://loompy.org/). Of note, since
RoR application and provides an efficient search engine to .loom files are essentially normed HDF5 files, they can po-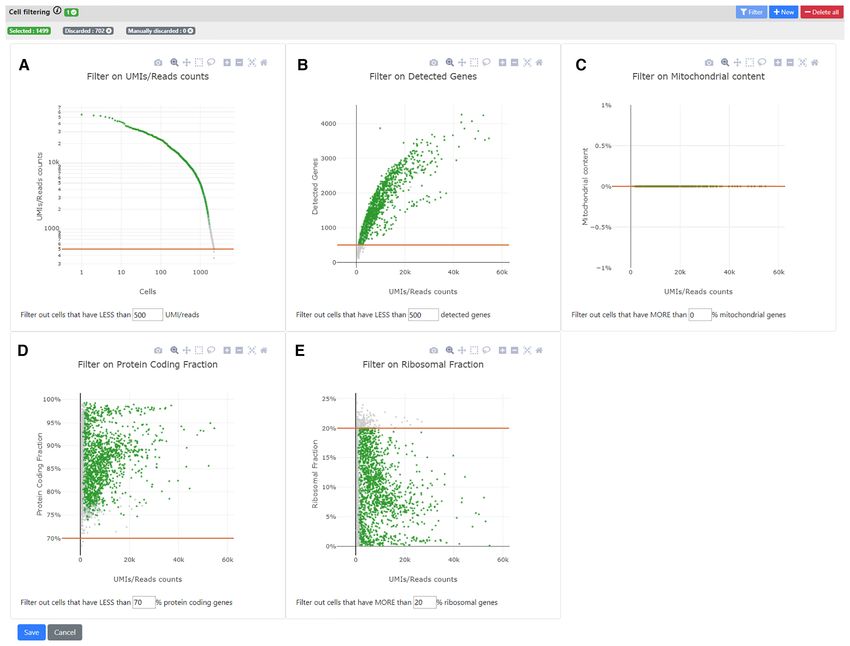
W406 Nucleic Acids Research, 2020, Vol. 48, Web Server issue

                                                                                                                                                                 Downloaded from https://academic.oup.com/nar/article/48/W1/W403/5843818 by guest on 01 October 2020

Figure 2. Dataset preview after its upload in ASAP. After uploading a file (of any type), ASAP shows a preview of the main count matrix (10 first
rows/columns), as well as genes and cell names. It also shows an icon with the type of file that is recognized automatically. Therefore, the user has the
possibility to change the parsing options if needed (delimiter, header, . . . ). In this page, the user can name the project, choose an organism from the ∼500
organisms available from Ensembl, and choose the version to run on (here, v4 is the latest stable version (default) and v5 is still in beta).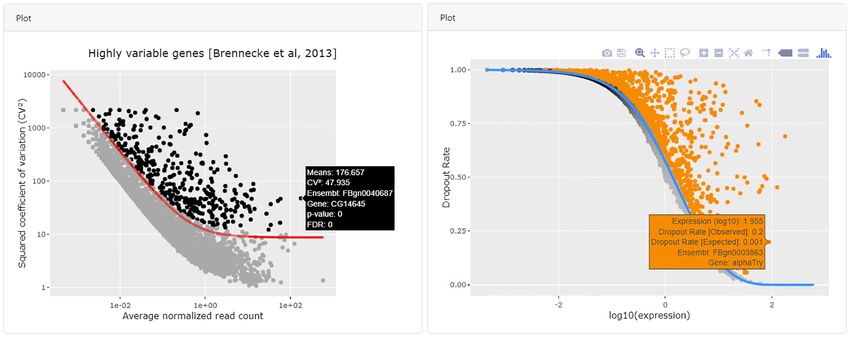
Nucleic Acids Research, 2020, Vol. 48, Web Server issue W407

                                                                                                                                                              Downloaded from https://academic.oup.com/nar/article/48/W1/W403/5843818 by guest on 01 October 2020

Figure 3. Dataset download from the Human Cell Atlas Matrix Service API. Users can query the Matrix Service API of the Human Cell Atlas (HCA)
from the ASAP ‘New Project’ page. They will see a list of projects from which the Matrix Service can generate count matrices in the form of .loom files
(.fastq and other raw sequencing files are automatically filtered out). The user can then choose a project and the HCA API will automatically send a .loom
file to ASAP. The latter file will be parsed automatically, thus creating a ‘ready to analyze’ project in ASAP. Importantly, all metadata sent from the HCA
are automatically imported along with the .loom file, and will be readily available in ASAP (such as sequencing platform, tissue of origin, etc.).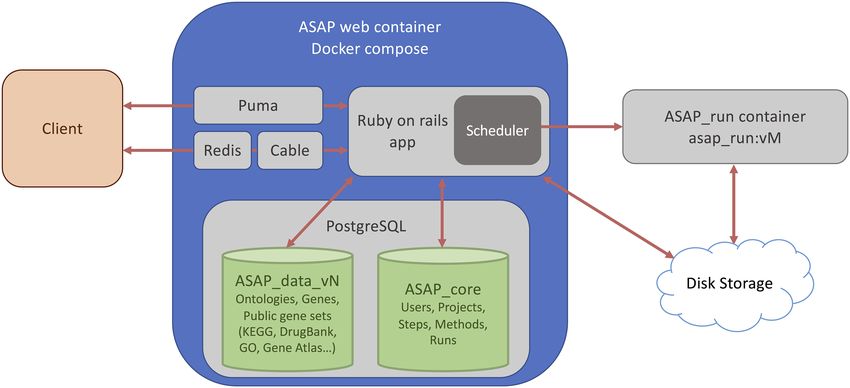
W408 Nucleic Acids Research, 2020, Vol. 48, Web Server issue

                                                                                                                                                                         Downloaded from https://academic.oup.com/nar/article/48/W1/W403/5843818 by guest on 01 October 2020
Figure 4. Interactive cell filtering step enables users to set various thresholds for QC. The cell filtering step features interactive plots for filtering out outlier
cells that do not pass certain quality controls (QC). In all panels, a point is a cell. Of note, when a threshold is selected in one of the five panels, all other
panels are automatically refreshed so the user can see the retained cells (green) and the ones that were filtered out (grey). A recap of the final number
of selected vs. filtered out genes is available in the top bar. (A) Number of UMI/read counts per cell (sorted in descending order). This plot is similar to
the plot generated by CellRanger in the 10x pipeline. Users can select a minimum number of UMI/reads per cell. (B) Number of UMIs/Read counts vs
number of detected genes. (C). Ratio of reads that maps to mitochondrial genes (vs all mapped reads). This feature uses the Ensembl database to know
on which chromosome the genes are mapping, so only genes that are mapped to our Ensembl database are considered. (D, E) Similar to C. but using the
biotype of the genes from Ensembl to know if the reads map to a protein-coding gene (D), or to a ribosomal gene (E).

tentially be loaded with any other programming language                               genes) to gene sets such as GO (25), KEGG (26), Drugbank
as well.                                                                              (27) or cell type annotation databases (28–30).

Ensembl and gene set database                                                         Available tools, bioinformatics scripts and executables
In its last version (v5), ASAP incorporates information                               Since the initial implementation of ASAP, several tools were
from the Ensembl (24) ‘vertebrates’ database v54 to v99                               added, and obsolete tools were removed for this major up-
and from Ensembl ‘genomes’ v5 to v46. The ASAP data v5                                grade. Currently, ASAP hosts tools in Python, R, and Java.
database contains 16 734 890 genes with unique Ensembl                                  The parsing and filtering steps are performed in Java,
identifiers for 551 different species. During file parsing, all                       which we found to be both much faster than R or Python
genes are mapped to the database version chosen by the                                as well as scalable to any dataset (implemented to take ad-
user (v4 or v5), with the latest stable one always being pre-                         vantage of the .loom format and the chunking of the count
selected. This mapping is not necessary for most of the                               matrices). In addition, for the Cell Filtering step, we im-
steps included in ASAP, but can provide additional infor-                             plemented dynamic plots for selecting the best thresholds
mation in the result tables, or when hovering on the dynamic                          according to major QC metrics: number of detected genes,
plots. It is mostly needed during the last step of the analysis                       number of UMIs/reads, ratio of reads mapping to protein-
(cell type annotation/functional enrichment), when ASAP                               coding genes, ratio of mitochondrial reads, and ratio of ri-
needs to relate differentially expressed genes (or marker                             bosomal reads (Figure 4). The user can see the plots, select
Nucleic Acids Research, 2020, Vol. 48, Web Server issue W409
Downloaded from https://academic.oup.com/nar/article/48/W1/W403/5843818 by guest on 01 October 2020
Figure 5. Calculation and interactive visualization of Highly Variable Genes and M3Drop. Different methods in ASAP are available to select highly variable
genes. All methods produce an interactive plot where the user can hover the cells to see their characteristics (rectangle box tooltip). Here, we see the output
of two methods. On the left panel, highly variable genes are calculated from Seurat (v2) using the Brennecke et al. method (50). On the right panel is the
output of the M3Drop method, more specifically the Depth-Adjusted Negative Binomial (DANB) model, which is tailored for datasets quantified using
unique molecular identifiers (UMIs).
the best thresholds for each of them, and visualize the re- rectly in the browser as an interactive plot. Internally, the
sulting number of filtered cells interactively, prior to valida- server will extract the column attributes from the .loom file
tion, which will produce a novel .loom file filtered according and generate a JSON file that will be sent to the client and
to the different thresholding parameters. that can be visualized using plotly.js scattergl. The WebGL
The highly variable gene calculation is using tools from version was chosen because it allows the plotting of millions
three packages: M3Drop (31), Seurat (32) and Scanpy (12). of cells in a timely manner.
Of note, only the one from Scanpy is scalable to >100k cells. Different steps have different outputs. For some steps,
Also, for these methods, the user is able to see the result- such as detecting highly variable genes, the output is a fil-
ing curve and highlight genes of interest by hovering on the tered .loom file and a dynamic plot showing the interpola-
cell (Figure 5). In the subsequent visualization step, PCA tion that was produced during the calculation. Other steps
(Incremental PCA) is implemented in Python and is paral- such as the differential expression or the functional enrich-
lelized and scalable. The UMAP (33) and t-SNE (34) meth- ment steps produce sorted tables of statistically significant
ods from Seurat are implemented as well and are scalable genes/gene sets. These tables have dynamic links to external
when run on the results of the PCA. A parallelized version databases such as GO (25) or Ensembl (24).
of t-SNE was also added from the Scanpy package in ASAP The main visualization step is the dimension reduction
v5. (using PCA, t-SNE (34) or UMAP (33)). This step allows
Many clustering methods are implemented, mostly in R the user to visualize the dataset in 2D or 3D. The 2D view
(Seurat, SC3 (35), k-means) and should be run on the results can be tuned in different ways. First, the user can color the
of the PCA for scalability purposes. Similarly, many differ- cells according to external metadata (such as sex, library
ential expression methods were implemented in R (Seurat, type, depth, batch etc.), clustering results, or gene expres-
limma (36), DESeq2 (37)) or re-implemented by us in Java sion (Figure 6). The plot is also dynamic, so the user can
for the purpose of scalability (Wilcoxon-ASAP). Only Seu- select cells of interest to create new metadata on which ad-
rat and our homemade Wilcoxon methods are scalable. ditional operations can be performed, such as a novel dif-
Finally, we have also developed in Java the functional en- ferential expression calculation. Finally, the user can also
richment step using a simple Fisher’s Exact Test, thereby annotate the clusters according to marker genes (with a cell
considering the correct background for not inflating the type for example), either from this view or directly from the
resulting P-values. This method is scalable as well to any ‘Marker Gene’ view in the differential expression step.
dataset.
Estimation of time and RAM for each tool
Outputs
With this new version, we developed a novel tool to pre-
For most steps, the main output is a newly annotated .loom dict the computing time and maximum RAM that will be
file. For example, when generating a dimension reduction required by a job, before running it. To achieve this, we
output, the initial .loom file is modified with an additional store certain characteristics of jobs that were run by users
column attribute containing the ‘cells vs. components’ re- in a separate versioned database. These include the size of
sult matrix. In addition, the user can visualize this data di- the dataset (number of cells/rows) that was used as inputW410 Nucleic Acids Research, 2020, Vol. 48, Web Server issue
Downloaded from https://academic.oup.com/nar/article/48/W1/W403/5843818 by guest on 01 October 2020
Figure 6. UMAP visualization of an HCA public project involving 780k cells with coloring options. After dimension reduction, the user can see 2D and
3D plots of the dataset. Here, we show an ASAP project that was created using the HCA Matrix service feature (see Figure 3) involving ∼780k cells from
human bone marrow + cord blood. The pipeline was run until the UMAP step which is what is visualized in the top and bottom panels. In each panel,
on the right, we opened the ‘Controls’ view which allows the user to change the appearance of the plot (size of the points, colors, etc..) and to manage
any clustering results (and eventually annotate clusters). (A) Here, we show coloring by the number of detected genes. This shows a region which seems to
have much more detected/expressed genes which can be a biological result or may represent doublets. (B) Here, the cells are colored using an annotation
that was imported from the HCA: ‘derived organ parts ontology’. We can clearly see the coloring of the two organ parts that compose the dataset: bone
marrow and cord blood, which highlights a need for better integration of both datasets. One way would be to use Seurat or MNN methods to remove the
batch effect between the two organ parts, this is currently in development (see Discussion).
and the time/RAM that was required by the job, provid- ing a CRON task and are stored as .Rdata files for fast pre-
ing the run was successful. Currently, the prediction is only diction in the UI.
made based on the size of the dataset, but in the future, we
may consider adding method parameters as well (in case
Project sharing
they have a strong effect on the overall computing time and
RAM usage predictions). We use two simple linear mod- A key feature of our upgraded ASAP web application is
els that are trained on these datasets for every tool that is the interactivity and collaboration possibilities. To imple-
present in ASAP: (i) time ∼ nbcells * nbgenes and (ii) ram ment this, we established a project sharing system, allow-
∼ nbcells * nbgenes. These models are recomputed daily us- ing concurrent access to the same project. Users can shareNucleic Acids Research, 2020, Vol. 48, Web Server issue W411
their projects with other ASAP users (or send an email to flow (https://singlecell.usegalaxy.eu/), (b) and another one
a novel user who will need to register) to allow accessing specifically designed for the analysis of data from the Hu-
the same project simultaneously. We set up right permis- man Cell Atlas initiative (https://humancellatlas.usegalaxy.
sions, so that the owner of a project can control his/her eu/). The latter is connected to the HCA Matrix service to
projects in terms of visibility, modification, and further import datasets, and relies on the UCSC Cell Browser (Ta-
sharing. There is also the possibility to render a project ble 1) or the Single-cell Expression Atlas (39) for visualiza-
public, or to clone a project. Public projects are associated tion.
with a unique ASAP-ID that can be listed in a publication As we can see in Table 1, ASAP is amongst the first por-
and that can be used for enhanced reproducibility in pub- tals that are directly linked to the Human Cell Atlas (7).
lished papers. Symmetrically, the PMID of the published In addition, most portals are in essence visualization tools
work can be entered in the details of the ASAP project that require external pipelines to analyze a dataset, which
and the reference will then be displayed on the project can then be visualized in the respective portal (see ‘NO pre-
page. computed results’ in Table 1). Few portals therefore sup-
Downloaded from https://academic.oup.com/nar/article/48/W1/W403/5843818 by guest on 01 October 2020
Once a project is open, any change in the status of anal- port a complete end-to-end analysis of the data within a
yses is transmitted to the user through Websockets (Active- web user interface, and the ones that do tend to require
Cable in Ruby-on-Rails). This feature enables interactive, a local or cloud installation. In contrast, and as indicated
collaborative projects, since any modification to a project in (38): ‘ASAP is a comprehensive hosting platform and as
by any of the sharing users is indicated to the others in real such it does not require a local or cloud installation’. Con-
time. sequently, and contrary to most available portals, ASAP
users can perform all the desired analyses directly within
the portal, and do not have to consider installation prereq-
uisites. Moreover, given ASAP’s multi-user functionalities,
DISCUSSION AND FUTURE IMPLEMENTATIONS
users can share their analysis projects with others in an in-
Single-cell omics technologies are increasingly applied in teractive and modular fashion, which is currently unique to
both biological as well as clinical research to identify new ASAP (see Table 1, ‘Sharing system’).
cell types and to uncover cellular dynamics during de- We are also currently working with the Fly Cell Atlas
velopment or disease (e.g. tumor heterogeneity). Conven- (FCA) consortium (https://flycellatlas.org/) to generate a
tional pipelines tend to require hours/days of work by central repository for atlas-like initiatives. In particular, we
a trained bioinformatician to deliver meaningful results. are collaborating with the Scope (17) portal to develop new
ASAP’s main goal is to aid with the interpretation of these methods for crowd annotation of clusters into cell types.
data since the whole pipeline can be run in minutes, provid- Indeed, we believe that the next important demand in the
ing on-the-go visualization, identification of new cell or dis- single-cell field will be the ability to implement accurate cell
ease populations by clustering, differential expression anal- annotations (40,41). Currently, this is still a great, outstand-
ysis and enrichment. With ASAP, we strive to build a cen- ing challenge that requires hours of manual annotation and
tralized platform to store single-cell projects and their com- literature review. To address this, we plan to use the available
plete analyses in a shareable and reproducible fashion. The user base of ASAP and SCope to create a crowd-based an-
interface of ASAP is designed to be user-friendly and pro- notation of cells though an individual curation and voting
vides versatility with a library of state-of-the-art tools that system, thereby reinforcing correct cluster annotations. This
are documented. Tutorials thereby guide the user through will lead to the creation of a public database that will record
the different steps of the analysis. Users can easily upload cell identity features (such as marker genes) from personal
their dataset and readily start working with it through in- projects as well as from those hosted by atlas-like initiatives
teractive plots and output tables without previous analysis (such as the HCA or the FCA). Thereafter, we plan to use
experience. this database for the interactive and automated annotation
Given the desire of the research community at large to of cells.
render single-cell analyses more accessible, several other Finally, we would like to point out that scATAC-seq
interactive visualization tools or platforms have been de- datasets from 10x (CellRanger output) can in principle also
veloped in parallel (38). Building on a recent pre-print be loaded into ASAP. For now, they can only be processed
overviewing these tools (38), we compared the new version with the same scRNA-seq pipeline, i.e. no specific methods
of ASAP (2020) presented in this manuscript to the orig- have so far been added such as cisTopic (42) or other motif
inal one (ASAP 2017) (14), and to the other state-of-the enrichment analysis tools. However, the user can still per-
art tools that are currently available (see Table 1). Here, form UMAP/t-SNE and/or clustering, which can already
we mostly focused on tools with a web interface, thus dis- be insightful. This shows the modular capacity of ASAP,
regarding (i) software such as the BioTuring Single-Cell which potentially offers a platform that will be able to in-
Browser (Bbrowser) or the Loupe cell browser, and (ii) clude a more specific scATAC-seq data analysis workflow
packages such as Seurat (32) or scanpy (12). Other por- in the future.
tals, such as the Single-Cell Expression Atlas (39) are only We also plan to add an integration feature with the goal of
meant to visualize public datasets, and thus are not designed integrating datasets and of correcting for batch effects. We
for user-specific datasets. Conversely, we can also mention are aware of existing techniques that support such integra-
two Galaxy servers that simplify the processing pipeline but tion, such as MNN (43) or Seurat (32,44), and are bench-
do not support an interactive visualization of the results: marking them on high-dimensional datasets to select the
(a) a common server providing a single-cell analysis work- most relevant method.W412 Nucleic Acids Research, 2020, Vol. 48, Web Server issue
Table 1. Overview of state-of-the-art web portals supporting single-cell RNA-seq data analysis and interactive visualization. Two versions of ASAP were
compared to state-of-the-art tools. Docker indicates whether a docker image with the tool is provided by the developers. HCA: Human Cell Atlas. Bench-
marking tools: The ability to monitor all the tools on the platform for computing time and/or RAM usage. Cell-type annotation: The ability to interactively
annotate clusters/cell types
ASAP ASAP Single Cell UCSC Cell
cellxgene Granatum iSEE SCope scSVA
2017 2020 Explorer Browser
This
REFERENCE (14) GitHub (45) (46) (17) (47) (48) GitHub
study
Csv/txt
INPUT FORMAT
Loom
CellRanger
.h5
h5ad
SCE
Downloaded from https://academic.oup.com/nar/article/48/W1/W403/5843818 by guest on 01 October 2020
Seurat obj
Importing
user’s data
USER DATA
NO pre-
computed
results
Scalable
>1M cells
Hosted
WEB SERVER
server or
local install
Prog.
language
Docker
Sharing
system
HCA Matrix
PORTAL FEATURES
Service
Publish
project
Benchmarki
ng tools
Gene set
enrichment
Cell-type
annotation
Interactive
cell filtering
*A remote website was also available but seemed to mostly serve as an example, since no job queuing system was implemented, the website became
inaccessible every time a step was launched
** SingleCellExplorer ‘Click here to Launch’ remote server was not functioning at the time of this paper
DATA AVAILABILITY FUNDING
ASAP is freely available at https://asap.epfl.ch. It is an Chan Zuckerberg Initiative (CZI) grant for collaborative
open source software whose source code is deposited in computational tools [2018-182612 (5022)]; Precision Health
two GitHub repositories: (i) the R/Python/Java scripts are & related Technologies grant [PHRT-502]; Swiss National
deposited in https://github.com/DeplanckeLab/ASAP and Science Foundation (SNSF) project grant [310030 182655];
are available as a ready-to-use Docker container at https:// institutional support by the EPFL (Open Science Fund).
hub.docker.com/r/fabdavid/asap run/tags and (ii) the server Funding for open access charge: Open Science fund from
code is available at https://github.com/fabdavid/asap2 web. the EPFL. The open access publication charge for this pa-
per has been waived by Oxford University Press – NAR Edi-
torial Board members are entitled to one free paper per year
ACKNOWLEDGEMENTS in recognition of their work on behalf of the journal.
Conflict of interest statement. None declared.
We would like to thank the ASAP user community for pro-
viding great feedback and interesting discussions on how to
best evolve ASAP. We also thank Peter L. Hliva for techni- REFERENCES
cal help in the implementation of certain visualizations and 1. Wang,Y. and Navin,N.E. (2015) Advances and applications of
Alex R. Lederer who helped us reviewed this manuscript. single-cell sequencing technologies. Mol. Cell, 58, 598–609.Nucleic Acids Research, 2020, Vol. 48, Web Server issue W413
2. Hu,Y., An,Q., Sheu,K., Trejo,B., Fan,S. and Guo,Y. (2018) Single cell 24. Hubbard,T., Barker,D., Birney,E., Cameron,G., Chen,Y., Clark,L.,
multi-omics technology: methodology and application. Front. Cell Cox,T., Cuff,J., Curwen,V., Down,T. et al. (2002) The ensembl
Dev. Biol., 6, 28. genome database project. Nucleic Acids Res., 30, 38–41.
3. Svensson,V., Vento-Tormo,R. and Teichmann,S.A. (2018) 25. Ashburner,M., Ball,C.A., Blake,J.A., Botstein,D., Butler,H.,
Exponential scaling of single-cell RNA-seq in the past decade. Nat. Cherry,J.M., Davis,A.P., Dolinski,K., Dwight,S.S., Eppig,J.T. et al.
Protoc., 13, 599–604. (2000) Gene ontology: tool for the unification of biology. The gene
4. Hung,R.J., Hu,Y., Kirchner,R., Liu,Y., Xu,C., Comjean,A., ontology consortium. Nat. Genet., 25, 25–29.
Tattikota,S.G., Li,F., Song,W., Ho Sui,S. et al. (2020) A cell atlas of 26. Kanehisa,M. and Goto,S. (2000) KEGG: kyoto encyclopedia of
the adult Drosophila midgut. PNAS, 117, 1514–1523. genes and genomes. Nucleic Acids Res., 28, 27–30.
5. Aizarani,N., Saviano,A., Sagar,Mailly, L., Durand,S., Herman,J.S., 27. Wishart,D.S., Knox,C., Guo,A.C., Cheng,D., Shrivastava,S., Tzur,D.,
Pessaux,P., Baumert,T.F. and Grun,D. (2019) A human liver cell atlas Gautam,B. and Hassanali,M. (2008) DrugBank: a knowledgebase for
reveals heterogeneity and epithelial progenitors. Nature, 572, drugs, drug actions and drug targets. Nucleic Acids Res., 36,
199–204. D901–D906.
6. Cao,J., Packer,J.S., Ramani,V., Cusanovich,D.A., Huynh,C., 28. Franzen,O., Gan,L.M. and Bjorkegren,J.L.M. (2019) PanglaoDB: a
Daza,R., Qiu,X., Lee,C., Furlan,S.N., Steemers,F.J. et al. (2017) web server for exploration of mouse and human single-cell RNA
Comprehensive single-cell transcriptional profiling of a multicellular sequencing data. Database, 2019, doi:10.1093/database/baz046.
Downloaded from https://academic.oup.com/nar/article/48/W1/W403/5843818 by guest on 01 October 2020
organism. Science (New York, N.Y.), 357, 661–667. 29. Zhang,X., Lan,Y., Xu,J., Quan,F., Zhao,E., Deng,C., Luo,T., Xu,L.,
7. Regev,A., Teichmann,S.A., Lander,E.S., Amit,I., Benoist,C., Liao,G., Yan,M. et al. (2019) CellMarker: a manually curated
Birney,E., Bodenmiller,B., Campbell,P., Carninci,P., Clatworthy,M. resource of cell markers in human and mouse. Nucleic Acids Res., 47,
et al. (2017) The human cell atlas. eLife, 6, doi:10.7554/eLife.27041. D721–D728.
8. Han,X., Wang,R., Zhou,Y., Fei,L., Sun,H., Lai,S., Saadatpour,A., 30. Diehl,A.D., Meehan,T.F., Bradford,Y.M., Brush,M.H.,
Zhou,Z., Chen,H., Ye,F. et al. (2018) Mapping the mouse cell atlas by Dahdul,W.M., Dougall,D.S., He,Y., Osumi-Sutherland,D.,
microwell-seq. Cell, 172, 1091–1107. Ruttenberg,A., Sarntivijai,S. et al. (2016) The cell ontology 2016:
9. Schaum,N., Karkanias,J., Neff,N.F., May,A.P, Quake,S.R., enhanced content, modularization, and ontology interoperability. J.
Wyss-Coray,T., Darmanis,S., Batson,J., Botvinnik,O., Chen,M.B. Biomed. Semantics., 7, 44.
et al. (2018) Single-cell transcriptomics of 20 mouse organs creates a 31. Andrews,T.S. and Hemberg,M. (2019) M3Drop: dropout-based
Tabula Muris. Nature, 562, 367–372. feature selection for scRNASeq. Bioinformatics, 35, 2865–2867.
10. Luecken,M.D. and Theis,F.J. (2019) Current best practices in 32. Satija,R., Farrell,J.A., Gennert,D., Schier,A.F. and Regev,A. (2015)
single-cell RNA-seq analysis: a tutorial. Mol. Syst. Biol., 15, e8746. Spatial reconstruction of single-cell gene expression data. Nat.
11. Rostom,R., Svensson,V., Teichmann,S.A. and Kar,G. (2017) Biotechnol., 33, 495–502.
Computational approaches for interpreting scRNA-seq data. FEBS 33. McInnes,L., Healy,J., Saul,N. and Großberger,L. (2018) Umap:
Lett., 591, 2213–2225. uniform manifold approximation and projection. J. Open Source
12. Wolf,F.A., Angerer,P. and Theis,F.J. (2018) SCANPY: large-scale Softw., 3, 861.
single-cell gene expression data analysis. Genome Biol., 19, 15. 34. Maaten,L.v.d and Hinton,G. (2008) Visualizing data using t-SNE. J.
13. Cusanovich,D.A., Hill,A.J., Aghamirzaie,D., Daza,R.M., Mach. Learn. Res., 9, 2579–2605.
Pliner,H.A., Berletch,J.B., Filippova,G.N., Huang,X., 35. Kiselev,V.Y., Kirschner,K., Schaub,M.T., Andrews,T., Yiu,A.,
Christiansen,L., DeWitt,W.S. et al. (2018) A single-cell atlas of in vivo Chandra,T., Natarajan,K.N., Reik,W., Barahona,M., Green,A.R.
mammalian chromatin accessibility. Cell, 174, 1309–1324. et al. (2017) SC3: consensus clustering of single-cell RNA-seq data.
14. Gardeux,V., David,F.P.A., Shajkofci,A., Schwalie,P.C. and Nat. Methods, 14, 483–486.
Deplancke,B. (2017) ASAP: a web-based platform for the analysis 36. Law,C.W., Chen,Y., Shi,W. and Smyth,G.K. (2014) voom: precision
and interactive visualization of single-cell RNA-seq data. weights unlock linear model analysis tools for RNA-seq read counts.
Bioinformatics, 33, 3123–3125. Genome Biol., 15, R29.
15. Boettiger,C. (2015) An introduction to Docker for reproducible 37. Love,M.I., Huber,W. and Anders,S. (2014) Moderated estimation of
research. SIGOPS Oper. Syst. Rev., 49, 71–79. fold change and dispersion for RNA-seq data with DESeq2. Genome
16. Merkel,D. (2014) Docker: lightweight Linux containers for consistent Biol., 15, 550.
development and deployment. Linux J., 2014, Article 2. 38. Çakır,B., Prete,M., Huang,N., van Dongen,S., Pir,P. and Kiselev,V.Y.
17. Davie,K., Janssens,J., Koldere,D., De Waegeneer,M., Pech,U., (2020) Comparison of visualisation tools for single-cell RNAseq data.
Kreft,L., Aibar,S., Makhzami,S., Christiaens,V., Bravo bioRxiv doi: https://doi.org/10.1101/2020.01.24.918342, 07 February
Gonzalez-Blas,C. et al. (2018) A single-cell transcriptome atlas of the 2020, preprint: not peer reviewed.
aging drosophila brain. Cell, 174, 982–998. 39. Papatheodorou,I., Moreno,P., Manning,J., Fuentes,A.M., George,N.,
18. Sievert,C., Parmer,C., Hocking,T., Chamberlain,S., Ram,K., Fexova,S., Fonseca,N.A., Fullgrabe,A., Green,M., Huang,N. et al.
Corvellec,M. and Despouy,P. (2017) plotly: Create interactive web (2020) Expression Atlas update: from tissues to single cells. Nucleic
graphics via ‘plotly. js’. R package version, 4, 110. Acids Res., 48, D77–D83.
19. Ono,K., Demchak,B. and Ideker,T. (2014) Cytoscape tools for the 40. Pliner,H.A., Shendure,J. and Trapnell,C. (2019) Supervised
web age: D3.js and Cytoscape.js exporters [version 2; peer review: 2 classification enables rapid annotation of cell atlases. Nat. Methods,
approved]. F1000Research, 3, 143. 16, 983–986.
20. Lopes,C.T., Franz,M., Kazi,F., Donaldson,S.L., Morris,Q. and 41. Hou,R., Denisenko,E. and Forrest,A.R.R. (2019) scMatch: a
Bader,G.D. (2010) Cytoscape Web: an interactive web-based network single-cell gene expression profile annotation tool using reference
browser. Bioinformatics, 26, 2347–2348. datasets. Bioinformatics, 35, 4688–4695.
21. Barrett,T., Troup,D.B., Wilhite,S.E., Ledoux,P., Rudnev,D., 42. Bravo Gonzalez-Blas,C., Minnoye,L., Papasokrati,D., Aibar,S.,
Evangelista,C., Kim,I.F., Soboleva,A., Tomashevsky,M., Hulselmans,G., Christiaens,V., Davie,K., Wouters,J. and Aerts,S.
Marshall,K.A. et al. (2009) NCBI GEO: archive for high-throughput (2019) cisTopic: cis-regulatory topic modeling on single-cell
functional genomic data. Nucleic Acids Res., 37, D885–D890. ATAC-seq data. Nat. Methods, 16, 397–400.
22. Brazma,A., Parkinson,H., Sarkans,U., Shojatalab,M., Vilo,J., 43. Haghverdi,L., Lun,A.T.L., Morgan,M.D. and Marioni,J.C. (2018)
Abeygunawardena,N., Holloway,E., Kapushesky,M., Kemmeren,P., Batch effects in single-cell RNA-sequencing data are corrected by
Lara,G.G. et al. (2003) ArrayExpress–a public repository for matching mutual nearest neighbors. Nat. Biotechnol., 36, 421–427.
microarray gene expression data at the EBI. Nucleic Acids Res., 31, 44. Butler,A., Hoffman,P., Smibert,P., Papalexi,E. and Satija,R. (2018)
68–71. Integrating single-cell transcriptomic data across different conditions,
23. Barrett,T., Clark,K., Gevorgyan,R., Gorelenkov,V., Gribov,E., technologies, and species. Nat. Biotechnol., 36, 411–420.
Karsch-Mizrachi,I., Kimelman,M., Pruitt,K.D., Resenchuk,S., 45. Zhu,X., Wolfgruber,T.K., Tasato,A., Arisdakessian,C., Garmire,D.G.
Tatusova,T. et al. (2012) BioProject and BioSample databases at and Garmire,L.X. (2017) Granatum: a graphical single-cell RNA-Seq
NCBI: facilitating capture and organization of metadata. Nucleic analysis pipeline for genomics scientists. Genome Med, 9, 108.
Acids Res., 40, D57–D63.W414 Nucleic Acids Research, 2020, Vol. 48, Web Server issue
46. Rue-Albrecht,K., Marini,F., Soneson,C. and Lun,A.T.L. (2018) 49. Goldman,M., Craft,B., Hastie,M., Repečka,K., Kamath,A.,
iSEE: Interactive SummarizedExperiment Explorer [version 1; peer McDade,F., Rogers,D., Brooks,A.N., Zhu,J. and Haussler,D. (2019)
review: 3 approved]. F1000Research, 7, 741. The UCSC Xena platform for public and private cancer genomics
47. Tabaka,M., Gould,J. and Regev,A. (2019) scSVA: an interactive tool data visualization and interpretation. bioRxiv doi:
for big data visualization and exploration in single-cell omics. https://doi.org/10.1101/326470, 05 March 2019, preprint: not peer
bioRxiv doi: https://doi.org/10.1101/512582, 06 January 2019, reviewed.
preprint: not peer reviewed. 50. Brennecke,P., Anders,S., Kim,J.K., Kolodziejczyk,A.A., Zhang,X.,
48. Feng,D., Whitehurst,C.E., Shan,D., Hill,J.D. and Yue,Y.G. (2019) Proserpio,V., Baying,B., Benes,V., Teichmann,S.A., Marioni,J.C. et al.
Single Cell Explorer, collaboration-driven tools to leverage large-scale (2013) Accounting for technical noise in single-cell RNA-seq
single cell RNA-seq data. BMC Genomics, 20, 676. experiments. Nat. Methods, 10, 1093–1095.
Downloaded from https://academic.oup.com/nar/article/48/W1/W403/5843818 by guest on 01 October 2020You can also read