Cholera Toxin Toxicity Does Not Require Functional Arf6- and Dynamin-dependent Endocytic Pathways D V
←
→
Page content transcription
If your browser does not render page correctly, please read the page content below
Molecular Biology of the Cell
Vol. 15, 3631–3641, August 2004

Cholera Toxin Toxicity Does Not Require Functional
Arf6- and Dynamin-dependent Endocytic Pathways□  D □
                                                   V

Ramiro H. Massol,* Jakob E. Larsen,* Yukako Fujinaga,† Wayne I. Lencer,†
and Tomas Kirchhausen*‡
*
Department of Cell Biology, Harvard Medical School and The Center for Blood Research for
Biomedical Research, Boston, Massachusetts 02115; and †Gastrointestinal Cell Biology, Department of
Pediatrics, Children’s Hospital and Harvard Medical School and the Harvard Digestive Diseases
Center, Boston, Massachusetts 02115

Submitted April 5, 2004; Accepted April 29, 2004
Monitoring Editor: Suzanne Pfeffer

Cholera toxin (CT) and related AB5 toxins bind to glycolipids at the plasma membrane and are then transported in a
retrograde manner, first to the Golgi and then to the endoplasmic reticulum (ER). In the ER, the catalytic subunit of CT
is translocated into the cytosol, resulting in toxicity. Using fluorescence microscopy, we found that CT is internalized by
multiple endocytic pathways. Inhibition of the clathrin-, caveolin-, or Arf6-dependent pathways by overexpression of
appropriate dominant mutants had no effect on retrograde traffic of CT to the Golgi and ER, and it did not affect CT
toxicity. Unexpectedly, when we blocked all three endocytic pathways at once, although fluorescent CT in the Golgi and
ER became undetectable, CT-induced toxicity was largely unaffected. These results are consistent with the existence of an
additional retrograde pathway used by CT to reach the ER.

INTRODUCTION                                                                         Pelkmans et al., 2001, 2002; Tsai et al., 2003). In CT, the A1
                                                                                     peptide is unfolded in the ER lumen and retrotranslocated by
Bacterial and plant protein exotoxins are among the most                             the Sec61p complex into the cytosol (Schmitz et al., 2000; Tsai et
lethal factors produced in nature. Some act on the cell sur-                         al., 2001, 2002), where it catalyzes the ADP-ribosylation of the
face by perturbing signaling pathways or by disrupting the                           heterotrimeric stimulatory G protein (Gs␣), permanently acti-
integrity of the plasma membrane, whereas others exploit                             vating adenylate cyclase (Kahn and Gilman, 1984; Van Dop et
membrane traffic pathways to gain access to their cytosolic                          al., 1984; Moss and Vaughan, 1988). The resulting increase in
targets (Montecucco, 1998; Sandvig and van Deurs, 2002a,b).                          intracellular cAMP (Schafer et al., 1970; Kassis and Fishman,
A well-characterized toxin of this latter group is cholera                           1982; Kassis et al., 1982) causes net intestinal salt and water
toxin (CT), produced by Vibrio cholerae. CT belongs to the AB                        secretion, resulting in massive secretory diarrhea (Spangler,
family of bacterial exotoxins and consists of a pentameric B                         1992), and changes in cell morphology (Guerrant et al., 1974;
subunit and an A subunit comprising two polypeptides, A1                             Donta et al., 1976; Barbieri et al., 2002) presumably due to
and A2, linked by a disulfide bond. The B subunit binds with                         activation of cAMP-dependent protein kinase A (Diviani and
high affinity and specificity to GM1, a ganglioside present in                       Scott, 2001; Scott, 2003).
apical membranes of all intestinal epithelial cells. The A1                             Exactly how the CT–GM1 complex traffics from the
polypeptide has ADP-ribosylase activity, whereas A2 con-                             plasma membrane to the Golgi and then to the ER remains
tains a carboxy-terminal KDEL ER retrieval signal.                                   unknown. One possibility is that the toxin-GM1 complex is
   CT first binds to GM1 at the apical surface of jejunal intesti-                   primarily carried to the ER by using a caveolin-dependent
nal cells and then follows a complex endocytic pathway in-                           retrograde trafficking pathway (Hagmann and Fishman,
volving retrograde membrane traffic through the Golgi com-                           1982; Montesano et al., 1982; Tran et al., 1987; Parton, 1994;
plex to the ER (Joseph et al., 1978; Joseph et al., 1979; Lencer et                  Mobius et al., 1999; Badizadegan et al., 2000; Fujinaga et al.,
al., 1993; Nambiar et al., 1993; Orlandi et al., 1993; Lencer et al.,                2003). Cholesterol depletion, or absence of endogenous
1995; Majoul et al., 1996; Majoul et al., 1998; Fujinaga et al., 2003).              caveolin (Fishman and Atikkan, 1980; Orlandi and Fishman,
Binding to GM1 associates CT with detergent-resistant mem-                           1998; Torgersen et al., 2001; Wolf et al., 2002; Fujinaga et al.,
branes, presumably lipid rafts; the CT– ganglioside complex                          2003), or caveolin depletion by RNA interference (Nichols,
then moves from the plasma membrane to the ER (Fujinaga et                           2002), however, do not completely prevent CT uptake or
al., 2003). Other toxins and some viruses also bind to glycolip-                     toxicity, with the exception of the work by Orlandi and
ids to enter the ER and cause disease (Falguieres et al., 2001;                      Fishman (1998) who found a complete block in cAMP pro-
                                                                                     duction by CT in response to filipin. It also has been pro-
                                                                                     posed that CT may enter cells via the clathrin-dependent
 Article published online ahead of print. Mol. Biol. Cell 10.1091/                   pathway, but inhibition of this pathway by chemical or
mbc.E04 – 04 – 0283. Article and publication date are available at
www.molbiolcell.org/cgi/doi/10.1091/mbc.E04 – 04 – 0283.
                                                                                     genetic treatments results in only a partial decrease in CT
 □D □
    V
      Online version of this article contains supporting material.                   uptake (Sofer and Futerman, 1995; Nichols et al., 2001;
 Online version is available at www.molbiolcell.org.                                 Shogomori and Futerman, 2001; Torgersen et al., 2001). A
 ‡
   Corresponding author. E-mail address: kirchhausen@crystal.                        third possible entry pathway not yet directly addressed is
   harvard.edu.                                                                      the one regulated by the small GTPase Arf6. This pathway is

                                           Supplemental Material can be found at:
© 2004 by The American Society for Cell Biology
                                           http://www.molbiolcell.org/content/suppl/2004/05/13/E04-04-0283.DC1.html                               3631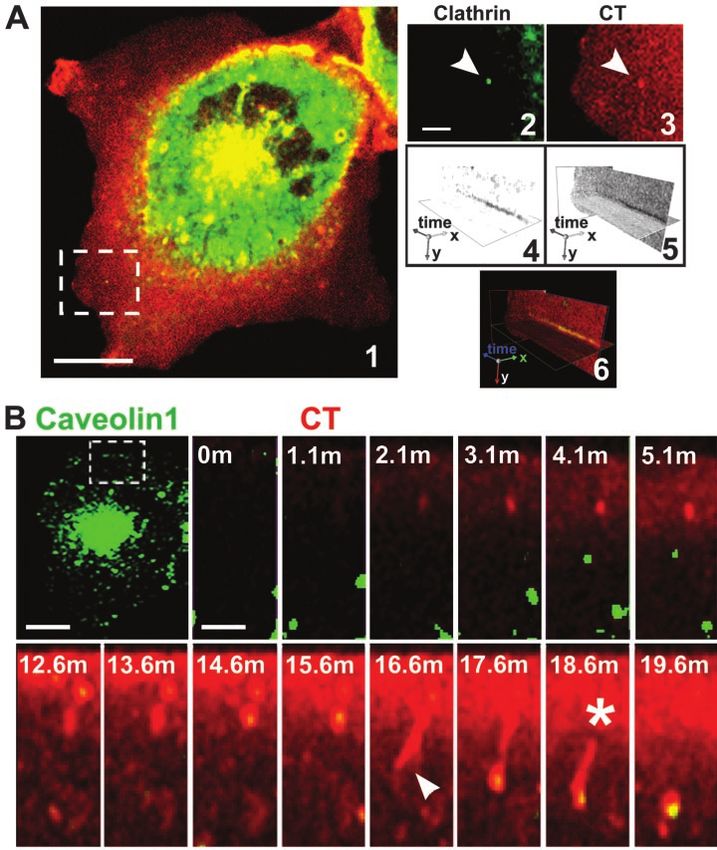
R.H. Massol et al.
functionally linked to EHD1 (Caplan et al., 2002) and is used histocompatibility complex (MHC) class I HLA-A2 fused to EGFP (EGFP-
by several proteins (major histocompatibility complex MHC-I) in its ectodomain was a kind gift from Dr. Domenico Tortorella
(Harvard Medical School, Boston, MA). The EHD1 cDNA (a kind gift from Dr.
[MHC] class I, interleukin 2 receptor, carboxypeptidase E, Mia Horowitz, Tel Aviv University, Tel Aviv, Israel) was fused with EGFP in
and 1 integrin receptor) that traffic between plasma mem- the pEGFP-C1 vector (BD Biosciences Clontech) to obtain EGFP-EHD1. The
brane and endosomes (Radhakrishna and Donaldson, 1997; rat light chain A1 subunit of clathrin (Kirchhausen et al., 1987) was fused to
Brown et al., 2001; Blagoveshchenskaya et al., 2002; Arnaou- EYFP in the pEGFP-C1 vector to obtain EYFP-LCA. All transfections were
carried out using FuGENE 6 (Roche Diagnostics, Indianapolis, IN), and cells
tova et al., 2003). It is also possible that CT shows no pref- were evaluated 24 – 48 h later.
erence for any given entry route and instead uses a combi-
nation of these pathways to arrive at the endosomal and CT Uptake
Golgi compartments. The traffic studies were performed using a mutant of CT, E112D, that is poorly
With the goal of determining the relative contribution of able to catalyze the ADP-ribosylation of substrates (Jobling and Holmes,
these entry routes in CT transport to the ER, we measured 2001). To render CT(E112D) fluorescent, this protein was first bound to
galactose beads, to protect the lysine residues of the GM1 binding domains of
toxin transport by imaging fluorescent CT, and toxin-in- CT, and then fluorescently labeled with Alexa Fluor 594 following the instruc-
duced activation of adenylyl cyclase by scoring CT-induced tions of the manufacturer (Molecular Probes), obtaining a degree of labeling
changes in cell shape while interfering specifically with of ⬃1.2 moles of dye per mole of protein. For simplicity, we refer to the Alexa
clathrin-, caveolin-, or Arf6-dependent endocytosis alone, or 594-labeled CT(E112D) as CT(E112D) from here on. Functional tests in Y-1
cells by using fluorescently labeled CT(E112D) at very high concentrations
all three pathways together. Inhibition of the caveolin, clath- (⬎40 nM) demonstrated that this toxin still maintains a low toxicity (our
rin, or Arf6 pathways alone had minimal effects on CT entry, unpublished data), indicating that the addition of fluorophores did not mod-
whereas the simultaneous block of entry through all these ify the binding and traffic properties of CT.
three pathways lead to a substantial reduction of at least Continuous uptake of CT was performed by loading BSC1 or Y-1 cells with
20 nM CT(E112D) in minimal essential medium supplemented with 20 mM
100-fold in the steady-state accumulation of CT in the endo- HEPES and 0.5 g% bovine serum albumin (HMEMB) at 37°C for different
somal and Golgi compartments. Unexpectedly, the com- times (20 –150 min). Cells were washed and fixed or transferred to a live-cell
bined inhibition of clathrin, caveolin, and Arf6 endocytic imaging chamber for time-lapse recording. Alternatively, CT(E112D) was
pathways had minimal effects on CT-induced toxicity. Based bound at 4°C for 30 min before removing the unbound toxin and shifting to
37°C. We followed the real-time uptake of CT by replacing the medium in the
on these results, we suggest that an additional route for CT temperature-controlled chamber with 37°C prewarmed medium containing
entry that is dynamin and Arf6 independent and of sufficient 30 nM CT.
transport capacity exists to allow toxin access to the ER.
Antibody Staining of BSC1 Cells
Cells were fixed in 3% paraformaldehyde (PFA) in phosphate-buffered saline
MATERIALS AND METHODS (PBS) for 10 min at room temperature (RT), washed with PBS supplemented
with 1 mM MgCl2 and 0.1 mM CaCl2 (PBS⫹⫹), and excessive PFA reactive
Reagents groups were quenched with 50 mM NH4Cl in PBS⫹⫹ for 15 min at RT. To
The following reagents were used: latrunculin A, nocodazole, and wild-type prevent unspecific binding of antibodies, samples were incubated with 2%
cholera toxin (Calbiochem, San Diego, CA); methyl--cyclodextrin, phorbol BSA in PBS⫹⫹ for 30 min at RT. All antibodies were diluted in HMEMB
12-myristate 13-acetate (PMA), genistein, brefeldin A (BFA), forskolin, and supplemented with 0.1 g% saponin. For microtubule staining we used a rat
8-Br-cAMP (Sigma-Aldrich, St. Louis, MO); geneticin (Invitrogen, Carlsbad, anti-␣-tubulin monoclonal antibody (1:200; Oxford Biotechnology, Raleigh,
CA); and BODIPY FL-C5-ganglioside fluorescent GM1 lipids (Molecular NC) followed by goat anti-rat Cy3-labeled secondary antibody (Jackson Im-
Probes, Eugene, OR). munoResearch Laboratories, West Grove, PA). A purified mouse monoclonal
antibody (W6/32; hybridoma generously provided by Dr. Hidde Ploegh,
Harvard Medical School), which recognizes assembled MHC-I heavy
Cells chain-2 microglobulin complexes, was used for MHC-I-antibody feeding
BSC1 monkey kidney epithelial cells (ATCC CCL-26), and Y-1 mouse adrenal experiments. Staining for the early endosomal marker EEA1 or the AP-2
cells (ATCC CCL-79) were grown in DMEM or RPMI 1640 medium, respec- adaptor complex was performed with a goat polyclonal anti-EEA1 antibody
tively, supplemented with 10% fetal bovine serum, 2 mM l-glutamine, pen- (Santa Cruz Biotechnology, Santa Cruz, CA) or a rabbit polyclonal anti-2
icillin (50 U/ml), streptomycin (50 mg/ml), and nonessential amino acids (0.1 (produced in our laboratory), respectively. The trans-Golgi network (TGN)
mM). Most morphological studies were performed with the larger BSC1 cells; and the Golgi matrix were stained with a sheep anti-human TGN46 poly-
Y-1 cells were used for the toxicity assay due to their fast and striking change clonal antibody (Serotec, Raleigh, NC) or a mouse monoclonal anti-GM130
in shape after a CT-induced increase in cAMP. For CT traffic studies, cells (BD Biosciences, San Jose, CA), respectively. HA and c-myc epitopes were
were grown on coverslips (18- or 25-mm sterile coverslips) to 50 –70% con- detected using mouse monoclonal antibodies 12CA5 (harvested from hybrid-
fluence. For live-cell imaging studies of CT access to the Golgi complex, we oma cells), and 9E10 (Santa Cruz Biotechnology), respectively. The antibody–
generated a clone of BSC1 cells stably expressing a chimera comprised of the epitope complexes were visualized by secondary staining with Alexa488,
Golgi sorting signal of galactosyltransferase fused to enhanced green fluores- Alexa594, or Alexa647-goat anti-mouse antibodies (Molecular Probes).
cent protein (EGFP) (BSC1/GalT-EGFP). We made the expression vector by
subcloning GalT-EGFP from the pST-GalT-EGFP (kind gift from Dr. Jennifer cAMP-dependent Morphological Change Assay
Lippincott-Schwartz, National Institutes of Health, Bethesda, MD) into the
pEGFP-N1 vector (BD Biosciences Clontech, Palo Alto, CA). A single-cell based cAMP-dependent change in cell morphology assay was
used to assess CT-induced toxicity. The assay relies on scoring the dramatic
alteration in cellular morphology observed on cells attached to a substrate in
Transfection response to an increase of intracellular cAMP levels. This assay was devel-
Hemagglutinin (HA) and EGFP-tagged constructs of the dynamin 1 and 2 oped as a way to indirectly determine the levels of cAMP due to direct or
dominant negative mutants K44A (DynK44A), respectively, were kind gifts indirect activation of adenylate cyclase (Kowal and Fiedler, 1969; Guerrant et
from Dr. Sandra Schmid (The Scripps Research Institute, La Jolla, CA). Hu- al., 1974; Maneval et al., 1981; Maenhaut and Libert, 1990; Ulaner et al., 1999).
man HA-tagged Arf6 (wild type, T27N, or Q67L) plasmids were kind gifts Incubations with CT; forskolin, a direct activator of adenylate cyclase
from Dr. Julie Donaldson (National Institutes of Health), and Dr. Michel (Seamon and Daly, 1981; Seamon et al., 1981); or the cell-permeable cAMP
Franco (Institut dePharmacologie Moléculaire et Cellulaire, Centre National analogues dibutyryl cAMP or 8-bromo-cAMP (8-Br-cAMP) elicited similar
de la Recherche Scientifique, Valbonne, France). Dr Jeffrey Pessin (University cell shape changes over the same period (Nambiar et al., 1993; Dong et al.,
of Iowa, Iowa City, IA) generously provided plasmids encoding myc-tagged 1998; Ulaner et al., 1999). It is presumed that the changes in cell shape depend
caveolin 1 wild type, and mutants S80E and S80A. Two other myc-tagged on the activation of cAMP-dependent protein kinase influencing the actin
mutants of caveolin 1 [Cav1(KSF) and Cav1(DGI)] were generated based on cytoskeleton (reviewed by Diviani and Scott, 2001).
previously reported mutants of Cav3 (Luetterforst et al., 1999). Briefly, after Y-1 adrenal cells were seeded at 20 –30 ⫻ 104 cells/well on 18-mm cover-
protein homology alignment of the full-length wild-type caveolin 1 and 3 slips for 24 h and transfected or not with different plasmids encoding the
sequences, EcoRI restriction sites followed by Kozak sequences and start proteins interfering with membrane traffic. Twenty-four hours later, the cells
codons before positions K135 or D82 were incorporated by site-directed were washed with PBS⫹⫹ and then incubated with HMEMB medium with
mutagenesis (QuikChange; Stratagene, La Jolla, CA) into full-length caveolin different concentrations of forskolin, CT holotoxin (wild type or E112D mu-
1. The resulting N terminus-truncated mutants were cloned into pCDNA3- tant), or CT B subunit for 1.5 h at 37°C. Inhibition of clathrin-dependent
myc-his and verified by sequencing. Dr. Jennifer Lippincott-Schwartz kindly endocytosis was determined by visual inspection of fluorescent human trans-
provided a plasmid encoding EGFP-Eps15⌬95–295 fused to EGFP. The major ferrin (Tf) internalized during the last 15 min. Cells were fixed and processed
3632 Molecular Biology of the Cell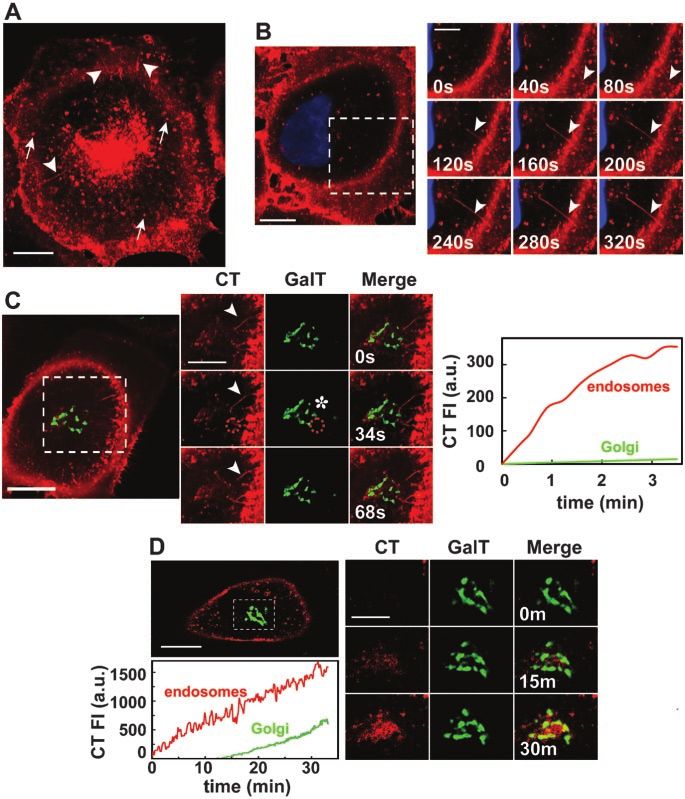
Cholera Toxin Endocytosis and Toxicity
Figure 1. Vesicles and tubules internalize
CT to a perinuclear endosomal compart-
ment. (A) CT traffics in vesicles (arrows) and
tubules (arrowheads) from the plasma
membrane toward the perinuclear endoso-
mal/Golgi area (Movie 1). BSC1 cells were
incubated with 20 nM nontoxic mutant
CT(E112D) labeled with Alexa594 (red) at
37°C for 45 min. (B) CT enters BSC1 cells via
both vesicles and tubules (arrowheads).
BSC1 cells were incubated with 20 nM
CT(E112D) at 4°C for 30 min, shifted to 37°C
for 2 min, and then the time course of toxin
internalization was recorded (inset and
Movie 3). Nucleus was stained with
Hoechst (blue). (C) Endocytic tubules con-
taining CT (arrowhead) extend from the cell
surface toward a perinuclear endosomal
compartment in close contact with the Golgi
complex (GalT-EGFP, green). BSC1 cells
were incubated as described in B. Selected
snapshots of time course of CT internaliza-
tion are shown. The plot shows the time
course of CT appearance in endosomes (red
line) within the indicated area (red stippled
circle); after this brief uptake period, almost
no CT reaches the Golgi, including the re-
gions in proximity with the tubules (* in
image and green line in plot). Colocalization
of CT with the Golgi region was calculated
by r analysis as explained in MATERIALS
AND METHODS. (D) CT is first transported
to endosomes before reaching the Golgi
complex. CT(E112D) was added to BSC1/
GalT-EGFP cells at 37°C during recording of
time lapse. Selected snapshots are shown
after 0, 15, and 30 min of CT addition. Co-
localization of CT with the Golgi region
(stippled box) was calculated as described in
C. The plot shows the continuous accumu-
lation of CT in endosomes (red line) and
Golgi complex (green line). Bars, 20 m
(whole cell) and 10 m (cropped areas).
for fluorescence microscopy. Random fields were imaged, and 100 –300 cells cently labeled with Alexa594. Although most of the entering
were analyzed by phase contrast (all cells) and by fluorescence (transfected CT was found in small vesicles moving from the surface to
cells) microscopy. A change in morphology was scored when the cell looked
rounded rather than flat and/or showed long processes. The fluorescent the cell interior, a fraction was detected in tubules (Figure
images corresponding to the transfected cells offered a simple and nonam- 1A). The tubules seem uniformly labeled with CT and seem
biguous way to determine their cell shape, particularly in regions of relatively to emanate from the plasma membrane. They are long
high cell density. Phase contrast images were used to confirm the scoring by
using fluorescent images and to determine the effect of any given treatment in (20 –30 m) and dynamic, stretching and retracting and
the surrounding nontransfected cells (internal control). All experiments were pointing toward the perinuclear region (Figure 1A, arrow-
repeated at least four times. heads, and Movie 1 in Supplement). Most vesicles and tu-
bules moved bidirectionally along microtubule tracks, as
Microscopy Data Acquisition and Processing
judged by their colocalization with tubulin (Movie 2 and Fig.
Images were acquired and processed as described previously (Larsen et al.,
2004). The amount of CT localized in the trans-Golgi network (TGN)/Golgi
s1A in Supplement). Consistent with these results, depoly-
compartments was determined within masked regions defined by intensity- merization of microtubules by nocodazole treatment inter-
based segmentation (Slidebook, Intelligent Imaging Innovations, Denver, fered with the directed motion of the vesicular carriers con-
CO). The contribution to CT fluorescent signal originating from the Golgi/ taining CT and prevented tubule formation (Fig. s1B in
TGN was corrected from the signal in adjacent endosomes by determining the
spatial correlation coefficients (r) of fluorescence intensities in both compart- Supplement).
ments as defined by specific organelle markers. This correction was per- We determined that these vesicles and tubules carry CT
formed for each time frame of every time-lapse series recorded. The relative from the plasma membrane to the cell interior by following
fraction of CT localized in the ER was estimated from the fluorescent signal
generated within a mask corresponding to the nuclear envelope. About 20
the entry of the toxin prebound to the cell surface at 4°C. On
cells per condition were analyzed. warming the cells to 37°C, CT occurred in vesicles and
tubules (Figure 1B), confirming the endocytic nature of these
RESULTS carriers. It is unlikely that CT induced the formation of the
tubules, because similar results were observed by monitor-
Vesicles and Tubules Transport CT from the Cell Surface ing the traffic of Bodipy-GM1, a fluorescent analog of the CT
to Endosomes before CT Can Access the Golgi Complex receptor (our unpublished data). Internalized CT reached
CT traffic was monitored in BSC1 cells by live-cell confocal the endosomal compartment before arriving at the Golgi
microscopy by using a nontoxic CT mutant, E112D, fluores- complex. Figure 1, C and D (plots), shows a marked lag
Vol. 15, August 2004 3633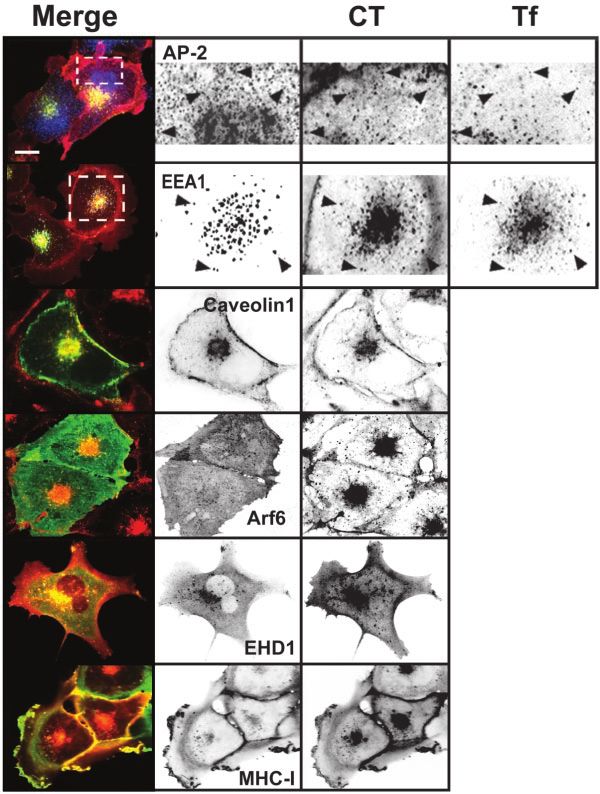
R.H. Massol et al.
Figure 2. Cholera toxin colocalizes with markers of the clathrin-, caveolin-,
and Arf6-dependent endocytic pathways. BSC1 cells were incubated with 20
nM CT(E112D) and 50 g/ml Alexa 647-hTf for 15 min (top two rows) or 45
min at 37°C and fixed. Colocalization between CT and AP-2, EEA1, Arf6, or
MHC-I was established by immunofluorescence. Caveolin 1 and EHD1
were tagged with EGFP and transiently expressed in BSC1 cells. Arrow-
heads indicate colocalization of CT with AP-2 (presumably in clathrin-
coated pits and vesicles), with EEA1 (early endosomes) together with inter-
nalized Tf. Representative confocal images from ventral (top row) or middle
sections of cells (all others) are shown. Selected regions (stippled-line boxes)
were cropped, enlarged, and displayed using an inverted monochrome
color scale to aid visualization. Bar, 20 m.
phase of 10 –15 min before fluorescent CT can be seen to tion of CT follows the dynamics of each of these proteins.
colocalize with the Golgi marker GalT-EGFP. For example, in cells expressing Cav1-EGFP we found that
CT first binds to the cell surface and is then carried by
Cholera Toxin Enters through Clathrin-, Caveolin-, and vesicles or short tubular structures containing caveolin that
Arf6-dependent Pathways move toward the perinuclear region (see Movie 3 in Supple-
To identify entry routes for CT in BSC1 cells, we incubated ment).
the cells with this toxin and evaluated the extent of its
colocalization with markers specific for the clathrin-, caveo- Inhibiting All Three Identified Entry Pathways Does Not
lin-, and Arf6-dependent pathways in fixed and live cells. Prevent CT Toxicity
We observed partial colocalization of CT with the clathrin We assessed the relative contribution of the clathrin-, caveo-
adaptor AP-2 at the cell surface (Figure 2). The clathrin lin-, or Arf6-dependent pathways for CT entry by studying
pathway is the main route of entry to the early endosomal the effects of several inhibitory conditions for these entry
compartment. Consistent with the apparent entry of CT via pathways alone or in combination. Overexpression of a trun-
the clathrin pathway, CT was also found in endosomes, cated form of Eps15, Eps15⌬95-295, which blocks entry of Tf
colocalizing with endocytosed Tf and with the early endo- through the clathrin pathway (Benmerah et al., 1998, 1999),
somal marker EEA1 (Figure 2). However, it is clear that this did not block CT internalization as judged by the ratio of
is not the only entry pathway for CT. CT also colocalized fluorescent signal of CT at the plasma membrane to that in
with caveolin found at the cell surface and in the perinuclear the interior of the cell (Figure 4A). Likewise, treatments
region (Figure 2), and with vesicular structures containing known to disrupt the integrity or function of caveolae
Arf6, EHD1, and MHC-I (Figure 2). Together, these static (Smart et al., 1994; Anderson et al., 1996; Hailstones et al.,
observations are consistent with the possibility that all three 1998; Pelkmans et al., 2002), such as incubation with PMA,
of these pathways can mediate CT entry. Indeed, live-cell overexpression of the caveolin mutants Cav1S80E (Figure
imaging experiments performed with cells expressing fluo- 4A) cav1(KSF) and cav1(DGI) (our unpublished data), or
rescent protein chimeras of the clathrin light chain A (EYFP- incubation with genistein (Fig. s6C in Supplement) had min-
LCA1), caveolin 1 (Cav1-EGFP) (Figure 3), and EHD1 imal effects on CT entry. In contrast, expression of Cav1S80E
(EGFP-EHD1) (our unpublished data) showed that a frac- in 3T3L1 preadipocytes prevented CT entry, presumably
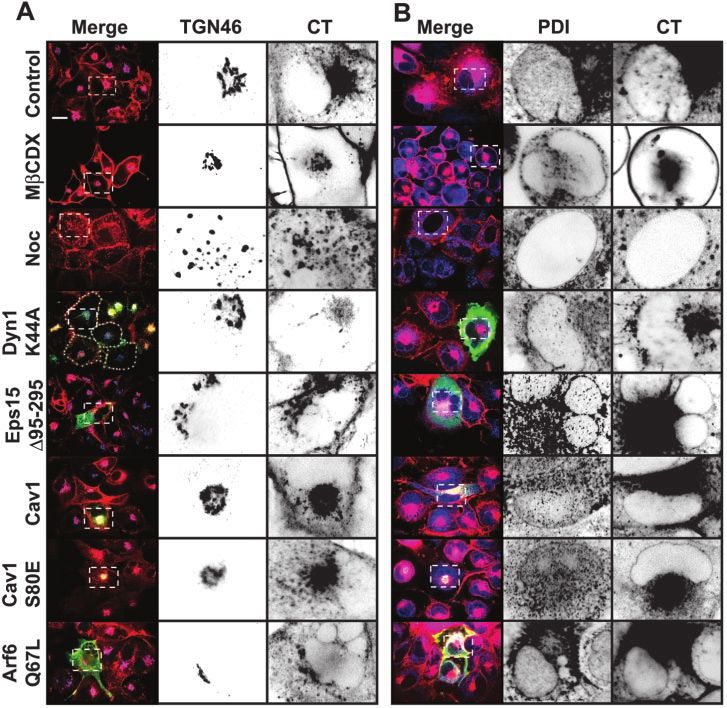
3634 Molecular Biology of the CellCholera Toxin Endocytosis and Toxicity Figure 3. Clathrin and caveolin-de- pendent pathways mediate CT inter- nalization. (A) BSC1 cells stably ex- pressing EYFP-LCA cells were incubated with 20 nM CT(E112D) for 30 min at 37°C, washed, and processed for time-lapse recording. A clathrin-coated pit-like structure, selected from the dor- sal cell surface (image 1, stippled-line box, and enlarged in images 2 and 3), containing CT was analyzed with the aid of a kymograph plot for clathrin and toxin content over time (images 4 – 6). (B) CT(E112D) was added during the time-lapse acquisition to BSC1 cells transiently expressing Cav1-EGFP. The time-lapse series (stippled-line box) shows entry of CT into a caveolin 1-containing tubulo-vesicular structure (Movie 7, a and b). The initial short tubular invagination stretches and eventually disconnects from the cell surface. Bars, 20 m (whole cell) and 5 and 3 m (cropped regions). reflecting differences in cell type (Shigematsu et al., 2002). which now contained Tf (Figure 4B), caveolin1-EGFP, Arf6, Moreover, overexpression of the Arf6 mutants Arf6Q67L or EHD1, and MHC-I (Fig. s2 in Supplement). To inhibit all Arf6T27N, mutants known to prevent the GTP/GDP cycle these endocytic pathways, we expressed DynK44A together of this small GTPase (Radhakrishna and Donaldson, 1997) either with Arf6Q67L or Arf6T27N. This caused an essen- failed to block CT entry (Figure 4A). Similar effects were tially complete block of detectable CT internalization in found using Y-1 adrenal cells instead (Fig. s8 in Supple- BSC1 and Y-1 cells corresponding to a decrease of at least ment). Thus, inhibition of single pathways did not impor- 100-fold in CT uptake (Figure 4C and s8 in Supplement). tantly affect CT internalization. These results indicate that all three of the pathways inves- It is possible that CT simultaneously enters through two tigated here are able to carry CT to the cell interior, and only or all of these pathways. To test this hypothesis, we inter- when all of them are blocked does CT entry, either into fered with two or three of these entry routes at once. We endosomes or into the Golgi and ER become undetectable. used two distinct methods to simultaneously inhibit the Cholesterol depletion slightly reduced the access of CT to clathrin and caveolin pathways: cholesterol depletion (Hail- the TGN (⬃⬍2-fold) and the ER (⬎4-fold) (Figure 5) and had stones et al., 1998; Rodal et al., 1999; Parpal et al., 2001) and a more pronounced effect on its access to the Golgi complex overexpression of DynK44A, a mutant defective in GTP (⬃12-fold) (Fig. s3 in Supplement), consistent with previous loading and hydrolysis (Herskovits et al., 1993; Vallee et al., observations (Shogomori and Futerman, 2001; Fujinaga et al., 1993; van der Bliek et al., 1993). We found that depletion of 2003; Le and Nabi, 2003). In contrast, only the combined inhi- cholesterol by incubation with methyl- cyclodextrin did bition of the clathrin, caveolin, and Arf6 pathways blocked the reduce CT entry (Figure 4B), consistent with previous results transport of CT to the Golgi and the ER (Figure 4C). (Orlandi and Fishman, 1998; Wolf et al., 2002; Le and Nabi, Because CT can only access the cytosol from the ER, we 2003). The effect of DynK44A overexpression was signifi- used a functional assay (Maneval et al., 1981; Maenhaut and cantly less pronounced (Figure 4B); CT was still able to Libert, 1990; Nambiar et al., 1993) that indirectly measures access the perinuclear region, and more CT tubules oc- cAMP levels to verify whether blockade of these three en- curred, apparently emanating from the plasma membrane, docytic pathways also reduces CT-elicited toxicity. To do Vol. 15, August 2004 3635
R.H. Massol et al.
this on a single-cell basis, we measured the shape response
of Y-1 cells to CT by observing their characteristic cell re-
traction and appearance of long plasma membrane projec-
tions caused by increased intracellular cAMP levels (Figure
6A and Movies 4, a and b, in Supplement). This assay was
successfully used to study the trafficking of CT and the effect
of different mutations in CT enzymatic activity (Kowal and
Srinivasan, 1975; Donta et al., 1976; Donta et al., 1982; Nam-
biar et al., 1993; Dalsgaard et al., 1995; Fontana et al., 1995;
Wolf et al., 1998; Jobling and Holmes, 2001; Morinaga et al.,
2001) and of its closely related toxin heat-labile LT-II from
Escherichia coli (Sack and Sack, 1975; Donta et al., 1982; Guth
et al., 1986; Chapman and Daly, 1989; Tauschek et al., 2002).
Toxin-induced shape changes in this assay depend strictly
on toxin trafficking from the plasma membrane to ER where
the CT A1-chain retrotranslocates to the cytosol, because
neither incubation with 20 nM CT B-subunit alone (Fig. s5B
in Supplement) nor incubation with an enzymatically inac-
tive CT mutant (CTE112D) had any toxic effect (Fig. s8 in
Supplement). Incubation with forskolin, a direct activator of
adenylyl cyclase, used as a positive control in this assay
(Donta and Viner, 1975; Donta et al., 1976; Maneval et al.,
1981; Ulaner et al., 1999) showed the expected dose-response
relationship (Fig. s5A in Supplement). Further confirmation
that the change in shape assay reflects increases in intracel-
lular levels of cAMP was obtained by showing a similar
response upon incubation of Y-1 cells with the cell-perme-
able cAMP analogue 8-Br-cAMP (Figure 6B). Overexpres-
sion of mutant proteins that block different endocytic routes
does not change the normal morphology of the cells (Fig. s4
in Supplement) or their sensitivity to respond to increases in
cAMP mediated by increasing amounts of forskolin (Fig. s4
and Fig. s5A in Supplement). This assay shows a dose-
response relationship between increasing amounts of CT-
and cAMP-induced shape cell changes (Figure 6C). The EC50
for CT-induced cell shape change in nontransfected cells is
⬃32 pM. As shown previously (Stearns et al., 1990; Balch et
al., 1992; Donta et al., 1993; Lencer et al., 1993; Nambiar et al.,
1993), extensive disruption of the Golgi complex by treat-
effects on CT entry. Representative images of BSC1 cells transiently
expressing EGFP-Eps15⌬95-295, Cav1S80E-myc, Arf6Q67L-HA,
Arf6T27N-HA for 24 – 48 h or treated with 100 nM PMA for 30 min
(treatment known to disrupt caveolae) are shown. The block in Tf
uptake assessed the inhibition of clathrin-mediated endocytosis;
inhibition of caveolin-mediated uptake resulted in a 25% reduction
in simian virus 40 infectivity (our unpublished data); and interfer-
ence with the Arf6-dependent pathway by overexpression of
Arf6Q67L resulted in the expected vacuolization of the endosomal
compartment (Naslavsky et al., 2003). (B) Combined inhibition of
clathrin- and caveolin-dependent pathways partially inhibits CT
entry. Representative images of BSC1 cells treated with 10 mM
methyl--cyclodextrin for 30 min or overexpressing Dyn1K44A-HA
for 48 h are shown. Under both conditions, Tf uptake was strongly
inhibited. Although the retention of CT at the cell surface increased
upon cholesterol depletion, and in less degree by interference with
dynamin-dependent pathways, its internalization was partially pre-
vented. The number of tubules containing CT increased upon ex-
pression of dynamin 1 or 2 K44A mutants, which now contain Tf,
Cav1-EGFP, Arf6, EGFP-EHD1, and EGFP-MHC-I (arrowheads and
Fig. s2 in Supplement). (C) Coexpression of Dyn2K44A and
Arf6Q67L or Arf6T27N strongly prevents CT entry and abolished
tubule formation. (A–C) Representative confocal images from mid-
dle sections of cells (n ⫽ 40 – 60) displayed using an inverted mono-
chrome scale to aid visualization. Transfected cells were identified
by imaging EGFP or by staining for the myc or HA epitopes fused
Figure 4. Combined inhibition of the clathrin-, caveolin-, and to the corresponding overexpressed proteins. In coexpression of
Arf6-dependent pathways strongly inhibits CT entry. (A) Inhibition Arf6-HA mutants with DynK44A, we used Dyn2K44A-EGFP. Bars,
of clathrin-, caveolin-, or Arf6-dependent pathways has minimal 20 m.
3636 Molecular Biology of the CellCholera Toxin Endocytosis and Toxicity
Figure 5. Decrease of cholesterol or
interference with dynamin function
inhibits CT transport to the TGN and
the ER. Transport of CT to the TGN
(A) and ER (B) in cells subjected to
different conditions that perturb endo-
cytosis was assessed by colocalization
of the toxin with TGN46 or PDI, re-
spectively. BSC1 cells either express-
ing the indicated dominant proteins
for 24 – 48 h or treated with nocoda-
zole or methyl--cyclodextrin for 30
min were incubated with CT(E112D)
for 45 min (A) or 90 min (B) at 37°C.
Transfected cells were identified as
described in Figure 4. For each condi-
tion, representative confocal images
are shown (out of at least 50 cells an-
alyzed). Selected regions (stippled-
line boxes) of the TGN and ER nuclear
envelope were cropped, enlarged, and
displayed using an inverted mono-
chrome color scale to facilitate inspec-
tion of colocalization. Expression of
Dyn1K44A or depletion of cholesterol
(by treatment with 10 mM methyl--
cyclodextrin) significantly reduced CT
transport to the TGN and ER, whereas
inhibition of single endocytic path-
ways had no effect. In contrast, micro-
tubule depolymerization (by treat-
ment with 10 M nocodazole) only
inhibited retrograde transport the ER.
Bars, 20 m.
ment with BFA abolished the morphological changes in- not affected, however, as determined by the single-cell
duced by CT (Figure 6A) and also in cells overexpressing change-in-shape assay.
Dyn2K44A together with Arf6Q67L (Figure 6D). We con- Our results are consistent with earlier studies (Parton,
clude that the changes in cell shape are a very sensitive 1994; Sofer and Futerman, 1995; Torgersen et al., 2001; Singh
readout to indirectly determine increased levels of cAMP. et al., 2003) showing that CT enters host cells via multiple
We then used this functional assay to study the effect of routes level but point to different conclusions. In these ex-
preventing CT endocytosis in CT-induced toxicity. Unex- periments, perturbations of only one or more endocytic
pectedly, coexpression of Dyn2K44A together with pathway led to a limited reduction in endocytosis and a
Arf6Q67L or Arf6T27N, conditions that reduced the uptake partial inhibition of CT-induced cAMP production, raising
of fluorescent CT to the endosomes/Golgi/ER below the the possibility that the methods used to inhibit endocytosis
detection limit of the fluorescent assay (at least a 100-fold caused only an incomplete block in toxin uptake by all cells
reduction in toxin transport; see Figure 4C), showed little or in the assay (upon pharmacological treatment) or complete
no effect on the rounding of cells treated with 200 pM CT interference but in only a fraction of cells in the population
(EC95; Figure 6D and Table 1). Moreover, the dose-response tested (by overexpression of mutant proteins). Here, using a
curves and EC50 values of the cells coexpressing or not the single-cell assay, we find that CT can enter host cells via
Dynamin and Arf6 mutants were almost indistinguishable multiple routes, some not yet defined at the molecular level.
(Figure 6C). Thus, normal toxicity is still elicited, even Thus, it is possible that even a complete block of a single
though the concurrent block of the clathrin-, caveolin-, and endocytic pathway would never be able to inhibit toxicity
Arf6-dependent pathways strongly inhibits CT entry and entirely. Nevertheless, it remains plausible that a particular
transport to the Golgi and ER determined by visualization of cell type might use one pathway in preference to others
fluorescent CT. (Singh et al., 2003).
The toxicity assay is highly sensitive to CT (EC50 of 32 pM)
DISCUSSION and has a dynamic range of at least 20-fold in toxin concen-
tration (between 10 and 200 pM). Thus, the assay should
In this study, we find that CT enters cells through the readily detect a reduction in the amount of CT reaching the
clathrin-, caveolin-, and Arf6-dependent endocytic path- ER as caused by the near complete inhibition of CT transport
ways and that the simultaneous block of all three pathways to the Golgi in cells lacking all three, clathrin-, caveolin-, and
strongly inhibits the internalization of CT and its access to Arf6-dependent mechanisms, of endocytosis. If CT endocy-
the Golgi and ER, as assessed by visual inspection of fluo- tosis would only occur through these three routes, then a
rescent CT. The increase in cAMP levels due to CT entry was partial inhibition of 99% in the amount of CT reaching the
Vol. 15, August 2004 3637R.H. Massol et al. Figure 6. CT toxicity does not require active dynamin- and Arf6-dependent endocytic pathways. (A) Assay for toxicity. Incubation of Y-1 mouse adrenal cells with CT (300 pM) or the adenylyl cyclase-agonist forskolin (10 M) induces a cAMP-dependent cell shape change characterized by cell retraction, rounding, and the extension of long projections. Pretreatment with BFA (1 M) completely inhibits the CT response. Representative phase contrast images were acquired with a 20⫻ lens. B) The shape-change assay used to measure CT-induced toxicity reflects intracellular cAMP levels. On incubation of Y-1 cells with increasing concentrations of the cAMP-permeable analogue 8-Br-cAMP, there is a proportional increase in the number of rounded cells, with an EC50 value of ⬃70 M and a linear range between 30 and 140 M. At least 500 cells were analyzed per condition. (C) Dose-response curves of CT-induced cell shape change. The EC50 for control cells (32 pM, full circles in plot), for cells expressing Dyn2K44A alone (39 pM; our unpublished data) or together with Arf6Q67L (40 pM, empty diamonds in plot) are very similar. At least 350 cells were analyzed per condition. (D) Simultaneous inhibition of the clathrin-, caveolin-, and Arf6-mediated endocytic pathways does not affect CT-induced cell shape change. DynK44A and Arf6 dominant mutants (similar results were obtained with Arf6T27N; our unpublished data) were expressed in Y-1 cells and toxin function assessed by measurement of cell shape change. Representative fluorescence (displayed in inverted monochrome scale) and phase contrast images of cells incubated with medium only, forskolin, BFA in combination with forskolin or CT, and wild-type CT are shown. Expression of these proteins did not alter the normal morphology of Y-1 cells (Fig. s4 in Supplement), or their ability to change upon increased cAMP (Fig. s4 and s5 in Supplement), where cells were incubated with medium with or without forskolin. Cells also were incubated with Tf to verify the block in the clathrin pathway (our unpublished data). Cells were stained with antibodies specific for HA epitope tags to identify Arf6 expression. Bar, 20 m. Golgi/ER (corresponding to our observations) should result In favoring this interpretation, it is important to note that the in a 2-log increase of the EC50 as determined by the dose- concentration of CT(E112D) (20 nM) used for the direct fluo- response curve (Figure 7). In contrast, our data show that the rescence-based traffic assay was ⬎100-fold higher than the strong inhibition of all three endocytic pathways has no concentration of wild-type CT (10 –200pM) used in the much detectable effect on the toxic response. From these results, more sensitive functional assay. At these lower concentrations, we conclude that CT also can enter cells and reach the Golgi the amount of toxin internalized was below detectable limits as and ER through a route that is independent of the clathrin, assessed by direct inspection of fluorescent CT. We also exam- caveolin, Arf6 pathways (see model in Figure 7). ined toxin uptake by indirect immunofluorescence, increasing 3638 Molecular Biology of the Cell
Cholera Toxin Endocytosis and Toxicity

                                                                          the sensitivity of the morphologic assay by 3- to 10-fold. Using
Table 1. CT-induced change in morphology                                  this approach, we found no detectable toxin in the ER of cells
                                                                          expressing the dominant negative DynK44A together with
Condition                     % Affected cells (n ⫽ 150–250, ⫾5%)
                                                                          Arf6Q67L or Arf6T27N (our unpublished data). Thus, even
Single Interference                                                       though the clathrin-, caveolin-, and Arf6-dependent pathways
  Eps15⌬95-295                                 98.5                       are the main routes for CT entry, they seem not to be the only
  Cav1S80E                                     97.1                       ones involved in CT transport to the ER. We postulate that
  Arf6Q67L                                     98.4                       there is an unidentified endocytic pathway that remains
  Arf6T27N                                     93.9                       active in cells expressing DynK44A together with
Multiple Interferences
  Arf6Q67L/Cav1S80E                            88                         Arf6Q67L or Arf6T27N. This would explain why the toxin
  Eps15⌬95-295/Arf6Q67L                        96                         remains fully active in cells where the three known mech-
  Dyn1K44A                                     85                         anisms of endocytosis are blocked. An alternative explana-
  Eps15⌬95-295/Cav1S80E                        96.4                       tion for the mechanism of toxin access to the ER might be
  Arf6Q67L/Dyn2K44A                            76.8                       based on the direct fusion of the plasma membrane with
                                                                          the ER, a process recently described in phagocytic cells
In each case, the concentration of CT used (of EC95 200 pM) was
such that even partial inhibition of endocytic entry should result in
                                                                          that occurs during early stages of phagocytosis (Gagnon et
a detectable effect on toxicity. In addition, overexpression of two       al., 2002). Whether this fusion occurs constitutively in all
other dominant negative mutants of caveolin or preincubation with         cells, or whether it is sensitive to BFA, however, remains
genistein did not protect Y-1 cells against CT-induced cell shape         to be determined. Overall, our data are consistent with the
changes (Fig. 6A and B). Representative fluorescence (displayed in        existence of another entry pathway relevant for CT activ-
inverted monochrome scale) and phase contrast images of these             ity that is independent of clathrin-, dynamin-, and Arf6-
conditions are shown in Fig. 7 (Supplement).                              mediated mechanisms.

Figure 7. Models for delivery routes of CT to the ER. (A) Schematic representation assuming only three routes for CT entry, dependent on
clathrin, caveolin, and Arf6 pathways. After arrival of CT to the endosomal compartment, the toxin transverses the Golgi complex and finally
arrives to the ER where the CT A1 peptide is retrotranslocated into the cytosol to increase cAMP levels. Inhibition of these three entry routes
by coexpression of DynK44A and Arf6 mutants (brackets) reduces CT entry by at least 100-fold. The expected result is a drastic shift in the
dose-response relationship of CT toxicity of at least 100-fold. (B) Schematic representation assuming additional routes for CT entry, besides
those dependent on the clathrin, caveolin, and Arf6 pathways. In this model, the drastic inhibition in CT entry due to the coexpression of
DynK44A and Arf6 mutants does not affect the yet to be determined trafficking pathway(s) used by CT to reach the ER. Under these
conditions, transport of CT to the ER is maintained thus resulting in a similar dose-response curve of toxicity.

Vol. 15, August 2004                                                                                                                      3639
R.H. Massol et al.
ACKNOWLEDGMENTS Fontana, M.R., Manetti, R., Giannelli, V., Magagnoli, C., Marchini, A., Olivieri,
R., Domenighini, M., Rappuoli, R., and Pizza, M. (1995). Construction of
We thank Drs. Julie G. Donaldson, Michel Franco, Jeffrey Pessin, Mia Horow- nontoxic derivatives of cholera toxin and characterization of the immunolog-
itz, Jennifer Lippincott-Schwartz, Hidde Ploegh, and Domenico Tortorella for ical response against the A subunit. Infect Immun. 63, 2356 –2360.
generously providing DNA constructs and antibodies. We also thank April
Griffin for help preparing caveolin mutants; Thomas Nieland and Drs. May Fujinaga, Y., Wolf, A.A., Rodighiero, C., Wheeler, H., Tsai, B., Allen, L.,
Ma, Anan Wu, and Marcelo Ehrlich for helpful discussions; and Dr. Rebecca Jobling, M.G., Rapoport, T., Holmes, R.K., and Lencer, W.I. (2003). Ganglio-
Ward for editorial assistance. This study was supported in part by DK48106 sides that associate with lipid rafts mediate transport of cholera and related
(to Y.F.) and 1U54AI057159-01(to T.K.). toxins from the plasma membrane to ER. Mol. Biol. Cell 14, 4783– 4793.
Gagnon, E., Duclos, S., Rondeau, C., Chevet, E., Cameron, P.H., Steele-
REFERENCES Mortimer, O., Paiement, J., Bergeron, J.J., and Desjardins, M. (2002). Endo-
plasmic reticulum-mediated phagocytosis is a mechanism of entry into mac-
Anderson, H.A., Chen, Y., and Norkin, L.C. (1996). Bound simian virus 40 rophages. Cell 110, 119 –131.
translocates to caveolin-enriched membrane domains, and its entry is inhib-
ited by drugs that selectively disrupt caveolae. Mol. Biol. Cell 7, 1825–1834. Guerrant, R.L., Brunton, L.L., Schnaitman, T.C., Rebhun, L.I., and Gilman,
A.G. (1974). Cyclic adenosine monophosphate and alteration of Chinese ham-
Arnaoutova, I., Jackson, C.L., Al-Awar, O.S., Donaldson, J.G., and Loh, Y.P. ster ovary cell morphology: a rapid, sensitive in vitro assay for the entero-
(2003). Recycling of Raft-associated prohormone sorting receptor carboxypep- toxins of Vibrio cholerae and Escherichia coli. Infect. Immun. 10, 320 –327.
tidase E requires interaction with ARF6. Mol. Biol. Cell 14, 4448 – 4457.
Guth, B.E., Twiddy, E.M., Trabulsi, L.R., and Holmes, R.K. (1986). Variation in
Badizadegan, K., Wolf, A.A., Rodighiero, C., Jobling, M., Hirst, T.R., Holmes, chemical properties and antigenic determinants among type II heat-labile
R.K., and Lencer, W.I. (2000). Floating cholera toxin into epithelial cells: enterotoxins of Escherichia coli. Infect. Immun. 54, 529 –536.
functional association with caveolae-like detergent-insoluble membrane mi-
crodomains. Int. J. Med. Microbiol. 290, 403– 408. Hagmann, J., and Fishman, P.H. (1982). Detergent extraction of cholera toxin
and gangliosides from cultured cells and isolated membranes. Biochim. Bio-
Balch, W.E., Kahn, R.A., and Schwaninger, R. (1992). ADP-ribosylation factor
phys. Acta 720, 181–187.
is required for vesicular trafficking between the endoplasmic reticulum and
the cis-Golgi compartment. J. Biol. Chem. 267, 13053–13061. Hailstones, D., Sleer, L.S., Parton, R.G., and Stanley, K.K. (1998). Regulation of
Barbieri, J.T., Riese, M.J., and Aktories, K. (2002). Bacterial toxins that modify caveolin and caveolae by cholesterol in MDCK cells. J. Lipid Res. 39, 369 –379.
the actin cytoskeleton. Annu. Rev. Cell Dev. Biol. 18, 315–344. Herskovits, J.S., Burgess, C.C., Obar, R.A., and Vallee, R.B. (1993). Effects of
Benmerah, A., Bayrou, M., Cerf-Bensussan, N., and Dautry-Varsat, A. (1999). mutant rat dynamin on endocytosis. J. Cell Biol. 122, 565–578.
Inhibition of clathrin-coated pit assembly by an Eps15 mutant. J. Cell Sci. 112, Jobling, M.G., and Holmes, R.K. (2001). Biological and biochemical character-
1303–1311. ization of variant A subunits of cholera toxin constructed by site-directed
Benmerah, A., Lamaze, C., Begue, B., Schmid, S.L., Dautry-Varsat, A., and mutagenesis. J. Bacteriol. 183, 4024 – 4032.
Cerf-Bensussan, N. (1998). AP-2/Eps15 interaction is required for receptor- Joseph, K.C., Kim, S.U., Stieber, A., and Gonatas, N.K. (1978). Endocytosis of
mediated endocytosis. J. Cell Biol. 140, 1055–1062. cholera toxin into neuronal GERL. Proc. Natl. Acad. Sci. USA 75, 2815–2819.
Blagoveshchenskaya, A.D., Thomas, L., Feliciangeli, S.F., Hung, C.H., and
Joseph, K.C., Stieber, A., and Gonatas, N.K. (1979). Endocytosis of cholera
Thomas, G. (2002). HIV-1 Nef downregulates MHC-I by a PACS-1- and
toxin in GERL-like structures of murine neuroblastoma cells pretreated with
PI3K-regulated ARF6 endocytic pathway. Cell 111, 853– 866.
GM1 ganglioside. Cholera toxin internalization into Neuroblastoma GERL. J.
Brown, F.D., Rozelle, A.L., Yin, H.L., Balla, T., and Donaldson, J.G. (2001). Cell Biol. 81, 543–554.
Phosphatidylinositol 4,5-bisphosphate and Arf6-regulated membrane traffic.
Kahn, R.A., and Gilman, A.G. (1984). ADP-ribosylation of Gs promotes the
J. Cell Biol. 154, 1007–1017.
dissociation of its alpha and beta subunits. J. Biol. Chem. 259, 6235– 6240.
Caplan, S., Naslavsky, N., Hartnell, L.M., Lodge, R., Polishchuk, R.S., Donaldson,
J.G., and Bonifacino, J.S. (2002). A tubular EHD1-containing compartment in- Kassis, S., and Fishman, P.H. (1982). Different mechanisms of desensitization
volved in the recycling of major histocompatibility complex class I molecules to of adenylate cyclase by isoproterenol and prostaglandin E1 in human fibro-
the plasma membrane. EMBO J. 21, 2557–2567. blasts. Role of regulatory components in desensitization. J. Biol. Chem. 257,
5312–5318.
Chapman, P.A., and Daly, C.M. (1989). Comparison of Y1 mouse adrenal cell
and coagglutination assays for detection of Escherichia coli heat labile entero- Kassis, S., Hagmann, J., Fishman, P.H., Chang, P.P., and Moss, J. (1982).
toxin. J. Clin. Pathol. 42, 755–758. Mechanism of action of cholera toxin on intact cells. Generation of A1 peptide
and activation of adenylate cyclase. J. Biol. Chem. 257, 12148 –12152.
Dalsgaard, A., Albert, M.J., Taylor, D.N., Shimada, T., Meza, R., Serichantalergs,
O., and Echeverria, P. (1995). Characterization of Vibrio cholerae non-O1 sero- Kirchhausen, T., Scarmato, P., Harrison, S.C., Monroe, J.J., Chow, E.P.,
groups obtained from an outbreak of diarrhea in Lima, Peru. J. Clin. Microbiol. Mattaliano, R.J., Ramachandran, K.L., Smart, J.E., Ahn, A.H., and Brosius, J.
33, 2715–2722. (1987). Clathrin light chains LCA and LCB are similar, polymorphic, and
share repeated heptad motifs. Science 236, 320 –324.
Diviani, D., and Scott, J.D. (2001). AKAP signaling complexes at the cytoskel-
eton. J. Cell Sci. 114, 1431–1437. Kowal, J., and Fiedler, R.P. (1969). Adrenal cells in tissue culture. II. Steroidogenic
responses to nucleosides and nucleotides. Endocrinology 84, 1113–1117.
Dong, J.M., Leung, T., Manser, E., and Lim, L. (1998). cAMP-induced mor-
phological changes are counteracted by the activated RhoA small GTPase and Kowal, J., and Srinivasan, S. (1975). Adrenal cells in tissue culture the effects
the Rho kinase ROKalpha. J. Biol. Chem. 273, 22554 –22562. of choleragen and ACTH on steroid and cyclic-AMP metabolism. Endocr. Res.
Commun. 2, 65– 86.
Donta, S.T., Beristain, S., and Tomicic, T.K. (1993). Inhibition of heat-labile
cholera and Escherichia coli enterotoxins by brefeldin A. Infect. Immun. 61, Larsen, J.E., Massol, R.H., Nieland, T.J., and Kirchhausen, T. (2004). HIV
3282–3286. Nef-mediated major histocompatibility complex class I down-modulation is
Donta, S.T., Kreiter, S.R., and Wendelschafer-Crabb, G. (1976). Morphological independent of Arf6 activity. Mol. Biol. Cell 15, 323–331.
and steroidogenic changes in cultured adrenal tumor cells induced by a Le, P.U., and Nabi, I.R. (2003). Distinct caveolae-mediated endocytic path-
subunit of cholera enterotoxin. Infect. Immun. 13, 1479 –1482. ways target the Golgi apparatus and the endoplasmic reticulum. J. Cell Sci.
Donta, S.T., Poindexter, N.J., and Ginsberg, B.H. (1982). Comparison of the 116, 1059 –1071.
binding of cholera and Escherichia coli enterotoxins to Y1 adrenal cells. Bio- Lencer, W.I., Constable, C., Moe, S., Jobling, M.G., Webb, H.M., Ruston, S.,
chemistry 21, 660 – 664. Madara, J.L., Hirst, T.R., and Holmes, R.K. (1995). Targeting of cholera toxin
Donta, S.T., and Viner, J.P. (1975). Inhibition of the steroidogenic effects of cholera and Escherichia coli heat labile toxin in polarized epithelia: role of COOH-
and heat-labile Escherichia coli enterotoxins by GM1 ganglioside: evidence for a terminal KDEL. J. Cell Biol. 131, 951–962.
similar receptor site for the two toxins. Infect. Immun. 11, 982–985. Lencer, W.I., de Almeida, J.B., Moe, S., Stow, J.L., Ausiello, D.A., and Madara,
Falguieres, T., Mallard, F., Baron, C., Hanau, D., Lingwood, C., Goud, B., J.L. (1993). Entry of cholera toxin into polarized human intestinal epithelial
Salamero, J., and Johannes, L. (2001). Targeting of Shiga toxin B-subunit to cells. Identification of an early brefeldin A sensitive event required for A1-
retrograde transport route in association with detergent-resistant membranes. peptide generation. J. Clin. Investig. 92, 2941–2951.
Mol. Biol. Cell 12, 2453–2468.
Luetterforst, R., Stang, E., Zorzi, N., Carozzi, A., Way, M., and Parton, R.G.
Fishman, P.H., and Atikkan, E.E. (1980). Mechanism of action of cholera toxin: (1999). Molecular characterization of caveolin association with the Golgi
effect of receptor density and multivalent binding on activation of adenylate complex: identification of a cis-Golgi targeting domain in the caveolin mole-
cyclase. J. Membr. Biol. 54, 51– 60. cule. J. Cell Biol. 145, 1443–1459.
3640 Molecular Biology of the CellCholera Toxin Endocytosis and Toxicity
Maenhaut, C., and Libert, F. (1990). An efficient screening morphological test Schafer, D.E., Lust, W.D., Sircar, B., and Goldberg, N.D. (1970). Elevated
for the identification and characterization of cyclic AMP-coupled hormone concentration of adenosine 3⬘:5⬘-cyclic monophosphate in intestinal mucosa
receptors. Exp. Cell Res. 187, 104 –110. after treatment with cholera toxin. Proc. Natl. Acad. Sci USA 67, 851– 856.
Majoul, I., Sohn, K., Wieland, F.T., Pepperkok, R., Pizza, M., Hillemann, J., Schmitz, A., Herrgen, H., Winkeler, A., and Herzog, V. (2000). Cholera toxin is
and Soling, H.D. (1998). KDEL receptor (Erd2p)-mediated retrograde trans- exported from microsomes by the Sec61p complex. J. Cell Biol. 148, 1203–1212.
port of the cholera toxin A subunit from the Golgi involves COPI, p23, and the Scott, J.D. (2003). A-kinase-anchoring proteins and cytoskeletal signalling
COOH terminus of Erd2p. J. Cell Biol. 143, 601– 612. events. Biochem. Soc. Trans. 31, 87– 89.
Majoul, I.V., Bastiaens, P.I., and Soling, H.D. (1996). Transport of an external Seamon, K.B., and Daly, J.W. (1981). Forskolin: a unique diterpene activator of
Lys-Asp-Glu-Leu (KDEL) protein from the plasma membrane to the endoplas- cyclic AMP-generating systems. J. Cyclic Nucleotide Res. 7, 201–224.
mic reticulum: studies with cholera toxin in Vero cells. J. Cell Biol. 133, 777–789.
Seamon, K.B., Padgett, W., and Daly, J.W. (1981). Forskolin: unique diterpene
Maneval, D.R., Colwell, R.R., Grays, S.W.J., and Donta, S.T. (1981). A tissue activator of adenylate cyclase in membranes and in intact cells. Proc. Natl.
culture method for the detection of bacterial enterotoxins. J. Tissue Cult. Acad. Sci. USA 78, 3363–3367.
Methods 6, 85–90.
Shigematsu, S., Watson, R.T., Khan, A.H., and Pessin, J.E. (2002). The adipo-
Mobius, W., Herzog, V., Sandhoff, K., and Schwarzmann, G. (1999). Intracellular cyte plasma membrane caveolin functional/structural organization is neces-
distribution of a biotin-labeled ganglioside, GM1, by immunoelectron micros- sary for the efficient endocytosis of GLUT4. J. Biol. Chem. 278, 10683–10690.
copy after endocytosis in fibroblasts. J. Histochem. Cytochem. 47, 1005–1014.
Shogomori, H., and Futerman, A.H. (2001). Cholera toxin is found in detergent-
Montecucco, C. (1998). Protein toxins and membrane transport. Curr. Opin. insoluble rafts/domains at the cell surface of hippocampal neurons but is inter-
Cell Biol. 10, 530 –536. nalized via a raft-independent mechanism. J. Biol. Chem. 276, 9182–9188.
Montesano, R., Roth, J., Robert, A., and Orci, L. (1982). Non-coated membrane Singh, R.D., Puri, V., Valiyaveettil, J.T., Marks, D.L., Bittman, R., and Pagano,
invaginations are involved in binding and internalization of cholera and R.E. (2003). Selective caveolin-1-dependent endocytosis of glycosphingolip-
tetanus toxins. Nature 296, 651– 653. ids. Mol. Biol. Cell 14, 3254 –3265.
Morinaga, N., Kaihou, Y., Vitale, N., Moss, J., and Noda, M. (2001). Involve- Smart, E.J., Foster, D.C., Ying, Y.S., Kamen, B.A., and Anderson, R.G. (1994).
ment of ADP-ribosylation factor 1 in cholera toxin-induced morphological Protein kinase C activators inhibit receptor-mediated potocytosis by prevent-
changes of Chinese hamster ovary cells. J. Biol. Chem. 276, 22838 –22843. ing internalization of caveolae. J. Cell Biol. 124, 307–313.
Moss, J., and Vaughan, M. (1988). ADP-ribosylation of guanyl nucleotide- Sofer, A., and Futerman, A.H. (1995). Cationic amphiphilic drugs inhibit the
binding regulatory proteins by bacterial toxins. Adv. Enzymol. Relat. Areas internalization of cholera toxin to the Golgi apparatus and the subsequent
Mol. Biol. 61, 303–379. elevation of cyclic AMP. J. Biol. Chem. 270, 12117–12122.
Nambiar, M.P., Oda, T., Chen, C., Kuwazuru, Y., and Wu, H.C. (1993). Spangler, B.D. (1992). Structure and function of cholera toxin and the related
Involvement of the Golgi region in the intracellular trafficking of cholera Escherichia coli heat-labile enterotoxin. Microbiol. Rev. 56, 622– 647.
toxin. J. Cell Physiol. 154, 222–228. Stearns, T., Willingham, M.C., Botstein, D., and Kahn, R.A. (1990). ADP-
Naslavsky, N., Weigert, R., and Donaldson, J.G. (2003). Convergence of non- ribosylation factor is functionally and physically associated with the Golgi
clathrin- and clathrin-derived endosomes involves Arf6 inactivation and complex. Proc. Natl. Acad. Sci. USA 87, 1238 –1242.
changes in phosphoinositides. Mol. Biol. Cell 14, 417– 431. Tauschek, M., Gorrell, R.J., Strugnell, R.A., and Robins-Browne, R.M. (2002).
Identification of a protein secretory pathway for the secretion of heat-labile
Nichols, B.J. (2002). A distinct class of endosome mediates clathrin-indepen-
enterotoxin by an enterotoxigenic strain of Escherichia coli. Proc. Natl. Acad.
dent endocytosis to the Golgi complex. Nat. Cell Biol. 4, 374 –378.
Sci. USA 99, 7066 –7071.
Nichols, B.J., Kenworthy, A.K., Polishchuk, R.S., Lodge, R., Roberts, T.H., Torgersen, M.L., Skretting, G., van Deurs, B., and Sandvig, K. (2001). Inter-
Hirschberg, K., Phair, R.D., and Lippincott-Schwartz, J. (2001). Rapid cycling nalization of cholera toxin by different endocytic mechanisms. J. Cell Sci. 114,
of lipid raft markers between the cell surface and Golgi complex. J. Cell Biol. 3737–3747.
153, 529 –541.
Tran, D., Carpentier, J.L., Sawano, F., Gorden, P., and Orci, L. (1987). Ligands
Orlandi, P.A., Curran, P.K., and Fishman, P.H. (1993). Brefeldin A blocks the internalized through coated or noncoated invaginations follow a common
response of cultured cells to cholera toxin. Implications for intracellular intracellular pathway. Proc. Natl. Acad. Sci. USA 84, 7957–7961.
trafficking in toxin action. J. Biol. Chem. 268, 12010 –12016.
Tsai, B., Gilbert, J.M., Stehle, T., Lencer, W., Benjamin, T.L., and Rapoport,
Orlandi, P.A., and Fishman, P.H. (1998). Filipin-dependent inhibition of chol- T.A. (2003). Gangliosides are receptors for murine polyoma virus and SV40.
era toxin: evidence for toxin internalization and activation through caveolae- EMBO J. 22, 4346 – 4355.
like domains. J. Cell Biol. 141, 905–915.
Tsai, B., Rodighiero, C., Lencer, W.I., and Rapoport, T.A. (2001). Protein
Parpal, S., Karlsson, M., Thorn, H., and Stralfors, P. (2001). Cholesterol de- disulfide isomerase acts as a redox-dependent chaperone to unfold cholera
pletion disrupts caveolae and insulin receptor signaling for metabolic control toxin. Cell 104, 937–948.
via insulin receptor substrate-1, but not for mitogen-activated protein kinase
control. J. Biol. Chem. 276, 9670 –9678. Tsai, B., Ye, Y., and Rapoport, T.A. (2002). Retro-translocation of proteins from
the endoplasmic reticulum into the cytosol. Nat. Rev. Mol. Cell. Biol. 3, 246 –255.
Parton, R.G. (1994). Ultrastructural localization of gangliosides; GM1 is con-
Ulaner, G.A., Chuang, J., Lin, W., Woodbury, D., Myers, R.V., and Moyle,
centrated in caveolae. J. Histochem. Cytochem. 42, 155–166.
W.R. (1999). Desensitization and resensitization of lutropin receptors ex-
Pelkmans, L., Kartenbeck, J., and Helenius, A. (2001). Caveolar endocytosis of pressed in transfected Y-1 adrenal cells. J. Endocrinol. 163, 289 –297.
simian virus 40 reveals a new two-step vesicular-transport pathway to the ER.
Vallee, R.B., Herskovits, J.S., Aghajanian, J.G., Burgess, C.C., and Shpetner,
Nat. Cell Biol. 3, 473– 483.
H.S. (1993). Dynamin, a GTPase involved in the initial stages of endocytosis.
Pelkmans, L., Puntener, D., and Helenius, A. (2002). Local actin polymeriza- Ciba Found. Symp. 176, 185–193; discussion 193–187.
tion and dynamin recruitment in SV40-induced internalization of caveolae. van der Bliek, A.M., Redelmeier, T.E., Damke, H., Tisdale, E.J., Meyerowitz,
Science 296, 535–539. E.M., and Schmid, S.L. (1993). Mutations in human dynamin block an inter-
Radhakrishna, H., and Donaldson, J.G. (1997). ADP-ribosylation factor 6 regu- mediate stage in coated vesicle formation. J. Cell Biol. 122, 553–563.
lates a novel plasma membrane recycling pathway. J. Cell Biol. 139, 49 – 61. Van Dop, C., Tsubokawa, M., Bourne, H.R., and Ramachandran, J. (1984).
Rodal, S.K., Skretting, G., Garred, O., Vilhardt, F., van Deurs, B., and Sandvig, Amino acid sequence of retinal transducin at the site ADP-ribosylated by
K. (1999). Extraction of cholesterol with methyl-beta-cyclodextrin perturbs cholera toxin. J. Biol. Chem. 259, 696 – 698.
formation of clathrin-coated endocytic vesicles. Mol. Biol. Cell 10, 961–974. Wolf, A.A., Fujinaga, Y., and Lencer, W.I. (2002). Uncoupling of the cholera
Sack, D.A., and Sack, R.B. (1975). Test for enterotoxigenic Escherichia coli using toxin-G(M1) ganglioside receptor complex from endocytosis, retrograde
Y-1 adrenal cells in miniculture. Infect. Immun. 11, 334 –336. Golgi trafficking, and downstream signal transduction by depletion of mem-
brane cholesterol. J. Biol. Chem. 277, 16249 –16256.
Sandvig, K., and van Deurs, B. (2002a). Membrane traffic exploited by protein
Wolf, A.A., Jobling, M.G., Wimer-Mackin, S., Ferguson-Maltzman, M.,
toxins. Annu. Rev. Cell Dev. Biol. 18, 1–24.
Madara, J.L., Holmes, R.K., and Lencer, W.I. (1998). Ganglioside structure
Sandvig, K., and van Deurs, B. (2002b). Transport of protein toxins into cells: dictates signal transduction by cholera toxin and association with caveolae-
pathways used by ricin, cholera toxin and Shiga toxin. FEBS Lett. 529, 49 –53. like membrane domains in polarized epithelia. J. Cell Biol. 141, 917–927.
Vol. 15, August 2004 3641You can also read