C Jun N terminal kinase 1 (JNK1) modulates oligodendrocyte progenitor cell architecture, proliferation and myelination - Nature
←
→
Page content transcription
If your browser does not render page correctly, please read the page content below
www.nature.com/scientificreports
OPEN c‑Jun N‑terminal kinase 1 (JNK1)
modulates oligodendrocyte
progenitor cell architecture,
proliferation and myelination
Martina Lorenzati1,2, Enrica Boda1,2, Roberta Parolisi1,2, Martino Bonato2, Tiziana Borsello3,4,
Thomas Herdegen5, Annalisa Buffo1,2* & Alessandro Vercelli1,2*
During Central Nervous System ontogenesis, myelinating oligodendrocytes (OLs) arise from highly
ramified and proliferative precursors called oligodendrocyte progenitor cells (OPCs). OPC architecture,
proliferation and oligodendro-/myelino-genesis are finely regulated by the interplay of cell-intrinsic
and extrinsic factors. A variety of extrinsic cues converge on the extracellular signal-regulated kinase/
mitogen activated protein kinase (ERK/MAPK) pathway. Here we found that the germinal ablation
of the MAPK c-Jun N-Terminal Kinase isoform 1 (JNK1) results in a significant reduction of myelin in
the cerebral cortex and corpus callosum at both postnatal and adult stages. Myelin alterations are
accompanied by higher OPC density and proliferation during the first weeks of life, consistent with a
transient alteration of mechanisms regulating OPC self-renewal and differentiation. JNK1 KO OPCs
also show smaller occupancy territories and a less complex branching architecture in vivo. Notably,
these latter phenotypes are recapitulated in pure cultures of JNK1 KO OPCs and of WT OPCs treated
with the JNK inhibitor D-JNKI-1. Moreover, JNK1 KO and WT D-JNKI-1 treated OLs, while not showing
overt alterations of differentiation in vitro, display a reduced surface compared to controls. Our results
unveil a novel player in the complex regulation of OPC biology, on the one hand showing that JNK1
ablation cell-autonomously determines alterations of OPC proliferation and branching architecture
and, on the other hand, suggesting that JNK1 signaling in OLs participates in myelination in vivo.
During CNS development, myelin is produced by mature oligodendrocytes (OLs), whose cell processes spirally
ensheathe discrete axon segments called internodes1. This arrangement assures a high-speed action potential
conduction along neuronal a xons2 and is instrumental to the achievement of impulse discharge synchrony
among neurons3.
Myelinating OLs originate from parenchymal precursors expressing the neuron-glia antigen 2 (NG2) chon-
droitin sulphate proteoglycan and the platelet derived growth factor receptor alpha (PDGFRα), commonly
referred to as oligodendrocyte progenitor cells (OPCs)4. These cells initially amplify and colonize the entire
CNS and maintain the proliferating ability even during adult life5. Nevertheless, OPC overgrowth is constantly
prevented by OPC-to-OPC repulsion. OPCs have a complex ramified morphology with multiple and dynamic
processes that continuously scan the environment and repel each other through contact-mediated inhibition6, 7.
This assures the achievement of a “grid-like” homogenous cell distribution, where individual OPCs occupy
non-overlapping domains. The progression of OPCs towards myelination is a multistep process that implies
profound molecular changes and remarkable morphological rearrangement8, 9. Both a cell-intrinsic program
and environmental factors participate in the regulation of OPC architecture, proliferation and oligodendro-/
myelino-genesis. Extrinsic signals include contact-mediated and soluble factors provided by neurons and glial
cells, including OPC t hemselves8, 10. In spite of their origin, a variety of these cues converge on the extracellular
signal regulated kinase/mitogen activated protein kinase (ERK/MAPK) pathway in OPCs/OLs11, 12, although the
1
Department of Neuroscience Rita Levi‑Montalcini, University of Turin, Turin, Italy. 2Neuroscience Institute
Cavalieri Ottolenghi (NICO), University of Turin, Orbassano (Turin), Italy. 3Istituto di Ricerche Farmacologiche
Mario Negri-IRCCS, Milan, Italy. 4Department of Pharmacological and Biomolecular Sciences, University of Milan,
Milan, Italy. 5Institute of Experimental and Clinical Pharmacology, University Hospital Schleswig-Holstein, Kiel,
Germany. *email: annalisa.buffo@unito.it; alessandro.vercelli@unito.it
Scientific Reports | (2021) 11:7264 | https://doi.org/10.1038/s41598-021-86673-6 1
Vol.:(0123456789)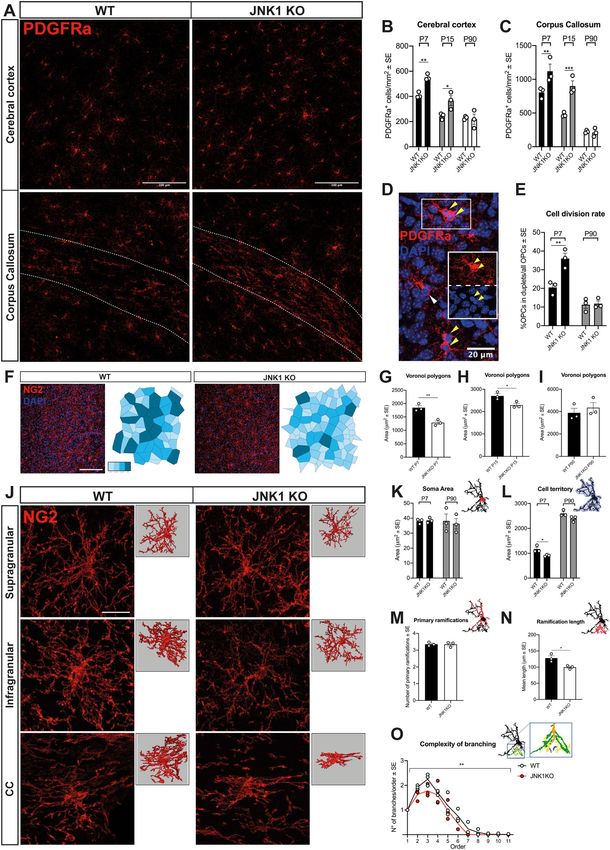
www.nature.com/scientificreports/
identity and the specific role of the signal transduction players active in oligodendroglia at distinct functional
phases remain poorly understood.
Among MAPKs, the c-Jun N-terminal kinases (JNKs) include three isoforms—JNK1, JNK2 and JNK3. While
JNK1 and JNK2 are expressed ubiquitously, JNK3 expression is restricted to a few regions, including the b rain13.
Despite this, in this latter region JNK1 seems to have a predominant role, as JNK1 KO mouse brain shows
developmental abnormalities14, including alterations in neuronal s pecification15, microtubule i ntegrity16, 17, cell
migration18, dendritic and spine a rchitecture19, 20 and developmental a poptosis21. Oligodendroglial cells are
known to express all the three JNK isoforms22. JNK3 has been consistently reported as a regulator of OPC/OL
sensitivity to a poptosis23–25 whereas the roles of JNK1 and JNK2 isoforms26 have not been investigated so far.
Yet, the multifaceted contribution of JNK1 to neuronal development suggests this kinase may also exert multiple
functions in non-neuronal cells, including oligodendroglia.
Here we found that the germinal ablation of JNK1 (JNK1 KO) results in a reduced expression of myelin
proteins in the cerebral cortex and corpus callosum (CC) at both postnatal and adult stages. This occurred in
spite of similar axonal densities in WT and JNK1 KO mouse cortex and CC. In these regions, OPC density and
proliferation rate were higher during the first two weeks of life, consistent with the idea of alterations in mecha-
nisms regulating oligodendroglial proliferation and differentiation. Of note, JNK1 KO OPCs also showed smaller
occupancy territories and a less complex branching architecture in vivo. These phenotypes were all recapitulated
in pure cultures of JNK1 KO OPCs and WT OPCs treated with the JNK-inhibitor D-JNKI-1, indicating a cell-
autonomous role for JNK1 in the regulation of OPC amplification and morphology. On the contrary, mutant
and D-JNKI-1 treated OPCs did not show overt alterations of differentiation in vitro. However, they displayed
a decreased surface extension suggesting that cell-autonomous factors may participate in cortical/CC hypomy-
elination in JNK1 KO mice. These data point to JNK1 as a novel player in the complex regulatory network of
oligodendroglia functions and myelination.
Results
JNK1 KO mice display myelin abnormalities. In order to address the impact of JNK1 ablation on
oligodendroglia, we firstly examined the expression of the myelin marker MBP in the cerebral cortex. We found
that JNK1 KO mice display a lower expression of MBP, both in infragranular and supragranular layers of the
somatosensory cortex (Fig. 1A,C and Suppl. Fig. 1A,B) and in the CC (Fig. 1B,D). This defect was found at post-
natal ages (P7 and P15) and persisted at adult stages (P90). Myelin abnormalities, not only restricted to MBP
expression, were also confirmed by observation of WT and JNK1 KO Gallyas-stained sagittal sections (Suppl.
Fig. 1C). Former studies on JNK1 KO revealed some extent of axonal degeneration17. Thus, we asked whether the
observed reduction of MBP and myelin reflected the axonal regressive events. Indeed, the ratio of MBP/healthy
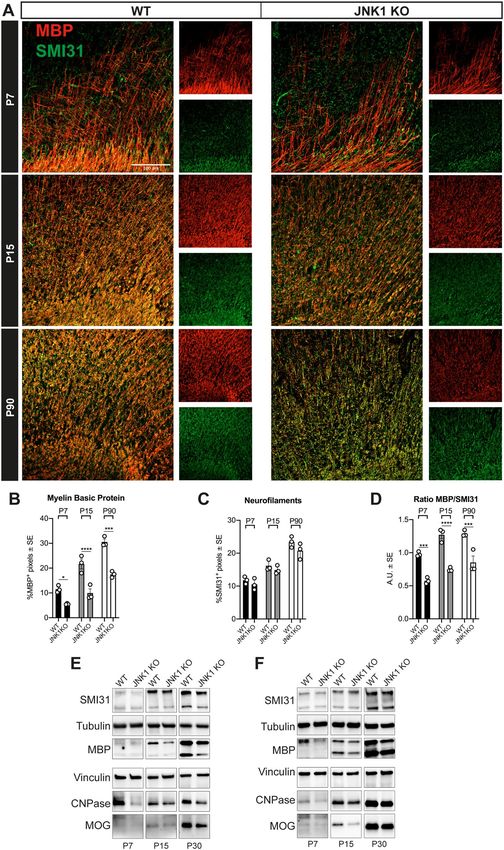
axons (as detected by labelling of SMI31, a phosphorylated epitope of neurofilament H, a major component of
the axonal cytoskeleton (Fig. 2A; Yandamuri et al.27)) appeared to be reduced in JNK1 KO cortices and CC com-
pared to WT, and the axon densities did not display a major decrease in mutant mice within the analyzed time
window (Fig. 2A–D). These histological results were in line with western blotting (WB) analyses, which con-
firmed a reduction in the amount of other myelin-associated proteins, such as 2′,3′-Cyclic-Nucleotide 3′-phos-
phodiesterase (CNPase) and Myelin Oligodendrocyte Glycoprotein (MOG) (Fig. 2E,F and Suppl. Fig. 2A,B). On
the whole, these results suggest hypomyelination in JNK1 KO mice. Also, myelin alterations were not merely
C1+ OLs were overall comparable
attributable to a decrease of mature OLs in JNK1 KO mice as the densities of C
to those of WTs in both cerebral cortex and CC (Suppl. Fig. 3A,B).
To assess whether changes in myelin levels in mutants were accompanied by alterations of the axo-mye-
linic arrangement, we examined the nodal/paranodal region by immunostaining against the paranodal protein
CASPR28, 29. Quantification of C
ASPR+ segments in the CC of adult brains revealed a significant staining increase
in JNK1 KO samples (Fig. 1E,F). Moreover, analyses of C ASPR+ node/paranode length showed a 17% increase
in CASPR+ segment length in mutants as compared to control mice (Fig. 1G). Of note, this latter feature is fre-
quently found in hypo-/dys-myelinating conditions30, 31, corroborating the idea of myelin alterations in JNK1
KO mice cortex and CC.
JNK1 KO cortical OPCs display enhanced proliferation early after birth and morphological
alterations. As a second step, we expanded the investigation on OPCs and assessed their density, prolifera-
tion rate and apoptosis at different survival times (P7, P15 and P90). We found a significant increase (about
34%) in the density of PDGFRα+ OPCs at P7 and P15 in KO mice compared to WT, both in cerebral cortex and
CC (Fig. 3A–C, representative images at P7) with no changes in cell distribution throughout the cortical layers
(Suppl. Fig. 3C). Since the presence of a higher number of OPCs in the JNK1 KO cortex could result from either
higher cell proliferation or decreased apoptosis (or a combination of the two), we counted PDGFRα+ duplets as
a measure of proliferative OPCs5, 32. At P7, the fraction of OPCs in duplets in JNK1 KO cortices was almost two-
fold higher than in WT, revealing that mutant OPCs have a higher proliferation rate than WT cells (Fig. 3D,E).
Yet, the normal density (Fig. 3B,C) as well as the OPC proliferative fraction (Fig. 3E) of JNK1 KO OPCs appeared
restored at adult stages (P90), suggesting a higher susceptibility of young OPCs to JNK1-dependent regulatory
mechanisms. These results were also confirmed by analyses of NG2+/Ki67+ OPCs (Suppl. Fig. 3D).
Conversely, when we examined NG2+ OPCs expressing activated caspase 3 (cCASP3) to detect ongoing
apoptosis, co-expressing OPCs were barely detected in both WT and JNK1-KO mice (not shown). Similar results
were also obtained by TUNEL staining (Suppl. Fig. 3E). These data point to JNK1 participation in the regulation
of OPC proliferation, at least in a developmental time window.
Based on increased OPC density, we hypothesized that the territory occupied by each cell could also be
altered in JNK1 KO cortices. This hypothesis was initially tested by the analysis of the Voronoi polygons, a tool
Scientific Reports | (2021) 11:7264 | https://doi.org/10.1038/s41598-021-86673-6 2
Vol:.(1234567890)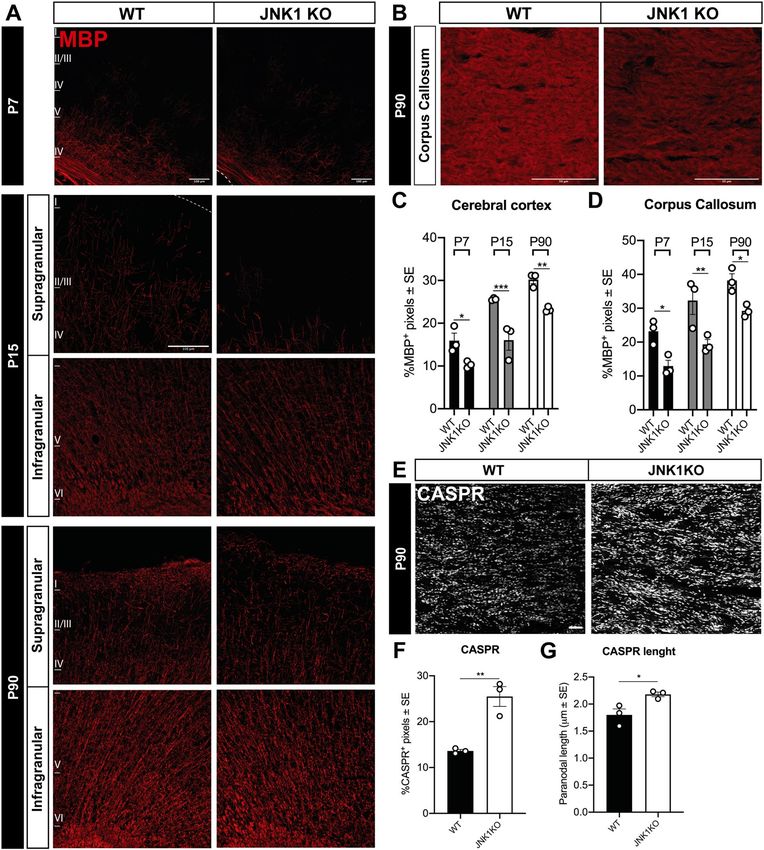
www.nature.com/scientificreports/
Figure 1. Myelin alterations in JNK1 KO mouse cortex and CC. (A) Myelin distribution (red) in the cortex
of P7, P15 and P90 WT vs JNK1KO mice. At P7 images illustrate the deep layers of the somatosensory cortex,
at P15 and P90 images illustrate separately infragranular and supragranular cortical layers. (B) Representative
images of MBP (red) distribution in P90 WT vs JNK1KO mice CC. (C, D) Quantification of the percentage of
MBP+ pixels in the cortex (C) and in the CC (D) of P7, P15 and P90 WT vs JNK1KO mice. (E) Distribution
of CASPR+ paranodes in the CC of P90 WT vs JNK1KO mice, and (F) quantification of the percentage of
CASPR+ pixels. (G) Quantification of the length of CC CASPR+ paranodes in P90 WT vs JNK1KO mice. Scale
bars: 100 μm in (A) and (B), 10 μm in (E). WT wild type, P postnatal day, MBP Myelin Basic Protein, CASPR
contactin-associated protein. *P < 0.05; **P < 0.01; ***P < 0.001.
Scientific Reports | (2021) 11:7264 | https://doi.org/10.1038/s41598-021-86673-6 3
Vol.:(0123456789)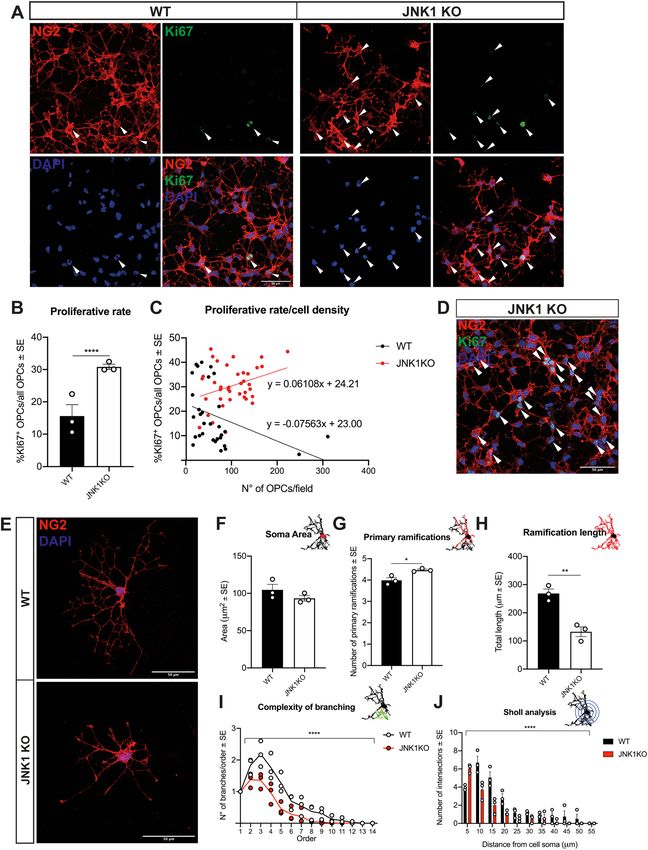
www.nature.com/scientificreports/
Figure 2. Myelin alterations in JNK1 KO are not related to axonal abundance. (A) MBP+ (red) and SMI31
neurofilaments (green) expression in the cortex and CC of P7, P15 and P90 WT vs JNK1KO mice. At P7 images
illustrate the deep layers of the motor cortex, nearby cingulum bundle. Quantification of the percentage of MBP+
(B), and SMI31 (C) pixels in the cortex and in CC of WT vs JNK1KO mice, and their ratio (D). (E) Western
blots of P7, P15 and P30 WT and JNK1KO cortices and (F) corpora callosa. Full length blots are presented in
Suppl. Fig. 5 (A—cortices, B—corpora callosa). Scale bars: 100 μm. WT wild type, P postnatal day, A.U. arbitrary
units, MBP Myelin Basic Protein, SMI31 neurofilaments, CNPase 2′,3′-Cyclic-Nucleotide 3′-phosphodiesterase,
MOG Myelin Oligodendrocyte Glycoprotein. *P < 0.05; **P < 0.01; ***P < 0.001; ****P < 0.0001.
Scientific Reports | (2021) 11:7264 | https://doi.org/10.1038/s41598-021-86673-6 4
Vol:.(1234567890)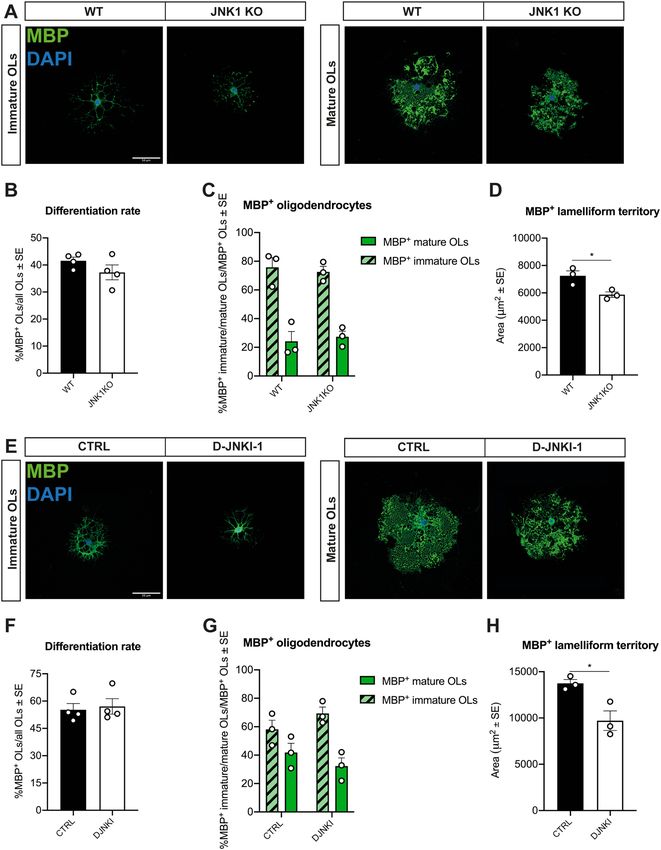
www.nature.com/scientificreports/
to analyze the spatial distribution of cells33–35. Voronoi analysis suggested that, during early developmental stages
(P7-P15), JNK1 KO OPCs occupied a less extended area than WT cells (Fig. 3F–I). To further corroborate these
data and better understand the underlying cellular features, we performed morphometric analyses of both OPC
somata and branches (Fig. 3J–L). Analyses at early and adult stages showed that OPC soma areas did not differ
between WT and KO cells (Fig. 3K). However, in agreement with the Voronoi results, OPC territory (i.e. the area
occupied by the entire OPC extension, including cell ramification) was significantly smaller in JNK1 KO than in
WT (Fig. 3L). Yet, this decrease was no longer appreciated at adult stages (Fig. 3L). Nevertheless, at P90, JNK1
KO OPCs displayed a shorter total length of ramifications with no changes in the number of primary ramifica-
tions (Fig. 3M,N) and a lower ratio of the number of branches over branch order (Fig. 3O). Thus, mutant OPC
processes appeared less complex and overall less extended compared to the WT ones.
Taken together, these data indicate that JNK1 may play a role in the OPC proliferation and in the regulation
of OPC branching architecture.
Cultured JNK1 KO OPCs reproduce proliferative and morphological alterations found
in vivo. In order to disentangle whether JNK1 KO OPC alterations in vivo depended on other cell types or
could be explained cell autonomously, we performed cultures of MACS-isolated OPCs derived from P0 WT or
JNK1 KO mice and examined cell proliferation, apoptosis and morphology.
At first, we tested the occurrence of possible dysregulated expression of the other JNK isoforms, potentially
accounting for compensatory mechanisms or functional alterations. However, levels of JNK2 and JNK3 expres-
sion in acutely isolated JNK1 KO cells, as tested by qRT-PCR, were comparable to those of WT cells (Suppl.
Fig. 4C–E), thus confirming that we were assessing the consequence of JNK1 abrogation.
In culture, MACS-sorted JNK1 KO OPCs showed higher cell densities per field (Fig. 4A–D) and a twofold
higher proliferation rate compared to WT cells, as revealed by colocalization with the proliferative marker Ki67
(Fig. 4A,B). Of note, while the proliferative fraction of WT cells decreased with increasing cell densities, the
proliferative fraction of JNK1 KO OPCs remained constant, irrespective of the number of OPCs (Fig. 4C,D).
As regards apoptosis, we found a threefold higher fraction of c CASP3+ JNK1 KO OPCs compared to WT cells
and an apoptotic rate decreasing with increasing densities in both KO and WT cells (Suppl. Fig. 4A,B). These
data suggest that, although increased in KO cells, apoptosis is similarly regulated in both mutant and WT cells,
whereas in mutant OPCs proliferative regulatory mechanisms may be altered as a consequence of JNK1 loss.
Moreover, morphometric analyses on non-proliferative isolated OPCs showed that JNK1 KO OPCs display a
reduced ramification complexity compared to WT cells (Fig. 4E,F–J) in the presence of similar soma area (Fig. 4F)
and of a slightly higher number (about 12%) of primary ramifications (Fig. 4G). These results reveal that mutant
OPCs show alterations independently of the presence of other cell types.
To confirm these results in a distinct experimental model, we investigated the effects of JNK inhibition
obtained with the D-JNKI-1 inhibitor36 on rat OPC cultures. D-JNKI-1 is a cell penetrating peptide that prevents,
through a competitive mechanism, the binding of JNK to both the scaffold protein JNK-interacting protein-1
(JIP1) and its substrates36–38. Of note, D-JNKI-1 does not act exclusively on the binding of JNK1, but also on
that of JNK2 and JNK3. Analysis of Ki67 expression revealed a higher proliferative rate in OPCs treated with
D-JNKI-1 compared to controls (Fig. 5A,B). Moreover, morphometric analyses highlighted branching altera-
tions resulting in a reduced ramification complexity (Fig. 5C), thus resembling those of MACS-sorted JNK1 KO
OPCs, as indicated by Sholl analysis (Fig. 5D).
Altogether these data show that JNK1 KO-related OPC functional and morphological abnormalities occur
also independently of other cell types affected by the mutations and suggest that JNK1 is implicated in the regula-
tion of OPC proliferation and process architecture through a cell autonomous mechanism.
JNK1 KO OLs do not show overt differentiation defects in vitro but display reduced territory
occupancy. In order to study whether JNK1 KO myelin alterations in vivo could be explained by an altered
ability of JNK1 KO OLs to differentiate, we cultured MACS-isolated OPCs derived from P0 WT or JNK1 KO in
non-proliferative conditions and examined MBP expression as well as cell morphology.
JNK1 KO and WT OLs in culture displayed equivalent capability to express MBP (Fig. 6A,B). Moreover, when
we analyzed the frequency of immature vs mature MBP+ cells, as distinguished by process complexity and by
MBP localization (see “Methods”) we found no differences in JNK1 KO vs WT cells (Fig. 6C).
We also investigated the effects of JNK inhibition obtained with D-JNKI-136 on cultured rat OLs. Analysis
of MBP+ OLs confirmed the results obtained for mutant OLs showing that D-JNKI-1 treated cells were able
to differentiate, branch and form M BP+ lamellae to the same extent of control cells (Fig. 6E–G). However, in
BP+ lamellae appeared reduced in JNK1 KO and
both experimental conditions, the cell territory occupied by M
D-JNKI-1 treated OLs (Fig. 6D,H).
Overall, these data show that the germinal ablation/inhibition of JNK1 does not affect the ability of OPCs to
BP+ OLs.
differentiate in M
Discussion
The ERK/MAPK pathway is known to take part in the regulation of OPC architecture, proliferation and oligo-
dendro-/myelino-genesis11, 12. Among MAPKs, JNK1 contribution to oligodendroglial biology has been only
marginally investigated so far. In this study, we found that constitutive JNK1 ablation in KO mice is associated
with decreased expression of myelin proteins and myelin/paranodal abnormalities in the cerebral cortex and
CC of postnatal and adult mice. Such alterations are accompanied by a transient increase in OPC density and
proliferative ability and by a persistent reduction in OPC ramifications complexity. These abnormal features are
also present in JNK1 KO OPCs cultures and in WT OPCs cultures treated with D-JNKI-1, indicating that cell
Scientific Reports | (2021) 11:7264 | https://doi.org/10.1038/s41598-021-86673-6 5
Vol.:(0123456789)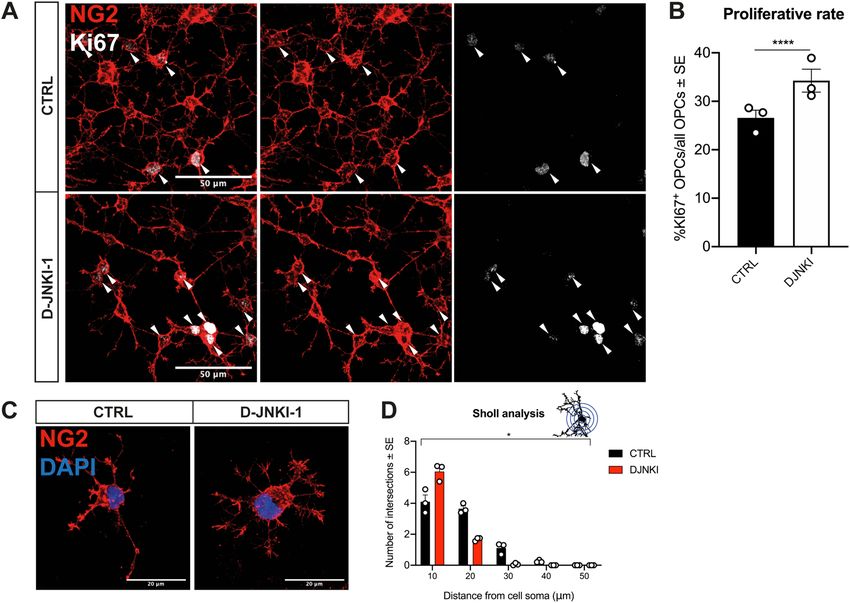
www.nature.com/scientificreports/

          Scientific Reports |   (2021) 11:7264 |   https://doi.org/10.1038/s41598-021-86673-6   6

Vol:.(1234567890)
www.nature.com/scientificreports/
◂Figure 3. JNK1 loss increases OPC proliferation and alters OPC territory and architecture in vivo. (A)
Distribution of PDGFRα+ OPCs (red) in WT vs JNK1KO cortex and CC (area between dotted lines) at
P7. (B, C) Quantification of PDGFRα+ OPCs in the dorsal cortex (B) and CC (C) at P7, P15 and P90. (D)
Representative image of a PDGFRα+ (red) OPC duplet (i.e. juxtaposed sister cells just exiting cytokinesis and
showing juxtaposed and symmetrical cell somata with decondensed grainy DAPI staining, yellow arrows) in the
cortical grey matter. White arrow points to an individual non-newly generated OPC. DAPI (blue) counterstains
cell nuclei. (E) Quantification of the fraction of PDGFRα+ OPCs in duplets over the OPC population (as a
measure of OPC division rate) at P7 and P90. (F) Distribution of NG2+ OPCs (red) and construction of related
Voronoi polygons in the cerebral cortex of P7 WT vs JNK1KO mice. Each Voronoi polygon is colour-coded
according to the size of the area. DAPI (blue) counterstains cell nuclei. (G, H, I) Areas covered by the Voronoi
polygons in (G) P7, (H) P15 and (I) P90 WT vs JNK1KO mice. (J-O) Morphology and morphometry of WT
vs JNK1KO NG2+ OPCs. (J) Representative images of P7 WT vs JNK1 KO N G2+ OPCs (red) in supragranular
and infragranular layers of the cortex and in the CC, with related Imaris reconstruction (panels on the right).
(K, L) Quantification of the soma area (K) and of the territory occupied by OPC ramifications (L) in P7 and P90
WT vs JNK1 KO mice. (M–O) Quantification, through Neurolucida reconstruction, of the number of primary
ramifications (M), mean length (N) and complexity (O) of the ramifications in P90 WT vs JNK1 KO N G2+
OPCs. Asterisks in (O): Two-way ANOVA, main effect of genotype. Scale bars: 100 μm in (A), 100 μm in (F),
20 μm in (L). WT wild type, P postnatal day, PDGFRα platelet-derived growth factor receptor A, NG2 neural/
glial antigen 2. *P < 0.05; **P < 0.01; ***P < 0.001; ****P < 0.0001.
types distinct from oligodendroglial cells are not implicated in such alterations and suggesting a cell autonomous
role of JNK1 in OPCs. On the other hand, JNK1 KO cultured OLs and D-JNKI-1 treated cells progress toward
differentiation similarly to WT cells but displayed reduced lamellae-occupied territories, thus suggesting a cell-
autonomous contribution of JNK1 in the observed cortical/CC hypomyelination.
JNK1 and myelination. In the cerebral cortex of the mutant mice, we observed a lower expression of mye-
lin proteins and longer CASPR+ paranodes, suggesting deficits in myelin structure and alterations in myelinating
OLs/axon crosstalk. Defective myelin deposition and alterations in the paranode length are two recurrent fea-
tures of hypo/dysmyelinating conditions linked to primary oligodendroglia p athology30, 31. In vitro experiments
indicate that JNK1 KO does not impair MBP expression or affect major steps of OL differentiation. However,
morphological maturation in differentiating OLs appeared affected in mutant and treated cells, as lamellae-
occupied territories were reduced. Based on evidence that OL morphological or cytoskeletal alterations are often
associated with reduced myelination9, 39, it is conceivable that reduced membrane extension in mutant OLs may
contribute to the hypomyelinated phenotype found in vivo. Although we did not observe overt degeneration in
JNK1 KO axons at the examined ages and territories, former electron microscopy investigations revealed some
extent of axonal degeneration in JNK1 KO mice17, and showed that JNK1 takes part in microtubule maintenance
and integrity, since earlier a ges16, 17. Microtubule dynamics both in neurons and oligodendrocytes play a fun-
damental role in OLs/neuron crosstalk, whose integrity is crucial for a correct myelination40–43. On these bases,
we cannot exclude subtle microtubule-related alterations in axons, myelin sheath formation and/or OLs/axon
crosstalk could all take part in the hypomyelination phenotype observed in vivo in JNK1 KO. Further investiga-
tions are needed to clarify this issue.
JNK1 role in OPC proliferation and apoptosis. We also found that JNK1 KO OPCs display a higher
proliferative rate associated with increased density at postnatal developmental stages, with no changes in their
distribution through cortical layers. This feature suggests that JNK1 operates as a negative regulator of cell pro-
liferation in OPCs. According to in vitro experiments JNK1 appears to act in a cell autonomous fashion in cell
division regulation in OPCs. However, it cannot be excluded that JNK1 KO OPCs could have been primed to an
altered regulation of proliferation by environmental signals received at embryonic ages in vivo, so to determine
their increased division rate also in purified culture conditions.
Notably, our observations apparently clash with the results of former studies showing JNK pathway (although
without isoform specifications) as necessary for OPC proliferation upon incubation with the conditioned medium
of neuroblastoma c ells44. However, on the other hand, JNK1 specific inhibition was shown to increase endothe-
lial cell division in controlled conditions45, 46 or to have no effect in a carcinoma cell line47. Moreover, in cancer
development, JNK1 seems to play a dual role in promoting/inhibiting cell p roliferation48. Thus, literature data
indicate a cell/context dependent role for JNK1 in the modulation of proliferative events.
OPC proliferation is finely tuned by two main mechanisms. One first mechanism appears to operate through
an intracellular timer driven by the mitogen PDGF (Platelet-Derived Growth Factor), that determines when
individual OPCs should stop dividing to proceed toward d ifferentiation49–51. One other mechanism implies OPC-
to-OPC contact-mediated inhibition of cell proliferation through, for instance, Netrin-1 (NT-1) and its receptor
Deleted in Colorectal Cancer (DCC) signaling6, 7. Of note, other sources of these contact-mediated inhibitors are
unclear, although neurons have been shown to produce NT-17, 52. Former studies have implicated JNK1 activity
as a positive regulator of cell cycle progression and a mediator of PDGF actions in OPCs53. On the other hand,
JNK1 was also reported to mediate NT-1/DCC signaling in neurons, suggesting that similar mechanisms could
act also in oligodendroglia and, therefore, that JNK1 ablation could alter contact-mediated OPC proliferation
inhibition54. In vitro data appear to support this latter hypothesis, as they show that, at difference with WT cells,
JNK1 KO OPC proliferative rate is maintained high also in conditions of elevated cell density.
Scientific Reports | (2021) 11:7264 | https://doi.org/10.1038/s41598-021-86673-6 7
Vol.:(0123456789)www.nature.com/scientificreports/
Figure 4. JNK1KO OPCs show higher proliferation and less complex ramifications in vitro. (A) Representative images of MACS-
sorted cultured WT or JNK1 KO NG2+ (red) OPCs. K i67+ proliferating cells (green) are indicated by white arrows. DAPI (blue)
counterstains cell nuclei. (B) Quantification of WT vs JNK1 KO MACS-sorted proliferating OPCs. In (C) the proliferative fraction
(Ki67+ OPCs over all OPCs) is plotted as a function of the number of OPCs in each analyzed field. The result of this analysis was
also confirmed excluding the WT leverage points. (D) Representative image of MACS-sorted cultured JNK1 KO OPCs in high cell
density. (E) Representative images of WT vs JNK1 KO MACS-sorted N G2+ OPCs (red). DAPI (blue) counterstains cell nuclei. (F–I)
Quantification, through Neurolucida reconstruction, of soma areas (F), number of primary ramifications (G), total length (H) and
complexity (I) of the ramifications of WT vs JNK1 KO MACS-sorted OPCs. (J) Sholl analysis of WT vs JNK1 KO MACS-sorted OPCs.
Asterisks in (I) and (J): Two-way ANOVA (main effect of genotype). Scale bars: 50 μm in (A) and in (D). WT wild type, NG2 neural/
glial antigen 2, Ki67 Ki67 antigen. *P < 0.05; **P < 0.01; ****P < 0.0001.
Scientific Reports | (2021) 11:7264 | https://doi.org/10.1038/s41598-021-86673-6 8
Vol:.(1234567890)www.nature.com/scientificreports/
Figure 5. D-JNKI-1 treatment of rat OPCs mimics JNK1 KO in vitro. (A) Representative images and (B)
quantification of proliferative rat NG2+ CTRL vs D-JNKI-1-treated OPCs (red). K i67+ proliferating cells (white)
are indicated by white arrows. (C) Representative images and (D) Sholl analysis of CTRL vs D-JNKI-1-treated
OPCs (red). DAPI (blue) counterstains cell nuclei. Asterisks in (D) Two-way ANOVA (main effect of genotype).
Scale bars: 50 μm in (A) and 20 μm in (C). CTRL control cells, D-JNKI-1 JNK1 inhibitor-treated cells, NG2
neural/glial antigen 2, Ki67 Ki67 antigen. *P < 0.05; **P < 0.01; ****P < 0.0001.
Our data further showed that JNK1 KO OPCs proliferation and density in vivo are increased only during
developmental stages. Although OPC amplification, self-maintenance and maturation at adult stage are supposed
to recapitulate the corresponding developmental p rocesses55, to what extent the very same molecular mechanisms
subserve these events in the postnatal vs adult CNS is unclear. Age-dependent differences in gene expression and
function occur in OPCs. In particular, early OPCs are more proliferative, characterized by a shorter cell cycle and
more susceptible to JNK-dependent death24, 56–58. Whether and how JNK1 is involved in postnatal vs adult OPC
distinct properties remains elusive. We can also speculate that supernumerary JNK1 KO OPCs may be simply
eliminated in parallel with the progression of myelination, thereby adjusting the number of OLs to that of the
axons (and to limiting amounts of trophic factors provided by axons)59, as normally occurs in WT b rains60, 61.
JNK1 signaling has also been reported to participate in cell death which could impact on proliferation rates
and cell densities. JNK pathway was shown to promote apoptosis in OPCs/OLs under stress c onditions62–64.
However, if JNK1 isoform is implicated in physiological cell death is unknown. In in vivo analyses we did not find
evidence of an altered apoptosis rate in JNK1 KO OPCs. Conversely, in MACS-sorted JNK1 KO OPCs cultures,
we found an increased fraction of apoptotic cells. Such a fraction, similar to what occurs for WT cells, appeared
to decline with increasing cell densities, in agreement with an increased production of survival signals at sites
with high cellularity. These data overall suggest that the mechanisms underlying the physiological regulation
of apoptosis are maintained in mutant cells, and increased apoptosis may simply reflect the increased number
of JNK1 KO OPCs. This may imply that, in OPCs, JNK isoforms other than JNK1 regulate this aspect, or can
compensate for JNK1 ablation in the physiological regulation of apoptosis.
JNK1 role in OPC architecture. Our analyses also provided evidence of a transient alteration of OPC
territory occupancy. Voronoi polygons and cell territory analyses (Fig. 3F–I,K,L) show that, at least during devel-
opment, OPC territory in JNK1 KO is significantly reduced. Although at adult stages this gross OPC alteration
seems to be restored, adult JNK1 KO OPCs displayed a reduction in ramification length and branching com-
plexity (Fig. 3J–O). These defects were also recapitulated in cell culture analyses (Figs. 4E–J, 5C–D), confirming
Scientific Reports | (2021) 11:7264 | https://doi.org/10.1038/s41598-021-86673-6 9
Vol.:(0123456789)www.nature.com/scientificreports/
Figure 6. JNK1 KO and D-JNKI-1 treated OLs can differentiate and produce MBP. (A) Representative images
and (B) quantification of differentiated MBP+ WT vs JNK1 KO OLs (green). DAPI (blue) counterstains cell nuclei.
(C) Quantification of the percentage of immature and mature WT vs JNK1 KO OLs. (D) Quantification of the
MBP+ lamelliform territory occupied by WT vs JNK1 KO OLs. (E) Representative images and (F) quantification
of differentiated MBP+ CTRL vs D-JNKI-1 treated OLs (green). DAPI (blue) counterstains cell nuclei. (G)
Quantification of the percentage of immature and mature CTRL vs D-JNKI-1 treated OLs. (H) Quantification of
the MBP+ lamelliform territory occupied by CTRL vs D-JNKI-1 treated OLs. Scale bars: 50 μm in (A) and (E). WT
wild type, MBP Myelin Basic Protein, CTRL control cells, D-JNKI-1 JNK1 inhibitor-treated cells. *P < 0.05.
Scientific Reports | (2021) 11:7264 | https://doi.org/10.1038/s41598-021-86673-6 10
Vol:.(1234567890)www.nature.com/scientificreports/
the cell autonomous role of JNK1. These findings might also reflect the persistence of less complex immature
phenotypes associated with the increased proliferative activity of the mutant cells. However, the maintenance
of morphological alterations at adult ages, when mutant cell proliferation has declined back to WT levels, sup-
ports an involvement of JNK1 in OPC cytoskeletal dynamics independent of proliferative events, as previously
found in n eurons17, 65. In keeping with this possibility, one potential JNK1 effector candidate in the regula-
tion of OPC cytoskeleton is the microtubule-associated protein 1B (MAP1B), expressed both in neurons and
oligodendrocytes66, that regulates microtubule elongation and dynamics. MAP1B is activated by kinases includ-
ing JNK through phosphorylation67, and in neurons is known to support axon outgrowth. Notably, among the
JNK isoforms, JNK1 appears to be particularly involved in the process of axonal elongation68. In oligodendro-
glia, MAP1B is expressed in OPCs progressing toward the preoligodendrocyte s tages66, 69, 70—a transition that
involves profound morphological changes—suggesting that its deregulated activation in the absence of JNK1
could participate in the altered branching of mutant OPCs. Another possible target of JNK1 in the regulation of
OPC cytoskeleton is mTOR. Both molecules act in parallel or via cross-regulation in many pathological contexts,
where JNK seems to positively regulate mTOR activity71.
JNK isoform 1 appears to play a predominant role in oligodendroglia. In further support of JNK1
functions in oligodendrocytes, we found that mutant cell proliferative and morphological alterations were reca-
pitulated in WT OPCs treated with D-JNKI-136. This inhibitor is able to block JIP-JNK interaction, thus pre-
venting the phosphorylation of c-Jun, the main downstream target of all JNK isoforms, and of the other JBD
targets38, 72. Thus, this treatment might have revealed a much broader impact on the cells. However, D-JNKI-1
administration well recapitulated the proliferative and morphological phenotype of JNK1 KO OPCs, suggest-
ing that JNK1, among the three JNK isoforms, has a predominant role in the regulation of OPC proliferation,
branching and membrane extension. This hypothesis is also supported by qRT-PCR data of MACS-sorted OPCs
(Suppl. Fig. 4C–E), revealing the absence of any compensatory upregulation or dysregulated expression the
other two JNK isoforms.
In conclusion, our study shows that JNK1 ablation results in persistent myelin abnormalities in vivo and that
JNK1 participates in a cell-autonomous manner in the regulation of OPC proliferation, branching architecture
and membrane extension at mature stages, unveiling a novel player in the complex regulatory network of OPC
biology. Further investigations are needed to disentangle the potential contribution of axonal vs oligodendroglial
alterations in the hypomyelination phenotype in vivo. Finally, it is also interesting to note that most of the altera-
tions that we reported in mutant oligodendroglia (i.e. contact-mediated regulation of OPC proliferation, OPC
branching architecture and paranodal organization) are regulated by NT-1 s ignaling7, 73–75. Further studies are
needed to clarify whether NT-1 acts via JNK1 in oligodendroglia, as formerly shown in n eurons76, 77.
Methods
Experimental animals. For histological analyses and Magnetic-Activated Cell Sorting (MACS) we
employed JNK1 KO78 and age-matched wild-type (WT) mice as controls. Perfusions of juvenile and adult
mice were carried out under deep general anaesthesia obtained by intraperitoneal administration of ketamine
(100 mg/kg; Ketavet; Bayern; Leverkusen, Germany) supplemented by xylazine (5 mg/kg; Rompun; Bayer). For
OPCs cultures, postnatal (P0-P1) mice and rats were anesthetized on melting ice. Groups of 4–5 mice were
housed in transparent polycarbonate cages (Tecnoplast, Buggirate, Italy) provided with sawdust bedding, boxes/
tunnels hideout as environmental enrichment and striped paper as nesting material. Food and water were pro-
vided ad libitum; environmental conditions were 12 h/12 h light/dark cycle, room temperature 21 °C ± 1 °C and
room humidity 55% ± 5%.
The experimental plan was designed according to the guidelines of the NIH, the European Communities
Council (2010/63/EU) and the Italian Law for Care and Use of Experimental Animals (DL26/2014). It was also
approved by the Italian Ministry of Health (Authorization 1112/2016 prot E669C.20) and the Bioethical Com-
mittee of the University of Turin. The study was conducted according to the ARRIVE guidelines.
Histological procedures. Animals were anaesthetized and transcardially perfused with 4% paraformal-
dehyde (PFA) in 0.1 M phosphate buffer (PB). Brains were post-fixed for 1 or 5 h (for immunofluorescence
or Nissl/Gallyas staining, respectively), cryoprotected, and processed. Brains were cut in sagittal sections, for
Gallyas stain of myelin using silver nitrate79, 80. Otherwise, brains were cut in 40 µm thick coronal sections
and then treated in order to detect the expression of the following antigens: NG2 (1:200, Millipore, Billerica,
MS, USA); PDGFRα (APA-5 clone, 1:300, BD Biosciences, San Jose, CA, USA); MBP (Smi-99 clone, 1:1000
Sternberger); SMI31 (1:500, SMI-31R Sternberger); CASPR (1:1000, Abcam); cCASPase-3 (1:200, Cell Signal-
ing); Ki67 (1:750, Invitrogen). Incubation with primary antibodies was made overnight at 4 °C in PBS with 2%
Triton-X 100. The sections were then exposed for 2 h at room temperature (RT) to secondary Cy3−/ Cy2− (Jack-
son ImmunoResearch Laboratories, West Grove, PA), Alexafluor 647- (Molecular Probes Inc, Eugene, Oregon)
conjugated antibodies. 4,6-diamidino-2-phenylindole (DAPI, Fluka, Milan, Italy) was used to counterstain cell
nuclei. Sections were mounted on microscope slides with Tris-glycerol supplemented with 10% Mowiol (Calbio-
chem, LaJolla, CA). TUNEL assay was performed using the TMR red In Situ Cell Death Detection Kit (Roche,
Basel, Switzerland) according to the manufacturer’s protocol.
Cell cultures. After tissue dissociation with a papain + DNAseI solution (papain 1.5 mg/ml, l-cysteine
360 µg/ml, DNAseI 1000U/ml in MEM; all from Sigma-Aldrich, Saint Louis, MS, USA), mouse OPCs were
enriched by positive selection using an anti-PDGFRα antibody conjugated to magnetic beads, according to the
instructions of the manufacturer (Miltenyi Biotech GmbH, Bergisch Gladbach, DE). MACSorted OPCs were
Scientific Reports | (2021) 11:7264 | https://doi.org/10.1038/s41598-021-86673-6 11
Vol.:(0123456789)www.nature.com/scientificreports/
plated onto poly-d-lysine (1 µg/ml, Sigma-Aldrich, Saint Louis, MS, USA) coated glass coverslips in a prolif-
erative medium including Neurobasal, 1X B27 (Invitrogen, Milan, Italy), 2 mM l-glutamine (Sigma-Aldrich,
Saint Louis, MS, USA), 10 ng/ml PDGF-BB and 10 ng/ml human bFGF (Miltenyi Biotech GmbH, Bergisch
Gladbach, DE), or processed for quantitative RT-PCR analysis. Purity of the MACS-selected OPCs was verified
by immunocytochemistry (more than 95% of the cells were NG2-positive (+) at 6 h post-plating). Cells were
cultured 3DIV in proliferative medium (described above) and fixed. Alternatively, they were maintained 1DIV
in proliferative medium and 6DIV in non-proliferative medium—Neurobasal, 1X B27 (Invitrogen, Milan, Italy),
2 mM l-glutamine (Sigma-Aldrich, Saint Louis, MS, USA)—to allow differentiation, and subsequently fixed.
To test the effect of D-JNKI-1 treatment, primary rat OPCs were isolated by the shaking method from mixed
glial cultures obtained from P0-1 Sprague–Dawley rat cortex, as described in5. OPCs were plated onto poly-
D-lysine (1 µg/ml, Sigma-Aldrich) -coated 12-mm glass coverslips for immunocytochemistry (5 × 10⁴ cells/
coverslip) in the proliferative medium (see above). After 1 day in vitro (DIV), the cell permeable JNK-inhibitor
D-JNKI-1 (2 µM)36 was added to the medium until fixation (after 3DIV or 7DIV in proliferative or non-prolif-
erative conditions, respectively).
After 3 or 7 DIV, OPCs/OLs (both from mice and rats) were then fixed for 20 min at RT with 4% PFA in
0.1 M PB and labelled with anti-NG2 (1:400, Millipore, Billerica, MS, USA), -Ki67 (1:1000, Novocastra), -cCAS-
Pase-3 (1:400, Cell Signaling) and -MBP (Smi-99 clone, 1:1000 Sternberger) antibodies overnight at 4 °C in PBS
with 0.25% Triton-X. Then, coverslips were incubated with Cy3−/Cy2− (Jackson ImmunoResearch Laboratories,
West Grove, PA) and Alexafluor647- conjugated secondary antibody (Molecular Probes, Eugene, Oregon) for
1-h RT. After a 5-min incubation with DAPI (1:1000, Fluka, Saint Louis, USA), coverslips were mounted with
Tris-glycerol supplemented with 10% Mowiol (Calbiochem, LaJolla, CA).
In vivo cell counting, 3D reconstructions, densitometric and morphological analyses. His-
tological specimens were examined using a Leica TCS SP5 (Leica Microsystems, Wetzlar, Germany) confocal
microscope. Quantitative evaluations (i.e. PDGFRα+ cell density, density and fraction of cell duplets, N G2+/
+ + +
Ki67 cell density, cCASP3 /NG2 cell density, 3D-reconstruction of the corpus callosum) were performed by
means of the Neurolucida system (MicroBrightfield, Colchester, VT).
The extent of MBP/SMI31 or CASPR staining was quantified with ImageJ (Research Service Branch, National
Institutes of Health, Bethesda, MD; available at http://rsb.i nfo.n
ih.g ov/i j/) as percentage of positive pixels over an
area of 0.15 m m2 in confocal image stacks comprising 16 optical slices 0.99 µm thick (for MBP/SMI31) or over
an area of 0.015 m m2 in confocal image stacks comprising 5 optical slices 0.99 µm thick (for CASPR). Confocal
images (1024 × 1024 pixels) of MBP/SMI31 or CASPR immunostaining were all acquired with a speed of 200 Hz
with the same settings (i.e. pinhole size: MBP, 67.9 µm; SMI31, 67.9 µm; CASPR, 67.9 µm; laser power: MBP,
80%; SMI31, 28%; CASPR, 10%; gain: MBP, 484.0 V; SMI31, 570.0 V; CASPR, 570.0; offset: MBP, − 2%; SMI31,
− 1.4%; CASPR, − 3%) and analyzed after ImageJ default auto-thresholding (i.e. IJ_IsoData). Voronoi analysis
of the cell distribution was performed with ImageJ while cell territory and soma area were analyzed with Imaris
(Bitplane) software (only cells whose entire extension was completely included in the confocal stack were con-
sidered). The number of inspected cells ranged from 46 to 70 cells per individual, with a total of ~ 300/350 cells
per genotype. Primary ramifications, ramification length and complexity of branching analyses were performed
with the Neurolucida system (MicroBrightfield, Colchester, VT). The analysis of the complexity of branching was
performed assigning progressive numbers (i.e. orders) to branches extending directly from the cell soma (order
1) and then to all processes centrifugally emerging from subsequent branches (order > 1), to describe the hier-
archy of the branching scheme. Each tree (i.e. each primary ramification (order 1) associated with its branching
scheme) was analyzed individually. Plotted values (Figs. 3O,4I) represent the mean of all analyzed trees. OPCs
juxtaposed with symmetrical cell somata and decondensed grainy DNA were recognized as duplets of cells that
exited cytokinesis after cell division5, 81, 82. As such, OPC duplets were counted in tissue slices to measure OPC
proliferative activity32. OPC proliferation was also evaluated by counting NG2+/Ki67+ double positive cells.
Adobe Illustrator 6.0 (Adobe Systems, San Jose, CA) was used to assemble the final plates. In all the analyses the
experimenter was blind to the genotype of the samples.
In vitro cell counting and morphological analyses. Expression of Ki67/cCASP3 in cultured OPCs and
of MBP in cultured OLs was investigated live in five to eight quadrants localized in central and peripheral areas
of each coverslip—as described in83—with the Neurolucida software. Results for each quadrant were expressed
as a percentage of marker-positive cells over the number of OPCs and averaged across different coverslips. For
reconstructing OPC arborizations, 20–30 non-proliferative (Ki67- negative) OPCs/coverslip isolated from other
cells were randomly selected and traced live with the Neurolucida software, with a total of ~ 60–70 inspected cells
per condition. Cultured M BP+ OLs were categorized in immature/mature OLs depending on the localization of
MBP+ staining (restricted to ramifications for immature cells or further expanded to lamellae-like membranes
for mature cells) and on the complexity of their processes (poorly branched for immature cells and complexly
branched for mature cells, as described in84). The surface occupancy of MBP+ lamelliform OLs was analyzed
with ImageJ. The number of inspected cells ranged from 15 to 25 cells per coverslip, with a total of ~ 80/100 cells
per condition. In all cell counting and morphological analyses the experimenter was blind to the genotype or
treatment of the cells.
Quantitative RT‑PCR. Total RNA from MACS-sorted OPCs was extracted with the Direct-zol RNA Mini-
prep kit (Zymo Research, Irevine, USA), and reverse transcribed to cDNA with the High-Capacity cDNA Archive
kit (Applied Biosystems, Thermofisher, Waltham, USA). Quantitative Real Time RT-PCR was performed as
described in85, either with pre-developed Taqman assays (Applied Biosystems, Thermofisher, Waltham, USA)
Scientific Reports | (2021) 11:7264 | https://doi.org/10.1038/s41598-021-86673-6 12
Vol:.(1234567890)www.nature.com/scientificreports/
or by combining the RealTime Ready Universal Probe Library (UPL, Roche Diagnostics, Monza, Italy) with
the primers indicated in Suppl. Table 1. A relative quantification approach was used, according to the 2-ddCT
method86. β-actin was used to normalize expression levels.
Tissue dissection, lysates and western blotting. CC and cortices from P7, P15 and P30 WT and
JNK1KO mice, after brain sectioning with Leica vibratome, were obtained by dissection. Tissue lysates were
obtained adding RIPA buffer (1% NP40, 150 mM NaCl, 50 mM TRIS HCl pH 8, 5 mM EDTA, 0.01% SDS,
0.005% Sodium deoxycholate, Roche protease inhibitors, PMSF) for 10 min at 4 °C. Samples were homogenized
on ice with a pellet pestle (Sigma-Aldrich, Saint Louis, MS, USA) and centrifuged at 1300 rpm at 4 °C. For immu-
noblots, equal amounts of proteins were resolved by SDS–PAGE and blotted to nitrocellulose membranes, which
were then probed with anti-MBP (1:1000, Millipore, Billerica, MS, USA—MW: 18–21 kDa), -CNPase (1:500,
Sigma-Aldrich, Saint Louis, MS, USA—MW: 47 kDa), -MOG (1:1000, Proteintech, Manchester, UK—MW:
25 kDa) and -SMI31 (1:1000, SMI-31R Sternberger—MW: 160–200 kDa) antibodies. The membranes were sub-
sequently incubated with the secondary antibodies and developed using the Luminata Forte HRP substrate (Mil-
lipore, Billerica, MS, USA). Signals are normalized using anti-β-Tubulin (1:5000, Sigma-Aldrich, Saint Louis,
MS, USA—MW: 50 kDa) and anti-Vinculin (1:2000, Sigma-Aldrich, Saint Louis, MS, USA—MW: ~ 120 kDa)
antibodies. Blots were imaged on a ChemiDoc (Bio-Rad) and analyzed using Image Lab software.
Statistical analyses. In all histological quantifications, at least three animals and three sections per animal
were analyzed for each time point and experimental condition. Western blotting analyses were performed with
three animals for each time point and experimental condition, with at least three technical replicates. For in vitro
experiments, at least three experiments were performed, each with at least two technical replicates per condition.
Statistical analyses were carried out with GraphPad Prism 7 (GraphPad software, Inc). The Shapiro–Wilk test
was first applied to test for a normal distribution of the data. When normally distributed, unpaired Student’s t
test (to compare two groups) and Two-way ANOVA test (for multiple group comparisons) followed by Sidak’s
post hoc analysis were used. Statistics also included Chi-square test (to compare frequencies) and linear regres-
sion analysis (to analyze in vitro OPC proliferation and apoptosis in relation to cell density). In all instances,
P < 0.05 was considered as statistically significant. Histograms represent mean ± standard error (SE). Statistical
differences were indicated with *P < 0.05, **P < 0.01, ***P < 0.001, ****P < 0.0001. The list of the applied tests, F
values and values for n (animals for in vivo analyses, experiments for in vitro analyses), results of post hoc analy-
ses are included in Supplementary Table 2. Supporting data are available within the article or can be provided
upon request.
Received: 1 July 2020; Accepted: 16 March 2021
References
1. Snaidero, N. et al. Myelin membrane wrapping of CNS axons by PI(3,4,5)P3-dependent polarized growth at the inner tongue. Cell
156, 277–290 (2014).
2. Rasminsky, M. & Sears, T. A. Internodal conduction in undissected demyelinated nerve fibres. J. Physiol. 227, 323–350 (1972).
3. Suminaite, D., Lyons, D. A. & Livesey, M. R. Myelinated axon physiology and regulation of neural circuit function. Glia 67,
2050–2062 (2019).
4. Boda, E. & Buffo, A. Beyond cell replacement: Unresolved roles of NG2-expressing progenitors. Front. Neurosci. 8, 122 (2014).
5. Boda, E. et al. Early phenotypic asymmetry of sister oligodendrocyte progenitor cells after mitosis and its modulation by aging
and extrinsic factors. Glia 63, 271–286 (2015).
6. Hughes, E. G., Kang, S. H., Fukaya, M. & Bergles, D. E. Oligodendrocyte progenitors balance growth with self-repulsion to achieve
homeostasis in the adult brain. Nat. Neurosci. 16, 668–676 (2013).
7. Birey, F. & Aguirre, A. Age-dependent netrin-1 signaling regulates NG2+ glial cell spatial homeostasis in normal adult gray matter.
J. Neurosci. 35, 6946–6951 (2015).
8. Tomassy, G. S., Dershowitz, L. B. & Arlotta, P. Diversity matters: A revised guide to myelination. Trends Cell Biol. 26, 135–147
(2016).
9. Brown, T. L. & Verden, D. R. Cytoskeletal regulation of oligodendrocyte differentiation and myelination. J. Neurosci. 37, 7797–7799
(2017).
10. Ronzano, R., Thetiot, M., Lubetzki, C. & Desmazieres, A. Myelin plasticity and repair: Neuro-glial choir sets the tuning. Front.
Cell. Neurosci. 14, 42 (2020).
11. Suo, N., Guo, Y.-E., He, B., Gu, H. & Xie, X. Inhibition of MAPK/ERK pathway promotes oligodendrocytes generation and recovery
of demyelinating diseases. Glia 67, 1320–1332 (2019).
12. Gaesser, J. M. & Fyffe-Maricich, S. L. Intracellular signaling pathway regulation of myelination and remyelination in the CNS. Exp.
Neurol. 283, 501–511 (2016).
13. Davis, R. J. Signal transduction by the JNK group of MAP kinases. Cell 103, 239–252 (2000).
14. Zeke, A., Misheva, M., Reményi, A. & Bogoyevitch, M. A. JNK signaling: Regulation and functions based on complex protein-
protein partnerships. Microbiol. Mol. Biol. Rev. 80, 793–835 (2016).
15. Zhang, Q. et al. Role of Jnk1 in development of neural precursors revealed by iPSC modeling. Oncotarget 7, 60919–60928 (2016).
16. Tararuk, T. et al. JNK1 phosphorylation of SCG10 determines microtubule dynamics and axodendritic length. J. Cell Biol. 173,
265–277 (2006).
17. Chang, L., Jones, Y., Ellisman, M. H., Goldstein, L. S. B. & Karin, M. JNK1 is required for maintenance of neuronal microtubules
and controls phosphorylation of microtubule-associated proteins. Dev. Cell 4, 521–533 (2003).
18. Myers, A. K., Meechan, D. W., Adney, D. R. & Tucker, E. S. Cortical interneurons require Jnk1 to enter and navigate the developing
cerebral cortex. J. Neurosci. 34, 7787–7801 (2014).
Scientific Reports | (2021) 11:7264 | https://doi.org/10.1038/s41598-021-86673-6 13
Vol.:(0123456789)www.nature.com/scientificreports/
19. Björkblom, B. et al. Constitutively active cytoplasmic c-Jun N-terminal kinase 1 is a dominant regulator of dendritic architecture:
Role of microtubule-associated protein 2 as an effector. J. Neurosci. 25, 6350–6361 (2005).
20. Komulainen, E. et al. Impact of JNK and its substrates on dendritic spine morphology. Cells 9, 440 (2020).
21. Kuan, C. Y. et al. The Jnk1 and Jnk2 protein kinases are required for regional specific apoptosis during early brain development.
Neuron 22, 667–676 (1999).
22. Zhang, Y. et al. An RNA-sequencing transcriptome and splicing database of glia, neurons, and vascular cells of the cerebral cortex.
J. Neurosci. 34, 11929–11947 (2014).
23. Jurewicz, A. et al. Tumour necrosis factor-induced death of adult human oligodendrocytes is mediated by apoptosis inducing
factor. Brain 128, 2675–2688 (2005).
24. Pirianov, G., Jesurasa, A. & Mehmet, H. Developmentally regulated changes in c-Jun N-terminal kinase signalling determine the
apoptotic response of oligodendrocyte lineage cells. Cell Death Differ. 13, 531–533 (2006).
25. Qi, M. L. et al. Opposite regulation of oligodendrocyte apoptosis by JNK3 and Pin1 after spinal cord injury. J. Neurosci. 27,
8395–8404 (2007).
26. Zhang, P., Hogan, E. L. & Bhat, N. R. Activation of JNK/SAPK in primary glial cultures: II. Differential activation of kinase isoforms
corresponds to their differential expression. Neurochem. Res. 23, 219–225 (1998).
27. Yandamuri, S.S. & Lane, T.E. Imaging Axonal Degeneration and Repair in Preclinical Animal Models of Multiple Sclerosis. Front
Immunol. 7, 189. https://doi.org/10.3389/fimmu.2016.00189 (2016).
28. Arroyo, E. J. et al. Genetic dysmyelination alters the molecular architecture of the nodal region. J. Neurosci. 22, 1726–1737 (2002).
29. Elazar, N. et al. Coordinated internodal and paranodal adhesion controls accurate myelination by oligodendrocytes. J. Cell Biol.
218, 2887–2895 (2019).
30. Ruff, C. A. et al. Effects of adult neural precursor-derived myelination on axonal function in the perinatal congenitally dysmyeli-
nated brain: Optimizing time of intervention, developing accurate prediction models, and enhancing performance. J. Neurosci.
33, 11899–11915 (2013).
31. Arroyo, E. J., Sirkowski, E. E., Chitale, R. & Scherer, S. S. Acute demyelination disrupts the molecular organization of peripheral
nervous system nodes. J. Comp. Neurol. 479, 424–434 (2004).
32. Girolamo, F. et al. Defining the role of NG2-expressing cells in experimental models of multiple sclerosis: A biofunctional analysis
of the neurovascular unit in wild type and NG2 null mice. PLoS ONE 14, e0213508 (2019).
33. Palanza, L., Jhaveri, S., Donati, S., Nuzzi, R. & Vercelli, A. Quantitative spatial analysis of the distribution of NADPH-diaphorase-
positive neurons in the developing and mature rat retina. Brain Res. Bull. 65, 349–360 (2005).
34. Vercelli, A. E., Garbossa, D., Curtetti, R. & Innocenti, G. M. Somatodendritic minicolumns of output neurons in the rat visual
cortex. Eur. J. Neurosci. 20, 495–502 (2004).
35. Muzzi, P., Camera, P., Di Cunto, F. & Vercelli, A. Deletion of the citron kinase gene selectively affects the number and distribution
of interneurons in barrelfield cortex. J. Comp. Neurol. 513, 249–264 (2009).
36. Borsello, T. et al. A peptide inhibitor of c-Jun N-terminal kinase protects against excitotoxicity and cerebral ischemia. Nat. Med.
9, 1180–1186 (2003).
37. Waetzig, V. & Herdegen, T. Context-specific inhibition of JNKs: Overcoming the dilemma of protection and damage. Trends
Pharmacol. Sci. 26, 455–461 (2005).
38. Repici, M. et al. Time-course of c-Jun N-terminal kinase activation after cerebral ischemia and effect of D-JNKI1 on c-Jun and
caspase-3 activation. Neuroscience 150, 40–49 (2007).
39. Duncan, I. D. et al. A mutation in the Tubb4a gene leads to microtubule accumulation with hypomyelination and demyelination.
Ann. Neurol. 81, 690–702 (2017).
40. Lasser, M., Tiber, J. & Lowery, L. A. The role of the microtubule cytoskeleton in neurodevelopmental disorders. Front. Cell. Neurosci.
12, 165 (2018).
41. Baas, P. W., Rao, A. N., Matamoros, A. J. & Leo, L. Stability properties of neuronal microtubules. Cytoskeleton 73, 442–460 (2016).
42. Kirkpatrick, L. L., Witt, A. S., Payne, H. R., Shine, H. D. & Brady, S. T. Changes in microtubule stability and density in myelin-
deficient shiverer mouse CNS axons. J. Neurosci. 21, 2288–2297 (2001).
43. Vavlitou, N. et al. Axonal pathology precedes demyelination in a mouse model of X-linked demyelinating/type I charcot-marie
tooth neuropathy. J. Neuropathol. Exp. Neurol. 69, 945–958 (2010).
44. Zhang, J. X. et al. JNK Is necessary for oligodendrocyte precursor cell proliferation induced by the conditioned medium from B104
neuroblastoma cells. J. Mol. Neurosci. 52, 269–276 (2014).
45. Potente, M., Michaelis, U. R., Fisslthaler, B., Busse, R. & Fleming, I. Cytochrome P450 2C9-induced endothelial cell proliferation
involves induction of mitogen-activated protein (MAP) kinase phosphatase-1, inhibition of the c-Jun N-terminal kinase, and
up-regulation of cyclin D1. J. Biol. Chem. 277, 15671–15676 (2002).
46. Luedemann, C. et al. Ethanol modulation of TNF-alpha biosynthesis and signaling in endothelial cells: Synergistic augmentation
of TNF-alpha mediated endothelial cell dysfunctions by chronic ethanol. Alcohol. Clin. Exp. Res. 29, 930–938 (2005).
47. Du, L. et al. Inhibition of cell proliferation and cell cycle progression by specific inhibition of basal JNK activity: Evidence that
mitotic Bcl-2 phosphorylation is JNK-independent. J. Biol. Chem. 279, 11957–11966 (2004).
48. Gkouveris, I., Nikitakis, N., Karanikou, M., Rassidakis, G. & Sklavounou, A. JNK1/2 expression and modulation of STAT3 signaling
in oral cancer. Oncol. Lett. 12, 699–706 (2016).
49. Bergles, D. E. & Richardson, W. D. Oligodendrocyte development and plasticity. Cold Spring Harb. Perspect. Biol. 8, 20453 (2016).
50. Temple, S. & Raff, M. C. Clonal analysis of oligodendrocyte development in culture: Evidence for a developmental clock that counts
cell divisions. Cell 44, 773–779 (1986).
51. Durand, B. & Raff, M. A cell-intrinsic timer that operates during oligodendrocyte development. BioEssays 22, 64–71 (2000).
52. Petit, A. et al. Adult spinal cord progenitor cells are repelled by netrin-1 in the embryonic and injured adult spinal cord. Proc. Natl.
Acad. Sci. U. S. A. 104, 17837–17842 (2007).
53. Chew, L. J., Coley, W., Cheng, Y. & Gallo, V. Mechanisms of regulation of oligodendrocyte development by p38 mitogen-activated
protein kinase. J. Neurosci. 30, 11011–11027 (2010).
54. Gaballah, M., Slisz, M. & Hutter-Lobo, D. Role of JNK-1 regulation in the protection of contact-inhibited fibroblasts from oxidative
stress. Mol. Cell. Biochem. 359, 105–113 (2012).
55. Fancy, S. P. J., Chan, J. R., Baranzini, S. E., Franklin, R. J. M. & Rowitch, D. H. Myelin regeneration: A recapitulation of develop-
ment?. Annu. Rev. Neurosci. 34, 21–43 (2011).
56. Wolswijk, G. & Noble, M. Identification of an adult-specific glial progenitor cell. Development 105, 387–400 (1989).
57. Windrem, M. S. et al. Fetal and adult human oligodendrocyte progenitor cell isolates myelinate the congenitally dysmyelinated
brain. Nat. Med. 10, 93–97 (2004).
58. Lin, G., Mela, A., Guilfoyle, E. M. & Goldman, J. E. Neonatal and adult O4+ oligodendrocyte lineage cells display different growth
factor responses and different gene expression patterns. J. Neurosci. Res. 87, 3390–3402 (2009).
59. Barres, B. A., Jacobson, M. D., Schmid, R., Sendtner, M. & Raff, M. C. Does oligodendrocyte survival depend on axons?. Curr. Biol.
3, 489–497 (1993).
60. Barres, B. A. et al. Cell death in the oligodendrocyte lineage. J. Neurobiol. 23, 1221–1230 (1992).
Scientific Reports | (2021) 11:7264 | https://doi.org/10.1038/s41598-021-86673-6 14
Vol:.(1234567890)You can also read