Definition of sinkhole triggers and susceptibility based on hydrogeomorphological analyses - UniFI
←
→
Page content transcription
If your browser does not render page correctly, please read the page content below
Environmental Earth Sciences (2018) 77:4
https://doi.org/10.1007/s12665-017-7179-3

    ORIGINAL ARTICLE

Definition of sinkhole triggers and susceptibility based
on hydrogeomorphological analyses
Emanuele Intrieri1 · Katia Fontanelli1 · Federica Bardi1 · Federico Marini1,2 · Tommaso Carlà1,2 · Veronica Pazzi1 ·
Michele Di Filippo3 · Riccardo Fanti1

Received: 24 May 2017 / Accepted: 14 December 2017 / Published online: 21 December 2017
© The Author(s) 2017. This article is an open access publication

Abstract
Sinkholes represent a geological risk that is often underrated, mainly due to its very localized nature. In fact, sinkholes occur
only under particular circumstances and typically affect relatively small areas. Despite these characteristics, the difficulty in
forecasting the precise location and timing of their sudden collapse creates serious problems for civil protection authorities
and urban planners. In this framework, identifying the mechanism and thus the triggering factor of sinkholes is strategically
pivotal in developing management plans. The present paper addresses the sinkhole-prone area of Il Piano (Elba Island, Central
Italy). The integration of hydrogeological surveys, coupled with a thorough study of historical maps and aerial photographs,
suggests that the main triggering factor in this area may not be related to water pumping from the karst aquifer, as initially
hypothesized. Instead, sinkholes appear to be caused by ravelling and erosive processes occurring entirely in the sedimentary
cover when heavy rainfall induces water overpressure within the superficial aquifer.

Keywords Karst · Hydrogeology · Risk management · Sinkholes

Introduction                                                             deep fractures or faults (Nisio et al. 2007; Caramanna et al.
                                                                         2008). Since the coexistence of such features occurs only in
Sinkholes are natural or anthropogenic ground collapses                  specific regions, the risk of sinkholes is usually focused in
that occur due to a synergy of predisposing and triggering               those areas (called sinkhole-prone areas) but is practically
factors. The causes of sinkholes are often used in sinkhole              null in other regions, unlike other types of geohazards such
classification, although many different classifications exist            as landslides that are much more widespread. The localiza-
(Cramer 1941; Beck and Sinclair 1986; White 1988; Wil-                   tion of sinkholes is one of the reasons why sinkhole risk
liams 2003; Waltham et al. 2005; Gutiérrez et al. 2008;                  awareness is low globally. Sinkhole-prone areas are prob-
Nisio 2008). Predisposing factors are usually the presence               lematic for urban planning, in part owing to this lack of
of underground cavities (for example, related to human exca-             awareness, in part due to the difficulty in finding the precise
vations or to a karst bedrock) under an alluvial cover and               boundaries of the area at risk and the exact location of where
in conditions of groundwater circulation; triggering factors             a sinkhole may occur. For example, modern transportation
usually consist of strong increases in the hydraulic gradi-              networks, especially highways and fast train railways, have
ent, earthquakes (Snyder et al. 1989; Ferreli et al. 2004),              severe restrictions concerning their route and curvature, and
loading (Nisio et al. 2007) and acidic fluid upwelling from              avoiding potentially dangerous areas is a major issue. An
                                                                         inaccurate identification of such areas can result in allow-
* Emanuele Intrieri                                                      ing urbanization over zones at risk or, on the contrary, in
  emanuele.intrieri@unifi.it                                             considering the entirety of the territory as unsuitable for
                                                                         construction.
1
     Department of Earth Sciences, University of Studies                     Since sinkhole forecasting is not a common practice and
     of Florence, via La Pira 4, 50121 Florence, Italy
                                                                         still being researched (Nof et al. 2013; Jones and Blom 2014;
2
     Regional Doctoral School of Earth Sciences, University              Intrieri et al. 2015; Lee et al. 2016), only a detailed hydro-
     of Studies of Florence, via La Pira 4, 50121 Florence, Italy
                                                                         geological study, coupled with underground information,
3
     Department of Earth Sciences, CNR-IGAG, University of La            can help planners delimit the area at risk and identify the
     Sapienza, Piazzale Aldo Moro 5, 00142 Rome, Italy

                                                                                                                             13
                                                                                                                        Vol.:(0123456789)
4   Page 2 of 18                                                                                        Environmental Earth Sciences (2018) 77:4

possible triggering factors, thus enabling the implementation                interferometry; Intrieri et al. 2015) were taken into account
of risk-reduction policies.                                                  but not used for this work.
   In this paper, the possible causes of the sinkholes occur-
ring at Il Piano (Elba Island, Central Italy), where at least
nine events have occurred since 2008, are discussed. A pre-
vious study (Intrieri et al. 2015) focused on addressing this                The case study
issue from a monitoring point of view, but this work did
not include a detailed hydrogeological study of the triggers                 The sinkhole-prone area discussed in this study is located
of the events and, in particular, their relationships with the               in the NE sector of Elba Island (Central Italy), between
water pumping, the rainfall and the aquifer activity (that is,               the Municipalities of Rio nell’Elba and Rio Marina, and is
the scope of the present paper).                                             called Il Piano (The Plain) (Fig. 2).
   In this study, sinkhole research has been developed at                       The Il Piano catchment is characterized by a natural,
different levels. First, a detailed study of historical aerial               narrow pass just upstream of the village of Rio Marina.
photographs and maps, supported by field surveys aimed at                    During the Pleistocene and Holocene, continuous oscil-
assessing the current setting of the area, has been carried out              lations of the sea level caused several cycles of erosion
in order to identify forms (such as circular lakes) possibly                 and sedimentation, as proved by the alternation of lacus-
linkable to past sinkholes and to reconstruct the complex                    trine, fluvial and hillslope sediments. These sedimentary
evolution of the drainage network, in order to contribute to                 layers lie above the bedrock, which consists of the Cavo
the understanding of the trigger mechanisms. These investi-                  Formation (metamorphic shale) in the western part of the
gations, focused on the surface runoff regime, were succes-                  study area and the Rialbano Breccia (formerly defined as
sively integrated with a detailed hydrogeological analysis                   Calcare Cavernoso, that is “cave limestone”; Bortolotti
for characterizing the aquifers, their interactions and their                et al. 2001). The latter is a karst limestone formation that
relations with rainfall and water pumping (Fig. 1). Ground                   constitutes the small reliefs present in this area; the karstic
displacement data (provided by satellite and ground-based                    nature of the rock is evidenced by the presence of natural

Fig. 1  Flowchart of the integrated geological study carried out in the Il Piano area

13
Environmental Earth Sciences (2018) 77:4 Page 3 of 18 4
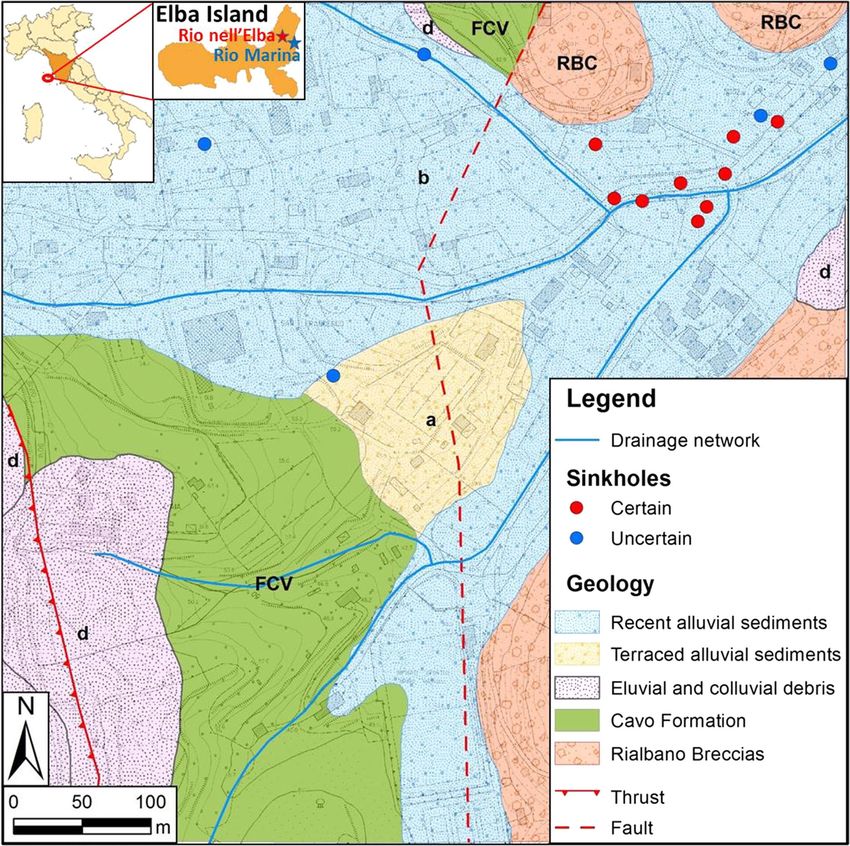
Fig. 2 Geographical and geological framing of the study area. Modified after Bortolotti et al. (2001)
caves, scattered around the eastern part of the island. The Nine sinkholes have been recorded in the easternmost
Cavo Formation overlays the Rialbano Breccia by means part of Il Piano (Intrieri et al. 2015), where the Rialbano
of a tectonic contact. Breccia are overlaid by the alluvial sediments and are in
Drillings and geoelectric studies revealed the high het- close proximity to wells used for providing drinking water
erogeneity of the alluvial sediments, consisting of pre- (Fig. 2). These sinkholes threaten nearby communities and
dominantly very fine sediments (silt to clay) at the base and have already severely damaged an important communica-
coarser sediments shallower (silt to gravel). Within this sedi- tion route, to the extent that a bypass had to be constructed.
mentary cover (which is approximately 10–30 m thick), len- Other sinkhole locations, spread to the westernmost sector
ticular or elongated bodies, constituted by coarse sediments of the plain, have been noted, although they are considered
and attributable to recent and ancient riverbeds, are present. uncertain, since their presence is based on unconfirmed
13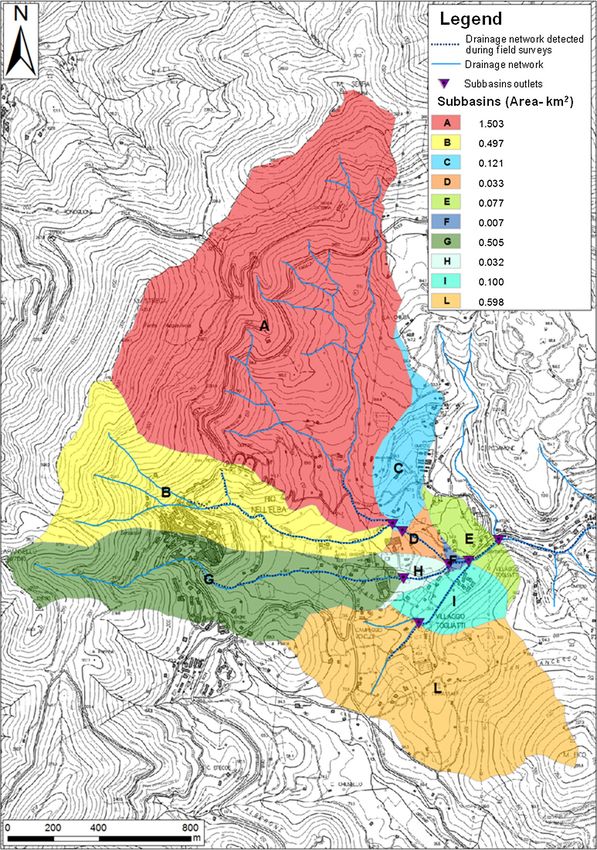
4   Page 4 of 18                                                                               Environmental Earth Sciences (2018) 77:4

reports by locals. Due to the geomorphological restraints           Fig. 3) and supply ditch locations for the hydraulic energy
described above, the road going through the pass represents         mills. In particular, the analysis of the historical cartography
an important route connecting the village of Rio Marina             has enabled the identification (Fig. 3) of a ditch network
and its port to the rest of the island, which is famous for         for the hydraulic energy supply of the watermills; this net-
tourism. In 2013, a sinkhole timely forecasted by Intrieri          work splits from the Mulini stream and flows into the Riale
et al. (2015) led to the disruption of the road pavement and        stream.
to the construction of a bypass that still passes through an           The 1945 and 1954 aerial photographs show that the
area considered at risk. Additionally, dwellings are included       drainage system had not changed very much since the draft-
among the elements at risk.                                         ing of the Grand-ducal Land Registry (Fig. 3); in fact, the
                                                                    ditch network for the hydraulic energy supply of the water-
                                                                    mills is still visible in these images. The 1978 aerial pho-
Assessment of the surface runoff                                    tograph testifies to the urbanization of the area with the
                                                                    construction of Togliatti Village, industrial sheds in the Il
To address all the possible causes of sinkholes, a study of the     Piano locality, tubing of the ditches flowing in these areas
drainage system, both natural and artificial, was carried out.      and enlargement of Provincial Road 26 (Fig. 4). Later aerial
The first part of this study focuses on the analysis of histori-    photographs show that a well field had been built, and indus-
cal maps and aerial photographs, to detect possible signs of        trial buildings had been constructed (Fig. 4).
older sinkholes and to assess the evolution of land use in
the Il Piano area. The second part of this study consists of        Current setting
the characterization of the current surface runoff through
surveys and discharge measurements.                                 Surveys were carried out to assess the actual path of runoff
                                                                    water and to evaluate water infiltration. Discharge measure-
Historical research                                                 ments were performed at different points of the drainage
                                                                    network on the same day (13 April 2016), after the rainy sea-
Milling had occurred in the Il Piano area (which is, in fact,       son. Due to the shallowness of the streams, a current metre
also called Valle dei Mulini, i.e. watermills valley) from the      could not be used; therefore, measurements were performed
second half of the sixteenth century until the 1950s. The           by deriving the channel cross-section and by calculating the
word “Rio” within the name of the towns themselves can              stream flow velocity from the time required to float a known
be translated as “stream”, denoting that a significant water        distance along a regular section of the stream. When pos-
discharge existed in the past but is no longer observable. The      sible, the discharge was instead measured with a graduated
presence of 22 watermills in total, as well as millponds and        bucket. In either case, at least 5 measurements were per-
ditches that supplied water for hydraulic energy, is docu-          formed, and the average of those measurements was calcu-
mented (Pierotti 1993), and their ruins are still largely visible   lated; measurements that clearly deviated from the typical
(although at different states of conservation). The hydraulic       range of the observed values were discarded and not used to
setting during the last two centuries has been reconstructed        compute the average.
by analysing historical cartography (French Land Registry,              Given the high variability in the discharges during the
1802–1803; Grand-ducal Land Registry 1840; topographic              year, the measurements were not aimed at identifying a rep-
map of Elba Island 1895) and aerial photographs (1945,              resentative value; instead, they were used to evaluate the per-
1954, 1978, 1988, 1990, 1994, 1996, 2012) (Figs. 3, 4). The         centage of water lost due to infiltration or instead collected
cartography is derived by CASTORE (2016), the 1945 pho-             within in the upstream drainage basin. Evapotranspiration
tograph is from IGM (2016), and the other data are from the         within the riverbeds is considered negligible given the short
Tuscany Region (2016).                                              length of the streams.
   This historical analysis does not show the presence of               Figure 5 depicts the findings of the survey performed
geomorphological features that could be related to the occur-       on 13 April 2016, representing intermediate conditions
rence of previous sinkhole events (for instance, circular or        between the dry season and the maximum discharge (wet
subcircular lakes, depressions, and damp areas). The French         season). The blue lines indicate those tracts where a flux
Land Registry and Grand-ducal Land Registry (Fig. 3) show           was observed and measurable, indicating a semi-permanent
the same watermills, millponds and ditches; the slight dis-         (i.e. at least seasonal) flux. The green lines are those tracts
crepancies between the two registries are related to the low        where flux is present only occasionally, after consistent
georeferencing precision of ancient charts. These two charts        rainfall. The dashed red lines indicate artificial channels,
show the same stream patterns (the Mulini stream origi-             which in some cases are buried but are still easily detect-
nating from the Cinque Bocche spring, Riale stream, San             able because they are marked by belts of reed or visible
Giuseppe stream, Chiusa stream and Giudimente stream;               through open manholes. These channels correspond to those

13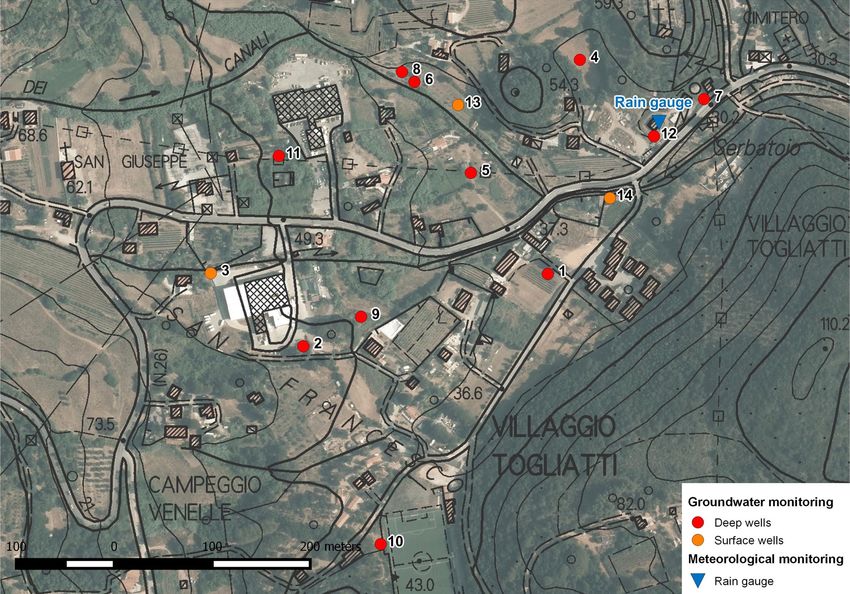
Environmental Earth Sciences (2018) 77:4                                                                                               Page 5 of 18 4

Fig. 3  Evolution of the drainage system and land use shown on the 1840–1841 Grand-ducal Land Registry (top, CASTORE 2016) and on the 1954 aerial photo-
graph (bottom, IGM 2016; Tuscany Region 2016)

                                                                                                                                           13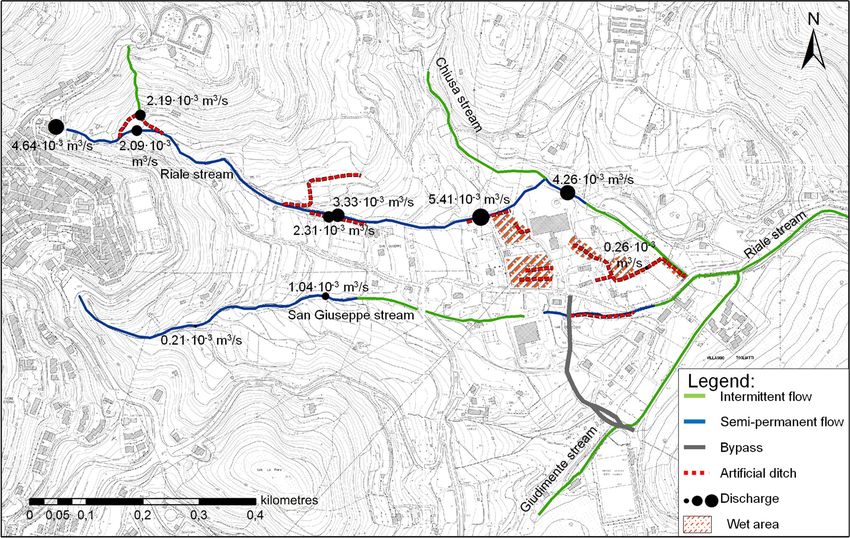
4   Page 6 of 18                                                                                                  Environmental Earth Sciences (2018) 77:4

Fig. 4  Evolution of the drainage system and land use shown on the 1978 (top) and 2012 (bottom) aerial photographs (IGM 2016; Tuscany Region 2016)

13
Environmental Earth Sciences (2018) 77:4 Page 7 of 18 4
Fig. 5 Map of the discharges measured on 13 April 2016. The diameter of each of the black dots is proportional to the measured discharge at
that location
detected through the historical research (Fig. 5) with only tens of metres. On the other hand, the flux within the channels
a few modern additions, while many tracts are no longer continues, although with small discharge values (see the small
used nor visible. The areas in Fig. 5 filled by orange dashed black dot within the red dashed line on the right part of Fig. 5,
lines are wet and marshy areas, revealing diffuse infiltration corresponding to a measured discharge of 0.26 × 10⁻³ m3/s),
and an ineffective draining; the black dots show where the until it flows into the Riale riverbed and disappears.
discharge measurements were performed, and the diameter The San Giuseppe stream is characterized by a lower,
of the dot is proportional to the measured value. although increasing, discharge than that of the Riale stream.
The flux measured at Cinque Bocche (4.64 × 10⁻³ m3/s, Interestingly, for a certain tract, the flow disappears and prob-
Fig. 5) is then diverted into two separate channels: the stre- ably continues as hypodermic flow, since it emerges again after
ambed is deflected by a domestic change to irrigate a vegetable a few tens of metres. The water infiltrates definitively further
garden (measured discharge of 2.19 × 10⁻³ m3/s) and then downstream.
redirected back into the riverbed. Proceeding downstream, For both streams, the water infiltrates in an area where the
other channels or pipes intercept the water that flows parallel to tectonic contact between the Cavo Formation and Rialbano
the riverbed. Summing the discharge measured in the riverbed Breccia occurs, under the sedimentary cover. This observation
and in the channel at the same location, it is noted that the total would indicate that the lithology or man-made buried channels
discharge does not vary with that measured at Cinque Bocche, control the surface runoff, as infiltration increases over a more
but the stream flow measured within the riverbed increases permeable medium.
with respect to that measured in the channel. Further down-
stream, the superficial water flux of the Riale stream ceases
to exist (corresponding to the green line), as it quickly infil-
trates. This phenomenon does not always occur in the same
location; for example, in the spring, it was observed that the
point where the stream disappears could change within a few
13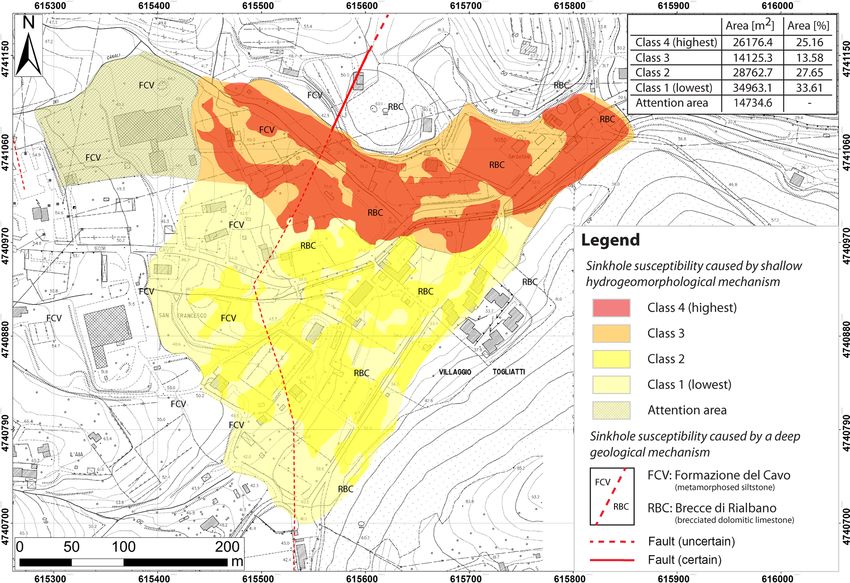
4   Page 8 of 18                                                                                     Environmental Earth Sciences (2018) 77:4

Hydrogeological study                                                   June 2016 were identified. For the definition of a rainfall
                                                                        event, a similar approach to that used by Del Ventisette et al.
Given the influence of groundwater on sinkhole formation,               (2012) was adopted. The beginning of an event was defined
a detailed hydrogeological study was carried out. This study            as a day recording any value higher than 0 mm of rainfall,
mainly aimed to accomplish the following:                               and the ending was considered to be when the total pre-
                                                                        cipitation recorded was equal to or lower than 0.2 mm for at
• acquiring data concerning the variation in the piezomet-              least 48 h. By using this approach, 36 events (correspond-
    ric level, in relation to water pumping and rainfall;               ing to 432.6 mm during 107 rainy days) were detected at
• defining a conceptual hydrogeological model identifying               Portoferraio, while 24 (corresponding to 266.8 mm during
    the existing aquifers, their characteristics and interrela-         98 rainy days) were detected at Rio Marina. The rain gauge
    tions.                                                              installed in Portoferraio consistently recorded longer and
                                                                        more intense rainfall than the one in Rio Marina (Fig. 6).
                                                                        Considering only the events in common between the two
                                                                        stations, a ratio between the precipitation measured at
Rainfall data                                                           Portoferraio and at Rio Marina has been calculated for each
                                                                        event. On average, this ratio is 1.16. The good correlation
On 16 October 2015, a meteorological station equipped with              between data is proved also by a correlation coefficient R2
a rain gauge, thermometer and anemometer was installed                  equal to 0.92 (obtained without considering two outliers, as
close to well no. 12, within the Rio Marina territory. This             discussed below).
meteorological station experienced a few interruptions of                  Some of the days that the Rio Marina rain gauge was
activity over a total of 36 days: 22 October 2015, from 30              not operating occurred during dry periods (as confirmed by
December 2015 to 27 January 2016, 29 February 2016, 5–8                 the station in Portoferraio). For the remaining days, missing
April 2016 and 11 June 2016. To integrate the missing data,             data have been integrated by using the Portoferraio data and
the data from this station were correlated with the precipita-          assuming a 1.16 ratio. This resulted in a further 89.8 mm
tion measurements gathered by the rain gauge in Portoferraio            that was added to the Rio Marina dataset and evenly distrib-
(located approximately 10 km away from the study area).                 uted among the days of inactivity.
   To this aim, all the rainfall events that occurred in Rio               The comparison between the precipitation measured in
Marina and Portoferraio between 16 October 2015 and 19                  Portoferraio and Rio Marina also highlighted the occurrence

Fig. 6  Daily rainfall measured at the Portoferraio and Rio Marina rain gauges. In the inset graph, the same data with a different scale are
reported, in order to include the highest values

13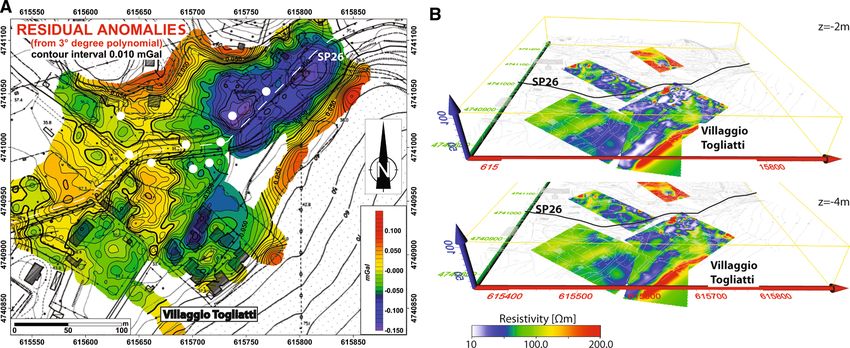
Environmental Earth Sciences (2018) 77:4                                                                                           Page 9 of 18 4

of two particularly interesting events (previously defined                     Based on Fig. 8, the existence of two separate aquifers
as “outliers”), which occurred during the periods 16–19                     can be distinguished. The superficial aquifer is identifiable
October 2015 and 27–29 October 2016 in Rio Marina and                       by the water level in well no. 13. Between October 2015
lasted for one additional day in Portoferraio. The intensities              and June 2016, the superficial aquifer displayed little varia-
of these two events were, respectively, 82.4 and 151.2 mm                   tion (equal to 0.7 m). On the other hand, the deeper aquifer
in Rio Marina, while in Portoferraio they were 15.6 and                     showed a maximum variation of 4.5 m. During the days
38.8 mm. Therefore, despite the fact that Rio Marina gener-                 when the wells used for extracting drinking water were not
ally appears to experience slightly less intense precipita-                 operated, the deeper aquifer reached its maximum piezo-
tion than that at Portoferraio, Rio Marina can suffer from                  metric level. The start of pumping from well no. 9 caused a
very localized, short and strong rainfall that do not affect                gradual decrease of approximately 1 m, eventually leading
Portoferraio.                                                               to a stable water level.
                                                                               The piezometric level recorded by the datalogger with
Piezometric monitoring                                                      an acquisition frequency of 30 min enabled a comparison
                                                                            of that data with the rainfall data. It can be noted that the
Monitoring consisted of the manual measurement of the                       groundwater level increase is directly related to the rainfall
water level within all the measurable wells in the Il Piano                 events (Fig. 9), with a time lag of roughly 3 days.
area (Figs. 7, 8). In addition, well no. 5 was also auto-
matically monitored through a datalogger (CTD-Diver by                      Characterization of the deeper aquifer
Schlumberger Water Services) coupled with a barometer to
compensate for the effect of the air pressure (Baro-Diver by                To assess the features of the deeper aquifer, a pumping test
Schlumberger Water Services) (Fig. 9).                                      and a recovery test were executed in well no. 12, which

Fig. 7  Location of all the wells in the Il Piano area. The position of the Rio Marina rain gauge is also shown. Wells no. 3 and 14 were dry, while
data could not be measured from wells no. 6 and 11 due to accessibility or damage to the well tubing

                                                                                                                                      13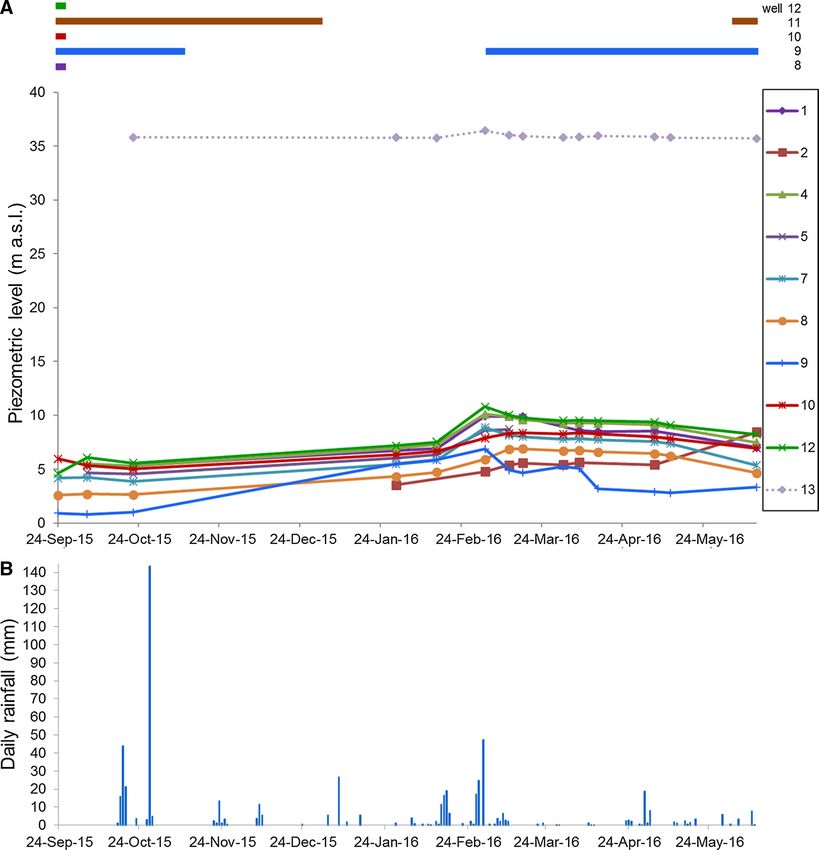
4   Page 10 of 18                                                                                        Environmental Earth Sciences (2018) 77:4

Fig. 8  a Piezometric levels of all the measurable wells in the Il Piano   Daily rainfall measured at the Rio Marina rain gauge, integrated as
area for the period 24 September 2015–10 June 2016; the numbers            described in the text; note that the measurements started on 16 Octo-
indicate the respective wells. The periods when the wells used for         ber 2015
drinking purposes were active is indicated at the top of the graph. b

was equipped with a 13 kW pump placed 65 m below the                       • fractured dolomitic limestone (from − 13 to − 55 m,
wellhead. The test started on 22 October 2015. During                         called the Rialbano Breccia), and
the test, the piezometric level was monitored both in well                 • quartz phyllites (from − 55 to − 100 m, called the Ver-
no. 12 and in well no. 7, which was 60 m to the NE. The                       rucano Formation).
stainless steel well tubing is 0.219 m wide. The filters are
placed between − 35 and − 47 m and between − 53 and                           The results of the tests are shown in Tables 1 and 2,
− 59 m below ground level.                                                 where s is the lowering of the piezometric level measured
   The stratigraphy of the well consists of:                               in well no. 7 and defined as the difference between the
                                                                           level measured at the beginning of the test and that meas-
• alluvial sediments (from 0 to − 13 m),                                   ured at time t.

13
Environmental Earth Sciences (2018) 77:4 Page 11 of 18 4
Fig. 9 Comparison between the
daily rainfall and the piezomet-
ric level of well no. 5 measured
with the datalogger
Table 1 Lowering values (s) of t (s) s (m) t (s) s (m) Geophysical characterization
the piezometric level measured
at time t during the pumping 0 0.000 1800 0.160
test Non-invasive high-resolution geophysical methods are com-
120 0.020 3000 0.240 monly accepted as the best approach to identify and map
240 0.040 6000 0.270 local subsurface heterogeneities such as sinkholes (Butler
480 0.060 10,800 0.360 1984; Piro et al. 2001; Ezersky 2008; Cardarelli et al. 2014;
900 0.090 70,500 0.660 Giampaolo et al. 2016). Natural cavities, in fact, may be
filled with water, air or collapsed/unconsolidated material
and therefore provide distinct geophysical contrasts. Select-
ing the appropriate geophysical methods depends on the
main parameters of interest (e.g. depth of investigation,
Table 2 Lowering values (s) of the piezometric level measured at resolution, or diagnostic capability), on the consideration
time t during the recovery test of a number of intrinsic limitations and ambiguities and on
t (s) s (m) t (s) s (m) t (s) s (m) the cost-to-time ratio (Ezersky 2008; Cardarelli et al. 2014;
Pazzi et al. 2016, 2017a). To characterize the study area
70,500 0.660 70,770 0.630 72,300 0.540
and delineate the Il Piano sinkhole-prone area, the follow-
70,530 0.660 70,800 0.630 72,900 0.525
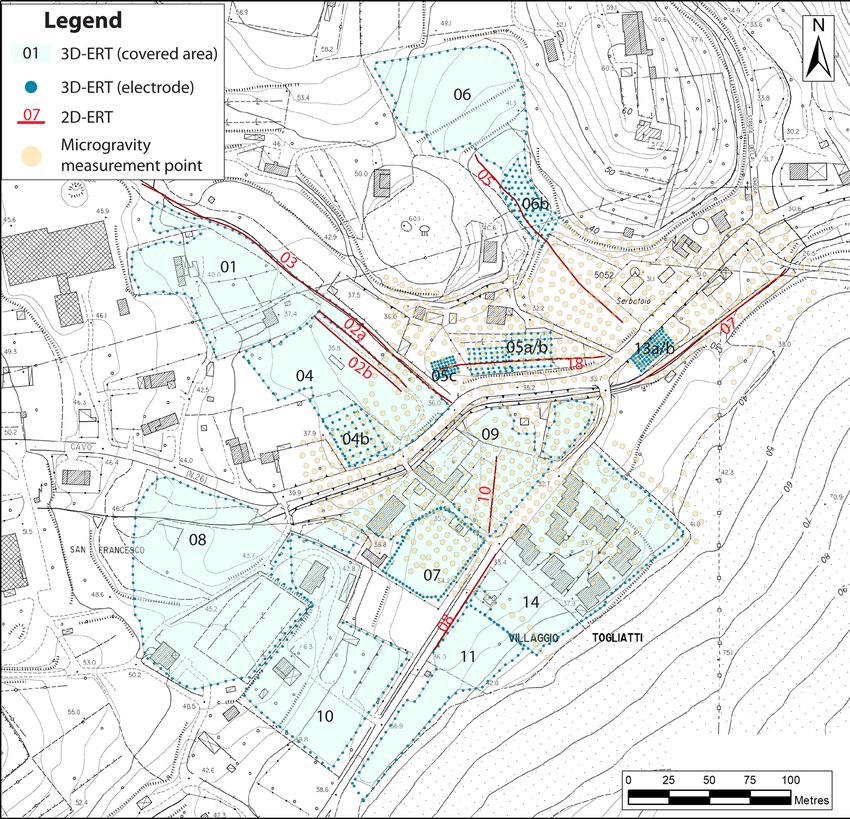
ing activities were performed (Fig. 10): (a) a microgravity
70,560 0.660 70,860 0.620 73,500 0.500
survey with 964 measurements to detect subsuperficial caves
70,590 0.655 70,920 0.620 74,100 0.480
(Butler 1984; Bishop et al. 1997; Argentieri et al. 2015; Di
70,620 0.650 70,980 0.610 75,300 0.440
Nezza et al. 2015) in primarily the inhabited areas and the
70,650 0.645 71,040 0.610 76,500 0.415
ground along the two main roadways; (b) 8 2D electrical
70,680 0.640 71,100 0.605 77,700 0.390
tomographies (2D-ERT) and 13 3D-ERT to characterize the
70,710 0.635 71,400 0.560 81,300 0.340
heterogeneity of the sediments and to derive the geometry
70,740 0.635 71,700 0.570 90,300 0.250
of the aquifers and/or aquicludes (Giampaolo et al. 2016;
Pazzi et al. 2016); and (c) 120 single-station seismic noise
measurements (H/V technique) to gain insight into the thick-
ness of the alluvial sediment cover (Lane et al. 2008; Lotti
et al. 2015; Del Soldato et al. 2016; Pazzi et al. 2017b). The
By using these data and the Cooper–Jacob approxima- geophysical measurements were calibrated with respect to
tion (Cooper and Jacob 1946), it is possible to calculate the subsoil data obtained from the borehole logs collected
the transmissivity T of the aquifer as 6.7 × 10⁻³ m2/s. along the SP26 road after the 2013 sinkhole.
134 Page 12 of 18 Environmental Earth Sciences (2018) 77:4 Fig. 10 Location of the geophysical surveys at Il Piano: microgravity measurements (orange dots), 2D-ERT (red lines) and 3D-ERT (light blue dots mark the location of the electrodes, while the light green areas delimit the extension of the areas effectively investigated) A LaCoste & Romberg model D gravimeter (sensitiv- 1 m; max electrode spacing: 5 m). ERT inversions were per- ity of 5 μGal) was used for the microgravity survey in the formed by the commercial software ErtLab (Geostudi Astier study area. The gravity was estimated relative to the gravity srl, Multi-Phase Technologies LLC). The single-station seis- of the Santa Barbara church in the village of Rio Marina mic noise measurements were collected by means of five and to altitude measurements by the IGM (Italian Military Tromino: each acquisition ran for 30 min at 256 Hz, and Geographic Institute) at benchmark no. 126902 at the San the data were elaborated according to the SESAME (2004) Pietro church in Rio nell’Elba. The Bouguer gravity anomaly standard by the commercial software Grilla (Pazzi et al. was calculated with both the polynomial fitting approach 2017a, b). and Griffin’s technique (1949). The 2D- and 3D-ERTs were The results (Fig. 11) showed that the main negative collected by means of a SyscalPro georesistivimeter (IRIS microgravity anomalies in the study area are located in sec- Instrument) with a pole–dipole array (min electrode spacing: tors affected by collapse (white dots in Fig. 11). The whole 13
Environmental Earth Sciences (2018) 77:4                                                                                  Page 13 of 18 4

Fig. 11  a Residual anomalies (mGal) calculated by a third-order pol-   geoelectric results at different depths below ground level (− 2 and
ynomial fitting. The white dashed line is the SP26, while the white     − 4 m). The black line is the SP26
dots are the sinkholes reported in the literature. b 2D slice of the

area is characterized by a generally increasing trend in nega-          is affected by limited oscillations. The lower bound of the
tive anomalies from the SW to the NE, with a spatial dis-               aquifer is clay, as evidenced by drillings.
tribution that suggests a complex geological setting. These                A deeper unconfined aquifer is located within the Rial-
negative anomalies could be associated with the presence of             bano Breccia and is characterized by secondary poros-
lenticular gravel and sand bodies within a sandy silt matrix,           ity caused by karst processes, possibly favoured by acidic
highlighted by the ERT results as non-homogeneous high-                 water (given the presence of pyrite mines on the hills bor-
and low-resistivity anomalies. Finally, the geoelectric inves-          dering the Il Piano area). This aquifer is largely exploited
tigation of the subsurface confirmed that the area has a mean           for drinking water. The pumping activity and rainfall pro-
resistivity value within the resistivity range of the Quater-           duce moderate variations in the groundwater level (Figs. 8,
nary alluvial deposits, and the H/V measurements indicated              9); this implies a large extension of this aquifer, probably
that the thickness of the valley replenishment material is              reaching outside of the Il Piano area and catchment basin.
between 10.5 and 35 m. The ERT results also permit the                  The average depth of this groundwater table is approxi-
delimitation of the gravel and sand bodies in the SW portion            mately 30 m, which is deeper than the top of the Rialbano
of the area surveyed by microgravity; in this area, the posi-           Breccia formation, which is therefore not saturated. As
tive anomalies are probably caused by the road.                         a result, it is inferred that the two aquifers do not com-
   In conclusion, the integrated geophysical surveys showed             municate; this inference was confirmed by the monitoring
that the anomalies, interpreted as gravel and sand bodies, (a)          of the water levels (Fig. 8), showing that the superficial
are mainly located along or on riverbeds, or where the mill             water table is not affected by the oscillations (both caused
pools used to be located, (b) are connected to each other               by natural or anthropic factors) experienced by the deeper
by persistent channels and (c) are in agreement with the                one. Therefore, the sinkholes that formed were not deep
hydraulic system of the original natural waterways; further-            enough to reach the bedrock (as confirmed by observation)
more, (d) the younger streams are superimposed on an older              and interconnect the aquifers.
hydrological system, which has been covered by anthropo-                   Despite the presence of a karst bedrock and active water
genic activity.                                                         pumping activities, the abovementioned observations sug-
                                                                        gest that the events occurred in Il Piano area may not be
                                                                        attributed to cover collapse sinkholes (that is, sinkholes
Discussion of the results                                               caused by underground cavities and triggered by water
                                                                        pumping that induced piping in the sedimentary cover). In
Within a few metres of the superficial sedimentary                      fact, although this mechanism surely cannot be completely
cover, an unconfined aquifer exists and has been scarcely               excluded, the independence between the two aquifers sug-
exploited. The groundwater level is at a shallow depth and              gests, in this case, that a different process might occur

                                                                                                                               13
4 Page 14 of 18 Environmental Earth Sciences (2018) 77:4 entirely within the sedimentary cover and produce ravelling occurred within subbasins D and H. These areas drain the sinkholes, as explained in detail below. largest part of the total catchment area of Il Piano. This Concerning the surface runoff, the surveys evidenced the model explains why the southern part of the region (which presence of several ephemeral or intermittent streams, and drains only subbasins I and L) has not been affected by in particular, of water flowing subsuperficially or infiltrating sinkholes yet, despite the presence of active wells and bur- and then emerging again in a channelized or diffuse fash- ied riverbeds (for example those related to the Giudimente ion. Such a condition is partially due to a drainage network stream, see Fig. 5). The same reasoning can be applied to that has been complicated by an intricate system of artifi- explain why the upstream areas of the plain are also unaf- cial channels and millponds (partially underground), created fected by such events, which are instead all located within to serve 22 mills gathered in a small area (Pierotti 1993). a relatively small portion of the territory (areas H, F, E), These structures have been gradually abandoned over the where the drained water converges into a narrow section. last 150 years, especially since the second half of the twen- To interpret the trigger of the sinkhole phenomena at Il tieth century, causing the concealment, damage or oblitera- Piano and to delimit and characterize the sinkhole-prone tion of the existing system and a disorganized evolution and areas into zones (Fig. 13), (a) the 3D spatial distribution of alteration of the drainage network owing to the rapid growth the microgravity and electrical anomalies, (b) the hydroge- of infrastructures and industrial facilities and to the uncon- omorphological data derived from water level monitor- trolled water diversions for domestic purposes (Figs. 3, 5). ing and (c) an accurate historical reconstruction of the The presence of buried channels contributes to the under- urban and environmental development in the area were ground heterogeneity of ancient riverbeds and different sedi- integrated. This led to the definition of four zones (light mentary bodies, characterized by different permeabilities, yellow, yellow, orange and red) characterized by increas- that were detected through drillings and geophysical inves- ing susceptibility to sinkholes. tigation. Therefore, the observed infiltration phenomena are As shown in Fig. 12, the whole hydrographic basin has likely to occur within these natural bodies and old channels. been divided in subbasins, and without taking into account Although this infiltration may not have consequences during the deeper groundwater flows, the northern portion of Il dry periods, it may cause a turbulent (and, in some cases, Piano (subbasins A-H) collects 79.9% of the superficial pressurized) flow in response to strong rainfall events, which and subsuperficial water, while the southern part collects have been observed in the area (Fig. 6). This process may only 20.1%. cause erosion and piping entirely within the sedimentary This information has been transposed into a susceptibil- cover, possibly leading to the eventual formation of small ity map (Fig. 11) and is the reason why the northern part cavities, similar to that explained by Higgins and Schoner of the area is generally characterized by a higher suscep- (1993) and Strini (2004). Higgins and Schoner (1993), in tibility (orange or red). The precise shapes of the coloured particular, described the formation of 2–3-m-wide sinkholes areas are drawn following critical lithologic bodies that resulting from piping in silty clay fans laced with intersect- have been traced from the microgravimetry and geoelectric ing strings of permeable sand and gravel. These sand and surveys and the reconstruction of old riverbeds or man- gravel strings are surrounded by less permeable sediments made buried channels. For example, in the southern part of that are cohesive enough to maintain the pipe walls but are the map (generally characterized by lower susceptibility), also capable of dispersing into separate grains that the inflow the areas with relatively higher susceptibility (yellow) cor- can entrain and remove (Dunne 1990). Interestingly, these respond to the Giudimente stream (identified through the processes occur in a region where piping never exists. surface runoff and historical analyses and then precisely In the case of the Il Piano area, discharge and disposal of delimited thanks to the geoelectric surveys; see Figs. 3, the entrained sediment may occur within the loose, coarse 5, 11), where permeable sediments allow faster under- sediment bodies (Marr 1955; Higgins and Schoner 1993), ground water flow, which can trigger ravelling processes. cracks, riverbeds and buried channels or karst cavities of The identification of this buried riverbed (red area in the the Rialbano Breccia, which, in this case, would play only a geoelectric tomography of Fig. 11) permitted the calibra- passive role in the formation of sinkholes. tion of the interpretation of the geoelectric surveys and In this framework, the most susceptible areas are those determination of the localization of other bodies across where permeable underground bodies experience a rela- the site that were then mapped. In the northern portion of tively fast water flow, favoured by the extension of the the map, where the microgravimetric measurements were drained area that may induce possible overpressure. There- focused, the delimitation of the most susceptible areas fol- fore, Il Piano has been subdivided into smaller catchments lowed an intersection between areas with negative gravity (Fig. 12). The northern basins drain a much larger area. anomalies (indicating possible voids or less compacted All the ascertained (and two uncertain) sinkholes occurred sediments; see green and blue areas in Fig. 11) and per- within subbasins E and F, and 3 unconfirmed sinkholes meable bodies, such as natural or man-made channels 13
Environmental Earth Sciences (2018) 77:4                                                      Page 15 of 18 4

Fig. 12  Subbasins and their respective outlets located upstream of the sinkhole-prone area

                                                                                                  13
4 Page 16 of 18 Environmental Earth Sciences (2018) 77:4
Fig. 13 Sinkhole susceptibility map: colours from red (class 4–high- areas (m2 and percentage) is listed in the table. The rock substratum
est susceptibility) to light yellow (class 1–lowest susceptibility) is indicated as either FCV (Formazione del Cavo) and RBC (Brecce
indicate the areas where sinkholes could occur because of shallow di Rialbano)
hydrogeomorphological mechanisms. The extension of the different
(identified through geoelectric surveys and historical and soil lenticular bodies, and the hydraulic load is limited
surface runoff analyses). (southern subbasin).
Consequently, the following four classes of susceptibil-
ity have been mapped (Fig. 13): Finally, outside the sinkhole-prone zone an “attention
area” (Fig. 13) has been indicated: this area is characterized
• Red Area—Class 4: covers 25.16% of the area and is by poor management of the superficial waters. Taking into
the most prone to sinkholes because of the presence account the location of this area (within the northern hydro-
of subsoil lenticular bodies and a high hydraulic load graphic subbasin, above old milling features and close to the
(northern subbasin). sinkhole-prone areas), in the absence of corrective measures,
• Orange Area—Class 3: in 13.58% of the area, the inte- sinkholes may develop in the future.
grated geophysical surveys did not identify any subsoil
lenticular bodies, but the hydraulic load is very high
(northern subbasin). Conclusions
• Yellow Area—Class 2: in 27.65% of the area, the inte-
grated geophysical surveys identified subsoil lenticular The Il Piano region has been affected by a series of sink-
bodies, and the hydraulic load is limited (southern sub- holes localized within a small area. The study of histori-
basin). cal maps and aerial photographs has not identified possible
• Light Yellow Area—Class 1: in 33.61% of the area, the forms ascribable to older sinkholes, although the occurrence
integrated geophysical surveys did not identify sub- of past and undiscovered events cannot be excluded. Field
13Environmental Earth Sciences (2018) 77:4 Page 17 of 18 4
surveys and historical research highlighted the presence of the subbasins) and anthropogenic (the presence of buried
a complex network of artificial ditches used to power water channels). The triggering factors are rainfall events that,
mills until the middle of the twentieth century. Because of as described above, can be intense. Uncontrolled domestic
the fast development of the study area, these channels are water diversions or inflows and a poorly maintained natural
now abandoned if not disrupted, although they still consti- and artificial drainage network aggravate the sinkhole risk.
tute an important drainage network capable of diverting sig-
nificant quantities of water, often at a subsuperficial level. Acknowledgements The authors are grateful to Brilli Mirco, Claudio
Benucci, Maurizio Micheli, Fabio Baldi, Michele Muti and Massimo
Hydrogeological tests and monitoring showed that the Caldori of the ASA s.p.a., the society responsible for the drinking water
region is characterized by two unconfined, non-communi- on Elba Island, for allowing piezometric monitoring and pumping tests
cating aquifers separated by an impermeable layer of pre- in their wells. We also wish to thank Lorenzo Giardi and Niccolò Galfo
dominantly clay. The upper aquifer is scarcely exploited and for their fieldwork support.
is identified within a heterogeneous sedimentary cover with
Open Access This article is distributed under the terms of the Creative
permeable bodies (corresponding to ancient riverbeds and Commons Attribution 4.0 International License (http://creativecom-
buried ditches) and finer and more cohesive sediments. The mons.org/licenses/by/4.0/), which permits unrestricted use, distribu-
deeper aquifer is more heavily exploited and is found within tion, and reproduction in any medium, provided you give appropriate
the karst limestone of the Rialbano Breccia. The extension credit to the original author(s) and the source, provide a link to the
Creative Commons license, and indicate if changes were made.
and permeability of this aquifer are such that the lowering
of the water table is limited in both depth and areal extent
and, most importantly, does not affect the upper sedimentary
cover. For this reason, a cover collapse mechanism in which References
the sediments are drawn into karst cavities due to an increase
in the hydraulic gradient cannot be considered likely. Argentieri A, Carluccio R, Cecchini F, Chiappini M, De Ritis R, Di
As a consequence, the triggering mechanism was associ- Filippo M, Di Nezza M, Marchetti M, Margottini S, Materni V,
Meloni F, Nardi A, Rotella G, Sapia V, Venuti A (2015) Early
ated with superficial processes that involve a relatively fast
stage sinkhole formation in the Acque Albule basinof central
and possibly pressurized water flow within buried but shal- Italy from geophysical and geochemical observation. Eng Geol
low permeable bodies, which cause ravelling and erosion of 191:36–47. https://doi.org/10.1016/j.enggeo.2015.03.010
the finer sediments and may eventually evolve into small and Beck BF, Sinclair WC (1986) Sinkholes in Florida: an introduction.
Florida Sinkhole Research Institute Report, pp 85–86
sudden sinkholes entirely localized within the deposits. The
Bishop I, Styles P, Emsley SJ, Ferguson NS (1997) The detection of
removed material can then be transported through the loose cavities using the microgravity techniques: case histories from
sediments and cracks and end up in the riverbeds of nearby mining and karstic environments. Eng Geol Spec Publ 12:153–
streams or in deeper karst cavities. Therefore, the karst bed- 166. https://doi.org/10.1144/GSL.ENG.1997.012.01.13
Bortolotti V, Fazzuoli M, Pandeli E, Principi G, Babbini A, Corti S
rock plays a passive role, if any. It is thought that the occur-
(2001) Geology of Central and Eastern Elba Island, Italy. Ofioliti
rence of fast, pressurized water flows is due to heavy rainfall 26(2a):97–150
events and especially to the extension of the subbasins of Butler DK (1984) Microgravimetric and gravity gradient techniques
the Il Piano catchment. In particular, the northern subbasins for detection of subsurface cavities. Geophysics 49:1084–1096
Caramanna G, Ciotoli G, Nisio S (2008) A review of natural sinkhole
are characterized by large areal extents and short and nar-
phenomena in Italian plain areas. Nat Hazards 45(2):145–172
row streams; given the documented infiltration process, it Cardarelli E, Cercato M, De Donno G, Di Filippo G (2014) Detection
is hypothesized that subsuperficial ravelling processes may and imaging of piping sinkholes by integrated geophysical meth-
occur mainly downstream of the larger basins. This hypoth- ods. Near Surface Geophys 12:439–450
CASTORE Project, Tuscany Region and State Archives of Tuscany
esis corresponds to the observation of the locations of the
(2016) Available online: http://web.rete.toscana.it/castoreapp
sinkholes and explains why no sinkholes have been recorded Cooper HH, Jacob CE (1946) A generalized graphical method for
yet in the southern part of the region, where the geologi- evaluating formation constants and summarizing well field his-
cal conditions and water pumping activities are basically tory. Am Geophys Union Trans 27:526–534
Cramer H (1941) Die Systematik der karstdolinen. Neues Jahrbuch
equivalent to the northern part of the region. According to
für Mineralogie, Geologie und Palaontologie 85:293–382 (In
this conceptual model, a sinkhole susceptibility map was German)
produced for the area. Del Soldato M, Segoni S, De Vita P, Pazzi V, Tofani V, Moretti S
Although the occurrence of cover collapse sinkholes (2016) Thickness model of pyroclastic soils along mountain slopes
of Campania (southern Italy). In: Aversa et al (eds) Landslides and
directly involving water pumping and karst cavities cannot
engineered slopes. Experience, theory and practice. Associazione
be completely excluded, it must be considered a secondary Geotecnica Italaiana, Rome, Italy. ISBN:978-1-138-02988-0
mechanism. Del Ventisette C, Casagli N, Fortuny-Guasch J, Tarchi D (2012) Ruinon
All considered, the predisposing factors identified in landslide (Valfurva, Italy) activity in relation to rainfall by means
of GBInSAR monitoring. Landslides 9(4):497–509
this work are geological (related to the presence of het-
erogeneous deposits), geomorphological (the extension of
134 Page 18 of 18 Environmental Earth Sciences (2018) 77:4
Di Nezza M, Cecchini F, Margottini S, Di Filippo M (2015) Deeper Nisio S (2008) I sinkholes: problemi terminologici, meccanismi genet-
geological and structural settings of Acque Albule Basin (Rome, ici, classificazione. In: Nisio S (ed) Memorie descrittive della
Latium). 3° Workshop internazionale: Voragini in Italia. I Sink- carta geologica d’Italia LXXXV, pp 17–32 (In Italian)
holes e le cavità sotterranee: ricerca storica metodi di studio e Nisio S, Caramanna G, Ciotoli G (2007) Sinkholes in Italy: first
d’intervento. Roma 8 Maggio 2014, Roma. Mem. Descr. Carta results on the inventory and analysis. Geol Soc Lond Spec Publ
Geol. It, pp 267–272. ISSN: 0536-0242 279:23–45
Dunne T (1990) Hydrology, mechanics, and geomorphic implications Nof RN, Baer G, Ziv A, Raz E, Atzori S, Salvi S (2013) Sinkhole
of erosion by subsurface flow. In: Higgins CG, Coates DR (eds) precursors along the Dead Sea, Israel, revealed by SAR interfer-
Groundwater geomorphology; the role of subsurface water in ometry. Geology 41:1019–1022
earth-surface processes and landforms. The Geological Society Pazzi V, Tapete D, Cappuccini L, Fanti R (2016) An electric and elec-
of America, Special Paper vol 252, pp 1–28 tromagnetic geophysical approach for subsurface investigation of
Ezersky M (2008) Geoelectric structure of the Ein Gedi sinkhole anthropogenic mounds in an urban environment. Geomorphology
occurrence site at the Dead Sea shore in Israel. J Appl Geophys 273:335–347
64:56–69 Pazzi V, Tanteri L, Bicocchi G, Caselli A, D’Ambosio M, Fanti R
Ferreli L, Guerrieri L, Nisio S, Vita L, Vittori E (2004) Relations (2017a) H/V technique for the rapid detection of landslide slip
among seismogenic structures, earthquakes and sinkhole phe- surface(s): assessment of the optimized measurements spa-
nomena: a methodological approach in the Apennines (Italy). tial distribution. In: Mikos M, Tiwari B, Yin Y, Sassa K (eds)
In: Proceedings of the 32nd international geological congress, Advancing culture of living with landslides, vol. 2—advances in
Firenze, Italy landslide science. Springer, Switzerland, 335–343, https://doi.
Giampaolo V, Capozzoli L, Grimaldi S, Rizzo E (2016) Sinkhole risk org/10.1007/978-3-319-53498-5_38
assessment by ERT: the case study of Sirino Lake. Geomorphol- Pazzi V, Tanteri L, Bicocchi G, D’Ambrosio M, Caselli A, Fanti R
ogy 253:1–9 (2017b) H/V measurements as an effective tool for the reliable
Griffin WP (1949) Residual gravity in theory and practice. Geophys- detection of landslide slip surfaces: case studies of Castagnola (La
ics 14:39–56 Spezia, Italy) and Roccalbegna (Grosseto, Italy). Phys Chem Earth
Gutiérrez F, Guerrero J, Lucha P (2008) A genetic classification of 98:136–153. https://doi.org/10.1016/j.pce.2016.10.014
sinkholes illustrated from evaporite paleokarst exposures in Spain. Pierotti P (1993) La valle dei mulini. In: Pacini (ed) Ospedaletto (PI),
Environ Geol 53:993–1006 Italy. (In Italian)
Higgins CG, Schoner C (1993) Sinkholes formed by piping into buried Piro S, Tsourlos PI, Tsokas GN (2001) Cavity detection employing
channels. Geomorphology 20(3–4):307–312 advanced geophysical techniques: a case study. Eur J Environ Eng
IGM (Military Geographic Institute) (2016) Available online: http:// Geophys 6:3–31
www.igmi.org SESAME (2004) Guidelines for the implementation of the H/V spectral
Intrieri E, Gigli G, Nocentini M, Lombardi L, Mugnai F, Fidolini F, ratio technique on ambient vibrations. Measurements, processing
Casagli N (2015) Sinkhole monitoring and early warning: an and interpretation. SESAME European research project, WP12—
experimental and successful GB-InSAR application. Geomor- Deliverable D23.12, European Commission—Research General
phology 241:304–314 Directorate, Project No. EVG1-CT-2000-00026 SESAME
Jones CE, Blom RG (2014) Bayou Corne, Louisiana, sinkhole: pre- Snyder SW, Evans MW, Hines AC, Compton JS (1989) Seismic expres-
cursory deformation measured by radar interferometry. Geology sion of solution collapse features from the Florida Platform. In:
42:111–114 Engineering and Environmental Impacts of Sinkholes and Karst.
Lane JW, White EA, Steele GV, Cannia JC (2008) Estimation of bed- In: Proceedings of the 3rd multidisciplinary conference on sink-
rock depth using the horizontal-to-vertical (H/V) ambient-noise holes and the engineering and environmental impacts of Karst, St.
seismic method. In: Proceedings of the 21st EEGS symposium on Petersburg Beach, Florida, USA, pp 281–298
the application of geophysics to engineering and environmental Strini A (2004) Il fenomeno “occhi pollini” della Brianza (Lombardia,
problems, Philadelphia, USA, pp 490–502 Italia). Caratteristiche e genesi di cavità in depositi quaternari.
Lee EJ, Shin SY, Ko BC, Chang C (2016) Early sinkhole detection Quaderni di Geologia Applicata 11(1):83–99 (In Italian)
using a drone-based thermal camera and image processing. Infra- Tuscany Region (2016) Available online: http://www.regione.toscana.it
red Phys Technol 78:223–232 Waltham T, Bell FG, Culshaw MG (2005) Sinkholes and subsid-
Lotti A, Saccorotti G, Fiaschi A, Matassoni L, Gigli G, Pazzi V, Casa- ence: Karst and cavernous rocks in engineering and construction.
gli N (2015) Seismic monitoring of rockslide: the Torgiovan- Springer, Berlin, p 382. https://doi.org/10.1007/b138363
netto quarry (Central Apennines, Italy). In: Lollino G, et al (eds) White WB (1988) Geomorphology and hydrology of karst terrains.
Engineering geology for society and territory, vol. 2. Springer Oxford University Press, New York, p 464
International Publishing, Switzerland, pp 1537–1540. https://doi. Williams P (2003) Dolines. Encyclopedia of caves and karst science.
org/10.1007/978-3-319-09057-3_272 Fitzroy Dearborn, New York, pp 304–310
Marr JC (1955) Sinkholes in irrigated fields. Calif Agric 9(11):6–7
13You can also read