Dementia Neurology Deserts and Long-Term Care Insurance Claims Experience in the United States: How Does Limited Supply of Neurology Specialists ...
←
→
Page content transcription
If your browser does not render page correctly, please read the page content below
Aging and Retirement

 Dementia Neurology Deserts and Long-Term Care Insurance Claims
 Experience in the United States: How Does Limited Supply of
 Neurology Specialists Correlate with Claims Experience Data?

May 2021
2

Dementia Neurology Deserts and Long-Term Care
Insurance Claims Experience in the United States
How Does Limited Supply of Neurologists Correlate with Claims
Experience Data?

AUTHORS                 Anitha Rao MD, MA                                    SPONSOR                       Society of Actuaries
                        Board Certified Geriatric Neurologist
                        CEO, Founder Neurocern

                        Robert Eaton, FSA, MAAA
                        Principal & Consulting Actuary
                        Milliman Inc

Caveat and Disclaimer

The opinions expressed and conclusions reached by the authors are their own and do not represent any official position or opinion of the Society of
Actuaries or its members. The Society of Actuaries makes no representation or warranty to the accuracy of the information.

Copyright © 2021 by the Society of Actuaries. All rights reserved.

                                                                                                                 Copyright © 2021 Society of Actuaries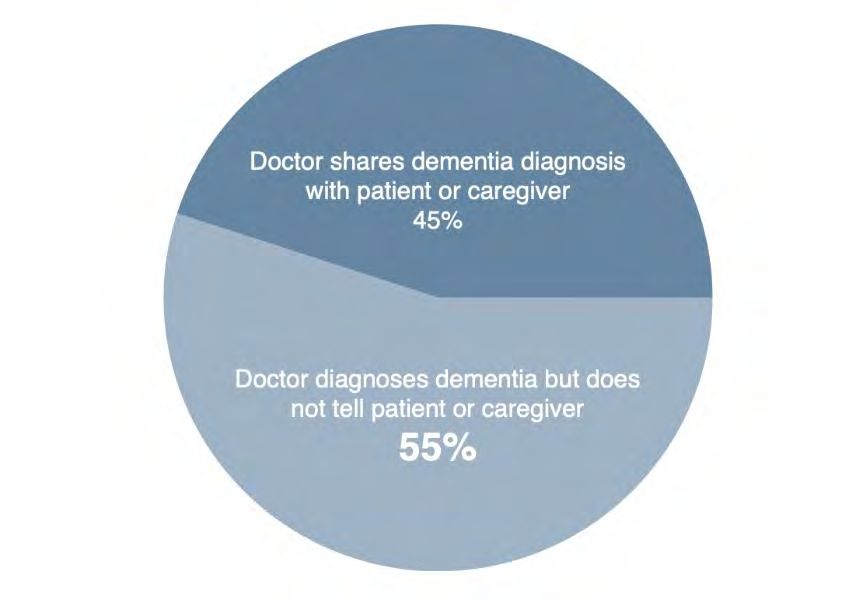
3

CONTENTS
Executive Summary .................................................................................................................................................. 4
What is Dementia? ................................................................................................................................................... 6
       Dementia and aging are not the same ......................................................................................................................... 6
       Pre-Dementia and Identifying Mild Cognitive Impairment ......................................................................................... 7
       Risk Factors for Developing Dementia .......................................................................................................................... 7
Current Issues with Evaluating and Diagnosing Dementia as they Relate to Long Term Care Risk .............................. 8
       Poor Disclosure To Patients Represents Unaccounted Risk For Carriers .................................................................... 8
       The Undiagnosed and Misdiagnosed ............................................................................................................................ 9
       Identifying Delirium and Reversible Dementia Cases in Clinical Practice ................................................................... 9
       Shortage of Neurologists Globally and in the United States ..................................................................................... 10
       Alzheimer’s and Other Related Dementia Neurology Deserts Index Score .............................................................. 11
Methods ................................................................................................................................................................. 13
     Milliman Data and ANDI Score .................................................................................................................................... 13
     LTCI Historical Claims Experience Data ....................................................................................................................... 14
Results .................................................................................................................................................................... 17
       Limitations of Analysis ................................................................................................................................................. 17
       Implications for the Insurance Industry and Real World ........................................................................................... 18
References .............................................................................................................................................................. 19
Acknowledgments .................................................................................................................................................. 21
Appendix A ............................................................................................................................................................. 22
Appendix B ............................................................................................................................................................. 23
Appendix C ............................................................................................................................................................. 24
Appendix D ............................................................................................................................................................. 25
About The Society of Actuaries ............................................................................................................................... 26

                                                                                                                                              Copyright © 2021 Society of Actuaries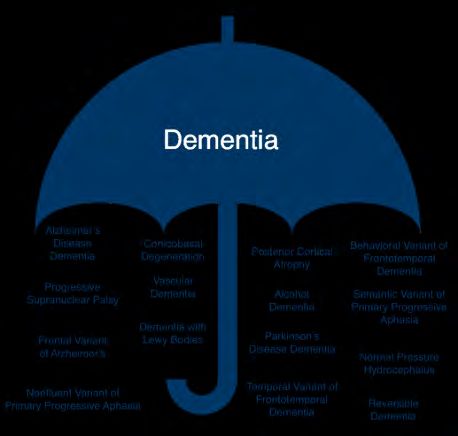
4

Dementia Neurology Deserts and Long-Term Care
Insurance Claims Experience in the United States
How Does Limited Supply of Neurologists Correlate with Claims
Experience Data?

Executive Summary

Alzheimer’s Disease and Related Dementias (ADRD) constitute a plurality of historical long-term care insurance (LTC,
LTCI) claims. These insurance benefits are paid to individuals who are severely cognitively impaired. LTCI actuaries
are interested in understanding the driver of past claim patterns in order to predict how future LTCI claims will
emerge. Because ADRD is such a prominent cause of claim, we see value in exploring drivers of claims that stretch
beyond typical predictive parameters such as age, sex, and other demographic attributes or benefit types. This study
is unique as it combines long term care insurance actuarial analysis, neurology, and real-world predictive analytics.

Dementia is one of the top growing public health problems in the world. It impacts both developing and developed
countries. It is estimated by global reports that there are approximately 50 million people living with dementia
globally, and this number is expected to increase to 152 million by 2050. The annual global total cost of dementia is
estimated at US $1 trillion in 2018, a figure expected to double by 203018.

If the global cost of dementia care were a country, it would represent the 18th largest economy18. According to the
Alzheimer’s Association, in the United States, every 65 seconds someone in the United States is diagnosed with the
disease. Dementia is the 6th leading cause of mortality in the United States and kills more people annually than
breast cancer and prostate cancer combined1.

Increased life expectancy and reduced fertility have shaped the demographics of society into a predominantly older
and aging population. Given this phenomenon of population aging, there also exists a rise in neurological and
cognitive conditions such as dementia, stroke, and epilepsy. We chose to focus specifically on neurologists in this
paper given the U.S. population’s aging and the diseases this type of medical specialist diagnoses and treats. In
2015, it was estimated that about 1 in 3 Medicare beneficiaries had at least one office visit for a neurological
condition17. Among all dementia care specialists, neurologists were the most likely to diagnose patients with a
specific type of dementia7.

Despite the enormity of dementia from both the population health and cost perspectives noted above, there is a
growing shortage of dementia care specialists, including neurologists. By 2025, there will likely be a large number of
ADRD patients facing a shortage of neurologists and the wait times for new and follow up neurologist appointments
are projected to grow significantly from the wait time of about 30 days in 2012 9. Specific geographic locations are
expected to have a relatively high number of dementia cases and a relatively low number of neurologists - known as
dementia neurology deserts.

Severe irreversible cognitive impairment from dementia is a benefit eligibility trigger in LTCI. In 2020, carriers
reported that approximately 50-70% of incoming claim applications are attributed to cognitive conditions.

                                                                                              Copyright © 2021 Society of Actuaries
5
This paper describes the results of our analysis into how the supply of neurology specialists for diagnosis and care of
ADRD, as captured by Alzheimer's Disease and Related Disorders Neurology Desert Index (ANDI) scores, relates to
historical LTCI cognitive claims. We explore whether there is any relationship between geographic distribution of
neurology specialists (and demand for access to these specialists across geographic locations) and LTCI cognitive
claims incidence.
We found the following key results.
• There is a positive, modest correlation (10%) between dementia neurology deserts and historical
retrospective LTCI claims from 2000-2017. We developed a methodology to correlate the neurological
dataset with actuarial LTCI claims using a cognitive incidence rate relativity score described further in the
research below.
• There is a positive correlation (38%) between the 2012 demand of neurologists by geographic location and
the historical incidence of LTCI claims from years 2000-2017. This correlation provides an intuitive
validation of results that we would expect to see and provides more confidence in our results given that
the two datasets were collected independently.
• Traditional parameters used by actuaries to assess cost and utilization in LTCI such as gender, claim
duration, and age were not meaningful predictors of the variability in cognitive claim incidence rates across
geographic locations in the United States. This finding has various implications for actuaries across
insurance product lines that use these attributes for reserving purposes.
Copyright © 2021 Society of Actuaries6
What is Dementia?
DEMENTIA AND AGING ARE NOT THE SAME
Dementia is a category of symptoms and behaviors that negatively impact daily life and activities of daily living.
Dementia can be caused by a variety of illnesses spanning from stroke, Parkinson’s disease, infection, or
neurodegeneration of cells1. Dementia is an umbrella category, just like cancer is an umbrella category21. There are
many types of dementia just like there are many types of cancer. Alzheimer’s disease and dementia are not the
same. Alzheimer’s disease is one type of dementia among more than fifteen different types1,27. From a risk
management perspective, each type of dementia has its own morbidity, mortality, and utilization profile 27.
Understanding the subtype of dementia is as important as identifying the type of cancer. Possible benefits of
identifying the specific subtype of dementia include prompt evaluation of treatable or recoverable causes of
cognitive impairment6,22. For example, 10-20% of all new cases of cognitive impairment have a treatable component
due to undiagnosed sleep apnea, untreated depression, or polypharmacy (taking too many medications)5. More
about reversible conditions will be discussed below.
In addition, correctly identifying the dementia subtype prevents prescription of medications that may worsen
cognitive impairment and allows patients to participate in clinical trials that include possibly slowing the disease or
participating in research at clinical expert centers to access pharmacologic or nonpharmacologic therapies23. For
patients with multiple medical comorbidities, identifying dementia subtypes may help manage other chronic
medical conditions that can worsen cognitive function8. For example, recognizing dementia in a patient with
Copyright © 2021 Society of Actuaries7
diabetes may allow care management teams to focus on blood glucose management with a care partner instead of
expecting the patient to self-manage the disease alone6. New medications are on the horizon for the management
of possible behavioral symptoms associated with ADRD but require an accurate diagnosis of dementia.
PRE-DEMENTIA AND IDENTIFYING MILD COGNITIVE IMPAIRMENT
The earliest stages of dementia start during a phase called “preclinical.” On objective brain imaging studies (MRI or
PET) during this stage, patients may have structural changes but not yet exhibit clinical symptoms1. Some individuals
may stay in the preclinical phase without ever developing symptoms of dementia. Researchers have ascribed this to
possible higher cognitive reserve in some individuals versus others. Many biotechnology companies are developing
tools and biomarkers to detect this early preclinical stage in patients. However, they have had varied success in
accuracy.
The next stage after preclinical is called mild cognitive impairment (MCI). These patients have subtle changes in
memory and thinking14. Usually, these symptoms have been noticed by others around them, either family members
or friends who are concerned about the person’s brain health and cognition. Patients are generally able to perform
their activities of daily living, but there are also structural changes noted on MRI, PET, or other biomarker
modalities. In longitudinal studies, 38% of patients with MCI go on to develop dementia in five years1.
RISK FACTORS FOR DEVELOPING DEMENTIA
Age is the single biggest risk factor for developing dementia. The risk of developing dementia increases significantly
with age; 3% of people between 65-74, 17% of people between 75-84, and 32% of people 85 and above have
dementia1.
Genetics also plays a role. There are both risk genes and deterministic genes. Risk genes may increase the likelihood
of developing dementia but will not guarantee it happens. One such example is the apolipoprotein E- ε4 gene
(APOE4). The more copies one has of this gene, the higher the risk. Around 60% of people affected by Alzheimer’s
disease have at least one copy of this allele. People who have two copies of this allele have three to five times more
risk of developing dementia. Deterministic genes can cause early onset Alzheimer’s disease (EOAD) or familiar
Alzheimer’s disease (FAD). In these cases, symptoms may develop before age 65. Three common genes associated
with deterministic risk include amyloid precursor protein (APP), presenilin-1 (PS-1) and presenilin-2 (PS-2)1.
Gender plays a role in dementia risk as well. Research has demonstrated that more than two thirds of cases are
women, and women live with more severe symptoms than men11,21.
Lastly, modifiable lifestyle related risk factors such as smoking, obesity, diabetes type II, and depression are among a
list of others listed in Table 1 that have all been associated with increased risk of developing dementia21. The relative
risk indicates that people with those lifestyle factors are more likely to develop Alzheimer’s Dementia than those
without. The population attributable risk indicates the percentage of cases from the cited study, attributable to a
given lifestyle factor.
Copyright © 2021 Society of Actuaries8
Table 1
RELATIVE RISK OF LIFESTYLE FACTORS INCREASING RISK FOR DEMENTIA21
Population Attributable
Lifestyle factors Relative Risk Risk
Midlife obesity +60% 2.0%
Diabetes Type II +46% 2.9%
Midlife hypertension +61% 5.1%
Smoking +59% 13.9%
Depression +90% 10.6%
Low education +59% 19.1%
Current Issues with Evaluating and Diagnosing Dementia as they Relate to Long
Term Care Risk
POOR DISCLOSURE TO PATIENTS REPRESENTS UNACCOUNTED RISK FOR CARRIERS
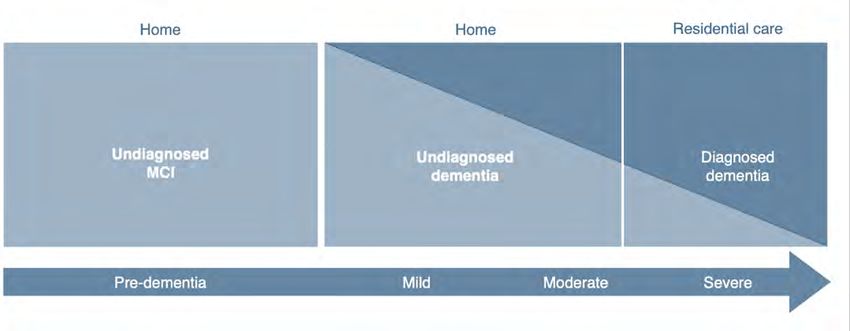
Physicians often have the responsibility of delivering bad news. In the 1960s, research studies showed that 9 out of
10 physicians did not disclose a cancer diagnosis due to fear of causing unnecessary anxiety or suicidal ideation
during a time when cancer therapies were limited. In 2015, the Alzheimer’s Association reported that physicians
routinely disclose a diagnosis of dementia to patients and families only 45% of the time 2. Disclosure rates were even
lower at 27% for patients diagnosed with other types of dementia 2. This was again because many physicians
believed that there was no point to disclosure due to lack of therapeutic options available.
The lack of clinical disclosure by physicians also appears as poor documentation in the electronic medical record 23.
For insurance coverage, this represents unaccounted risk during underwriting and claims adjudication which rely on
attending physician statements or medical record review to verify a clinical condition. Appendix D includes more
detail on professionals who diagnose and treat dementia.
Copyright © 2021 Society of Actuaries9
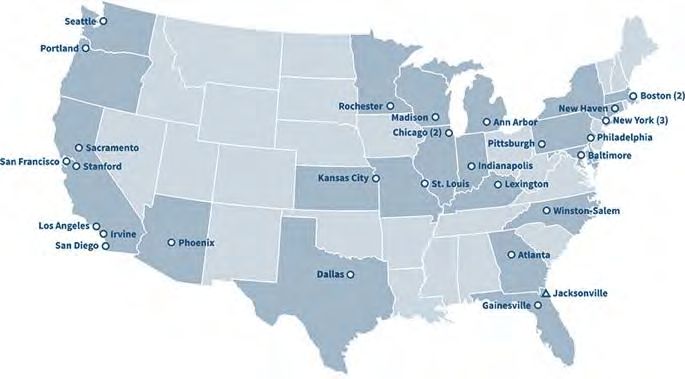
THE UNDIAGNOSED AND MISDIAGNOSED
Further complicating poor disclosure are undiagnosed cases. Community-based research studies have shown that
approximately 50% of cases with ADRD are never diagnosed by a physician2,19. The illustrative figure below highlights
how the undiagnosed population mainly accounts for community dwelling (home-based) patients. By the time
patients make it to residential/facility care, the majority of patients have been diagnosed by a clinician, however
there are still patients who are undiagnosed19. For insurance carriers, claims arising from the community regardless
of cognitive or non-cognitive status warrant further investigation to determine cognitive impairment. For actuaries
this may be important for identifying risk, as cognitive claims last longer and cost more over time, thus requiring
more reserving over the long term.
IDENTIFYING DELIRIUM AND REVERSIBLE DEMENTIA CASES IN CLINICAL PRACTICE
Prior to providing a patient with a diagnosis of irreversible dementia, the American Academy of Neurology and the
American Psychiatric Association consider it best practice and part of evidence-based guidelines to rule out
treatable conditions. Research focused on quality metrics for primary care physicians has demonstrated that only
41% of patients with cognitive impairment are screened for depression (which is a frequent mimicker of dementia),
and only 15% receive lab screening to check for recoverable causes for dementia (such as metabolic disorder,
vitamin deficiency, hearing/vision impairment, sleep apnea, or medication side effects)4. It is estimated in clinical
literature that at least 10-25% of initial cases presenting as cognitive impairment, have some type of treatable
component to the disease1,4.
Generally, insurance carriers today assume the clinical provider has ruled out reversible cases of cognitive
impairment prior to administering neuropsychological testing such as the Mini-Mental Status Exam (MMSE) or the
Montreal Cognitive Assessment (MOCA) during the benefit eligibility assessment. Furthermore, more modern
cognitive assessments performed on mobile devices or using wearable technology may result in a high degree of
false positive diagnoses as these workflows may not rule out treatable conditions prior to testing.
In dementia specialist centers, neurologists spend a large portion of the clinical workup ruling out treatable
conditions before administering neuropsychological testing and diagnosing cognitive impairment1,4. Furthermore, it
is important to also note many neuropsychological tests are validated in highly controlled settings with small cohorts
of patients who are not representative of LTCI insurance claimants.
Copyright © 2021 Society of Actuaries10
Currently there are a limited number of expert Alzheimer’s Disease Research Centers that use state of the art
biomarkers, imaging, and diagnostic techniques. Most patients who have access to these centers do so through
referral from their primary care physician or neurologist.
Figure 2
NATIONAL INSTITUTES OF HEALTH (NIH) FUNDED ALZHEIMER’S DISEASE RESEARCH CENTERS IN
THE UNITED STATES
SHORTAGE OF NEUROLOGISTS GLOBALLY AND IN THE UNITED STATES
In 2004, the World Health Organization and the World Federation of Neurology reported that there were 85,318
neurologists globally in 106 countries—only 25% of the world population had access to more than one neurologist
per 100,000 people25 The American Academy of Neurology (AAN) in 2012 estimated active supply of neurologists to
be 16,366 adult and child neurologists in the United States. By 2025, neurology supply estimates were projected to
be 18,0609. Geriatric or behavioral neurologists are estimated to be even fewer, with estimates ranging between
600-1,000 of these specialty neurologists in total across the United States. Roughly 615 medical students apply for
neurology training positions every year9.
AAN research calculations for demand of neurologists take into consideration wait times, difficulty associated with
recruiting a specialist to a specific geographic area, epidemiologic patterns within an aging patient population,
primary care referral patterns, and physician practices that were no longer able to accept Medicaid beneficiaries. In
2012, the average wait time to see a general neurologist across the United States for a new patient visit was 30
days9. Today, wait times to see a geriatric neurologist are six to nine months across major academic medical centers.
Copyright © 2021 Society of Actuaries11
In a study by the AAN, a microsimulation model evaluated neurology specialist demand by considering prevalence of
neurological conditions associated with a growing aging population in each state along with expanding healthcare
insurance enrollment under the Patient Protection and Affordable Care Act (ACA). The AAN study estimated in 2012,
there was an overall 11% shortfall of neurologists, meaning the neurology workforce could have used an additional
11% of trained neurologists to meet the demand at that time. By 2025, the shortfall is expected to increase to 19%
across the United States, with specific geographic regions being more in need of specialist neurological care than
others9.
ALZHEIMER’S AND OTHER RELATED DEMENTIA NEUROLOGY DESERTS INDEX SCORE
In prior research it has been well established that the number of neurologists in a particular geographical area
influences utilization of this speciality17. In 2020, a retrospective cross-sectional study evaluated the geographic
distribution of neurologists and the utilization of neurologists across specific geographic regions. A 20% national
sample of the 2015 Fee-for-Service Medicare population estimated that on average 23.5% of Medicare patients
accessed neurological services. This estimate ranged between 20.6%-27% depending on the geographical
distribution of neurologists among hospital referral regions (regional health markets for tertiary care)17.
Furthermore, after considering the prevalence of various neurological diseases across U.S. states, more than 50% of
the overall weighted increase in patients seen by neurologists in the highest neurologist density compared to the
lowest neurologist density was comprised mainly of patients with dementia (ranking the highest in overall
difference) followed by other neurological conditions including stroke, back pain, and gait abnormality 17. This result
indicates that the supply of neurologists may influence access to neurologist care differentially for specific health
and neurological conditions.
In 2017, Neurocern, a neuroinformatics and predictive analytics company developed an ADRD Neurology Desert
index (ANDI) score, defined as the ratio of general adult neurologists to ADRD population. General adult neurologists
were used as opposed to behavioral or geriatric neurologists as the geographic distribution of this latter group is not
readily available. Neurocern’s researchers identified states with the lowest projected ratio of adult neurologists per
10,000 ADRD cases in 2025. Twenty states with low ANDI scores (5 to 9) were identified as “dementia neurology
deserts”, indicating a significant shortfall between an available neurology workforce that provides neurological care
delivery and the prevalence of ADRD patients in those states. Per capita scores were calculated to account for states
with low population counts. To calculate this scoring index, data was used from the Centers of Medicare,
Alzheimer’s Association, and the American Academy of Neurology. To account for the undiagnosed population,
estimated prevalence of ADRD cases were doubled. It was also assumed that 90% of projected neurologists would
be adult neurologists as compared to pediatric neurologists. Altogether, the 20 most severe desert states represent
a projected ADRD population of 2,068,000 people by 2025 with a wide range of state budgets dedicated toward
long term care support services, Medicaid, and public-private partnerships. The top 20 ANDI scores are listed in
Appendix A. Figure 2 illustrates through a heat map which states have high ANDI scores (darker areas), where
neurologists are in greater supply statewide, and the ‘neurology deserts’ in the lighter areas where neurologists are
in relatively lower supply statewide. Wyoming has the fewest adult neurologists per 10,000 persons with ADRD. It is
important to note that although telehealth services may be provided in certain geographic regions with a low supply
of neurologists, prior to the COVID-19 pandemic, telehealth neurology services have mainly been utilized for stroke
care and not for dementia care services15.
Copyright © 2021 Society of Actuaries12
Figure 2
HEAT MAP OF ANDI SCORES BY STATE
Light areas (‘deserts’) indicate fewer neurologists per capita
In this subsequent actuarial research, we considered whether we would find higher cognitive impairment claims
incidence among ANDI desert states where neurologist supply is low relative to the ADRD population. Geographic
variation in primary care physician practice patterns for dementia patients has been previously reported12.
Furthermore, we expected that neurologist supply relative to the ADRD population could have an impact on the
average LTC length of claim in these dementia neurology deserts. This impact may be due to factors such as the
timing of dementia diagnosis, the specificity of dementia type diagnosis, the rate of identifying and managing
treatable conditions contributing to cognitive impairment, and dementia care treatment patterns. These factors all
have the potential to influence the timing of LTC claim incidence and patient mortality, which in turn could affect
the LTC length of claim.
Copyright © 2021 Society of Actuaries13
Methods
MILLIMAN DATA AND ANDI SCORE
To understand historical claims data, ANDI scores were combined with Milliman’s Long-Term Care Guidelines
(Guidelines) research. In the Guidelines, data represents claims from the years 2000 – 2017, with certain data
contributors providing claims for certain subsets of that experience window. There have been seven editions of the
Guidelines, starting in 1992 up to the most recent edition of 2017. The 2017 version of the Guidelines is based
primarily on claims from around 2005 to 2014. The final product is based on observed data and incorporates the
collective judgment of Milliman LTC actuaries on the future level of morbidity. Each update of the Guidelines
considers recent claim data, along with past analysis and research. The 2017 Guidelines are based directly on
800,000 claims representing nearly $50 billion of incurred claims and 49 million life years of exposure. In addition to
the insured data analyzed, other research and industry studies are considered and have an indirect influence on the
Guidelines.
For this study, we grouped claims by policyholder state of issue, as we did not have a resident state concurrent with
each claim. To the extent that policyholders migrate among states between the date of issue and the date of claim,
the analysis does not detect such migration.
Certain contributors to the Guidelines provide diagnosis (or a similar cause of claim) associated with each claim. For
the data with this indicator, we grouped these claims as shown in Table 2.
Table 2
GROUPING OF LTCI CAUSES OF CLAIM
Cause of claim Grouping
Nervous System Cognitive
Mental Cognitive
Alzheimer’s Cognitive
Stroke Cognitive
Arthritis Non-Cognitive
Cancer Non-Cognitive
Circulatory Non-Cognitive
Diabetes Non-Cognitive
Digestive System Non-Cognitive
Endocrine System Non-Cognitive
Genitourinary System Non-Cognitive
Injury Non-Cognitive
Respiratory Non-Cognitive
Missing Other
Other Other
We removed the ‘Other’ and ‘Missing’ causes of claims (approximately 20,000) from our analysis altogether, noting
that all companies did not provide the same level of detail.
In total, this analysis relies on approximately 77,000 cognitive claims and 89,000 non-cognitive claims. The state with
the least number of cognitive claims is Alaska, with 107 cognitive claims and 95 non-cognitive claims. The median
number of cognitive claims in the dataset, across all states, is 1,162 and the median number of non-cognitive claims
is 1,086.
Copyright © 2021 Society of Actuaries14
LTCI HISTORICAL CLAIMS EXPERIENCE DATA
We calculated the cognitive incidence rate relativity (CIRR) across U.S. states. We sum the number of cognitive (and
non-cognitive) LTCI claims for policies issued in a given state (we refer to ‘issue state’ as ‘state’ throughout this
report) and compare those to the total expected LTCI claims in that state, over the same time period. We refer to
this ratio (actual cognitive claims / total expected claims) as the cognitive claim actual-to-total-expected rate, or
CogATotalE (this is NonCogATotalE for non-cognitive claims).
We do not calculate a formal expectation of cognitive (or non-cognitive) claims as that effort is beyond the scope of
this project. The actual-to-total expected ratio CogATotalE is appropriate for this use because we compare this ratio
across other variables (in this case, state) rather than drawing conclusions from the magnitude of this ratio in
isolation.
The CIRR for each state is calculated as:
CIRRstate = CogATotalEstate / CogATotalEnationwide
The non-cognitive incidence rate relativity (NCIRR) is calculated in the same manner:
NCIRRstate = NonCogATotalEstate / NonCogATotalEnationwide
The expected total incidence rates for each state are calculated as expected claims divided by the exposure.
Expected claims are based on our analysis from assumptions developed from the 2017 Milliman Guidelines,
including the following characteristics:
• Issue age
• Policy duration
• Sex
• Marital status
• Underwriting
• Policy type (comprehensive vs. facility-only or home health-only)
• Benefit richness (elimination period, benefit period)
These results show, for instance, that Louisiana has a 129% CIRR, indicating that cognitive LTCI claims in Louisiana
have been 29% higher than expected compared to the incidence rates of all cognitive claims nationwide.
Table 3 shows the top 5 and bottom 5 states by their CIRR score.
Table 3
TOP AND BOTTOM 5 CIRR STATES
State CIRR
Louisiana 129%
Alabama 123%
Mississippi 122%
Arkansas 121%
Utah 117%
… …
South Dakota 90%
Pennsylvania 90%
Indiana 90%
Maryland 89%
Hawaii 87%
Copyright © 2021 Society of Actuaries15
Similarly, Table 4 shows the top 5 and bottom 5 states by the NCIRR, i.e., the rate at which non-cognitive claim
incidence rates exceed the nationwide expected non-cognitive incidence rates.
Table 4
TOP AND BOTTOM 5 NCIRR STATES
State NCIRR
Florida 144%
Alabama 126%
California 122%
Georgia 119%
Louisiana 109%
… …
Alaska 74%
Montana 74%
Iowa 71%
Hawaii 61%
Delaware 55%
We see that certain states appear in both Table 3 and Table 4. For instance, Hawaiians have a low cognitive and
non-cognitive incidence rate relativity compared to nationwide averages. This result is consistent with general
industry observations that LTCI incidence rates in Hawaii are lower than nationwide averages (a result that Hawaii
regulators often point to in discussions about LTCI premium rate increases). Similarly, Alabama has an overall higher
LTCI claim incidence rate than nationwide, and this is evident in cognitive and non-cognitive claims.
We look at the relationship of the CIRR to the NCIRR to understand the relative propensity of policyholders to incur
cognitive-based LTCI claims compared with non-cognitive LTCI claims. The scatter plot in Figure 3 shows the CIRR
and NCIRR scores for 51 states (this includes Washington D.C.). States farthest away from the diagonal are those
where we see disproportionately more cognitive claims than non-cognitive claims, or vice-versa. The diagonal
represents where CIRR equals NCIRR. When both the CIRR and NCIRR are greater than 1, as with states in the top-
right quadrant, cognitive and non-cognitive claim rates are higher than anticipated. States with CIRR and NCIRR
values lower than 1, the bottom-left quadrant, have cognitive and non-cognitive claim rates lower than expected.
Copyright © 2021 Society of Actuaries16
Figure 3
PLOT OF STATES BY CIRR AND NCIRR SCORE
1.5
UT
1.4
1.3
DC
NH
ND
1.2 ND
1.1
MN
CIRR
1 MT NY
CA
IL
IA
0.9
NJ FL
MD
0.8
HI
0.7
0.6
0.6 0.8 1 1.2 1.4
NCIRR
As examples, Florida, New Jersey, California, Maryland, and Illinois all have cognitive-based incidence rates relatively
lower than the expected non-cognitive incidence rates. We will use these data to evaluate the impact of neurology
deserts.
Appendix B includes the CIRR, NCIRR, and the ratio (CIRR / NCIRR) for all 51 jurisdictions.
Copyright © 2021 Society of Actuaries17
Results
We reviewed historical LTCI claims, including the propensity of policyholders to file cognitive (vs. non-cognitive)
claims by state. We compared these cognitive and non-cognitive claim relativities across states. A full listing of these
claim relativities is found in Appendix B.
Overall, we find a modest positive correlation coefficient (R = 10%) between the ANDI neurology deserts score and
the propensity for LTCI policyholders to file cognitive (vs. non-cognitive) claims in that state. We note that when
stroke claims are classified as non-cognitive, this correlation is reduced to 0%.
We also find a positive correlation (R = 38%) between states that had a high per-insured demand for neurologists,
according to the AAN, and Milliman’s CIRR. Appendix C shows the AAN’s supply and demand estimates, per 10,000
life-years of LTC insureds from Milliman’s data set. When stroke claims are classified as non-cognitive, this
correlation remains similar (R = 37%).
We compared our state specific LTC insured CIRR and NCIRR (and CIRR / NCIRR) metrics to other similar datasets,
including the supply of geriatricians, to observe any potential other correlations and patterns, but did not find any
others as strong.
As part of our analysis, we isolated the impact of gender, claim duration, and age across states to evaluate if these
attributes drove differences in relative cognitive claim incidence rates. We found that cognitive claim incidence rate
relativity across states was generally independent of those factors. Actuaries, underwriters, reinsurers, and
regulators commonly look at these attributes as drivers of cost and utilization; they may also wish to look to other
metrics such as geographic location and the supply of cognitive care, as well as other population health factors.
LIMITATIONS OF ANALYSIS
There are several important research limitations to consider in the analysis of this data. The dataset used to
calculate the ANDI scores is prospective in nature for year 2025; however, the LTCI claims data from Milliman is
retrospective in nature representing claims from years 2000-2017. The low correlation between the ANDI and CIRR
scores may be explained by such limitations.
Many policyholders do not reside in the same state the policy was issued in; however, the data does not take into
account migration patterns. Also, LTCI policyholders may hold other various types of health insurance products that
provide access to preventative health or care management services, possibly influencing incidence of an LTCI claim.
Clinicians and LTCI companies characterize patients differently in the context of cognitive impairment and
associated physical limitations. Physicians view patients holistically and may identify individuals as having both
physical disabilities that impact activities of daily living and dementia or cognitive impairment, regardless of whether
those physical disabilities result from cognitive impairment or from a separate condition. However, LTCI cognitive
and non-cognitive claims are mutually exclusive. For example, some patients with cognitive LTCI claims may have
unrelated physical disabilities that impact activities of daily living. On the other hand, the undiagnosed and non-
disclosed cases of cognitive impairment may enter LTCI claim status as non-cognitive, yet cognitive impairment may
be impacting activities of daily living. This is not accounted for in the data analysis.
Delirium and other reversible conditions are not usually investigated by LTCI claim teams. The impact of reversible
conditions on LTCI claims was not included in the scope of this research.
Copyright © 2021 Society of Actuaries18
IMPLICATIONS FOR THE INSURANCE INDUSTRY AND REAL WORLD
The present research highlights the association between state-by-state relativity of LTCI cognitive claims and the
demand for neurologist care based on typical neurologist service utilization rates by ADRD patients. LTCI carriers
benefit from education on neurological diseases and the value of access to comprehensive care for chronic medical
conditions such as cognitive impairment because ADRD is closely linked to the incidence of cognitive LTCI claims.
Furthermore, emphasizing the identification of treatable conditions that can cause or worsen cognitive impairment,
such as delirium, may be beneficial to an LTCI carrier. Prior research has found up to one-third of all incoming LTCI
claims presenting to a carrier were possibly impacted by delirium28. In states with a low supply of neurologists, LTCI
cognitive claims may have a higher likelihood of being impacted by delirium because patients may have less
opportunity for comprehensive guideline-based neurological evaluation to rule out delirium and other treatable
conditions before being diagnosed with dementia.
A large portion of state Medicaid funding for LTC is spent on cognitive-related claims for members receiving care in
a facility. By partnering and gathering more qualitative data on individuals at the initiation of their LTCI claims,
private LTC insurance may provide valuable insights to Medicaid programs about the disease trajectory and
treatment patterns of individuals in facility care for cognitive impairment. This data may offer insights for improving
LTC outcomes both for private and public programs.
We isolated the difference in cognitive claims across states and showed that the state-by-state differences are
independent of differences in age, gender, and policy duration. This information can be valuable for those insurance
carriers pricing other health products such as critical illness, hybrid life and LTCI (or chronic illness) policies, and
disability insurance. Carriers offering these policies would benefit from a greater understanding of trends in
cognitive decline, as they evaluate experience and develop new assumptions for cash flow testing and pricing.
As cognitive claim counts grow with the aging population, this research highlights the need for LTCI carriers to
improve the quality of data gathering during claims administration. Many carriers do not identify claims as cognitive
or non-cognitive for reserving purposes, and therefore do not have the benefit of monitoring trends in these
reasons for claims. This study also lays out a methodology for future research to evaluate other types of LTCI claims
depending on factors such as supply of clinical specialists (cancer claims vs oncology specialist supply) across
geographic areas.
Valuation and pricing actuaries will also benefit from collecting LTCI claims data with a greater degree of accuracy
around the cause of claim, including cognitive claims. As LTCI companies move towards claims modernization, we
anticipate that technologies such as predictive analytics and neuroinformatics will emerge to better characterize
and stratify utilization risk, predict cause of claim, triage the type of claim, and estimate the duration of claims.
Copyright © 2021 Society of Actuaries19
References
1. Alzheimer’s Association. 2020 Alzheimer’s Disease Facts and Figures. Alzheimer’s Dement 2020;16(3):391+.
2. Alzheimer’s Association. 2016 Alzheimer’s Disease Facts and Figures. Alzheimer’s & Dementia 2016;12(4).
3. Alzheimer’s Disease International. World Alzheimer Report 2015 The Global Impact of Dementia an
Analysis of Prevalence, Incidence, and Cost & Trends.
4. Belmin, J., Min, L., Roth, C. et al. Assessment and Management of Patients with Cognitive Impairment and
Dementia in Primary Care. J Nutr Health Aging (2012) 16: 462.https://doi.org/10.1007/s12603-012-0026-z.
5. Boise L, Camiciolo R, Morgan DL, et al. Diagnosing Dementia: Perspectives of Primary Care Physicians. The
Gerontological 1999; Vol 39 (4): 457-464
6. Bradford A, Kunik ME, Schulz P, et al. Missed and Delayed Diagnosis of Dementia in Primary Care:
Prevalence and Contributing Factors. Alzheimer’s Dis Assoc Disorder 2009; 23 (4):306-314.
7. Cho K, Gagnon DR, Driver JA, et al. Dementia Coding, Workup, and Treatment in the VA New England
Healthcare System. International Journal of Alzheimer’s Disease 2014, Article ID 821894
8. Coredell CB, Borson S, Boustani M, et al. Alzheimer’s Association Recommendations for Operationalizing
the Detection of Cognitive Impairment During the Medicare Annual Wellness Visit in a Primary Care Setting.
Alzheimer’s & Dementia 2013; 9:141-150.
9. Dall TM, Storm MV, Chakrabarti R. et al. Supply and demand analysis of the current and future US
neurology workforce. Neurology 2013; 81: 470-478.
10. Downs M, Turner S, Bryans M, et al. Effectiveness of educational interventions in improving detection and
management of dementia in primary care: cluster randomized controlled study. BMJ. 2006;332(7543):692-
696. doi:10.1136/bmj.332.7543.692
11. Erol R, Brooker D, Peel E. Women and Dementia: A Global Research Review. Alzheimer’s Disease
International 2015.
12. Fortinsky RH, Zlateva I, Delaney C, et al. Primary Care Physicians’ Dementia Care Practices: Evidence of
Geographic Variation. The Gerontologist 2009; 50:179-191
13. Freeman WD, Vatz KA, Griggs RC, Pedley T. The Workforce Task Force Report. Clinical implications for
neurology. Neurology 2013; 81: 479-486
14. Galvin JE, Sadowsky CH. Practical Guidelines for the Recognition and Diagnosis of Dementia. J Am Board
Fam Med 2012;25:367–382
15. Hatcher-Martin J, Adams JL, Anderson ER, et al. Telemedicine in Neurology. Neurology Jan 2020, 94 (1) 30-
38
16. Hinton L, Franz C, Reddy G, et al. Practice Constraints, Behavioral Problems, and Dementia Care: Primary
Care Physicians Perspectives. J Gen Internal Medicine 2007: 22(11) 1487-92.
17. Lin CC, Callaghan BC, Burke JF et al. Geographic Variation in Neurologist Density and Neurologic Care in the
United States. Neurology Jan 2021, 96 (3) e309-e321.
18. Prince M, Wimo A, Guerchet M, et al. World Alzheimer’s Report 2015: The Global Impact of Dementia.
Alzheimer’s Disease International 2015.
19. Savva GM, Arthur A. Who Has Undiagnosed Dementia? A Cross Sectional Analysist of Participants of the
Aging, Demographics, and Memory Study. Age and Ageing 2015; 44: 642-647.
20. Swartztrauber K, Vickrey BG. Do Neurologists and Primary Care Physicians Agree on the Extent of Speciality
Involvement of Patients Referred to Neurologists? J Gen Intern Medicine 2004; 19: 654-661
21. Swiss Re. The Dementia Dilemma.
22. Tripathi, M, Vibha, D. Reversible Dementias. Indian Journal of Psychiatry 2009; Jan; 51(Suppl1): S52–S55.
23. Valcour VG, Masaki KH, Curb D, Blanchette PL. The Detection of Dementia in the Primary Care Setting. Arch
Intern Med 2000; 160:2964-2968
24. Van den Dungen P, van Marwijk HW, van der Horst HE, Moll van Charante EP, MacNeil Vroomen J, van de
Ven PM, van Hout HP. The Accuracy of Family Physicians’ Dementia Diagnoses at Different Stages of
Dementia: A Systematic Review. International Journal of Geriatric Psychiatry 2012; 27(4): 342-354.’
25. World Health Organization, World Federation of Neurology. Atlas: Country Resources for Neurological
Disorders. World Health Organization 2005.
26. Weuve J, Hebert LE, Scherr PA, Evans DA. Prevalence of Alzheimer disease in U.S. states. Epidemiology
2015;26(1):e4-6.
Copyright © 2021 Society of Actuaries20
27. Y Chen et al. The costs of dementia subtypes to California Medicare fee-for-service, 2015. Alzheimer’s and
Dementia, 2019
28. Rao A, Miller B, Kulman T, Pinho P, Aggarwal N. External Validation of a Proprietary Delirium Superimposed
on Dementia Risk Score Using Claims Data and Predictive Analytics. Abstract Presentation Alzheimer's
Association International Conference, Amsterdam Netherlands, 2020.
Copyright © 2021 Society of Actuaries21
Acknowledgments
The researchers’ deepest gratitude goes to those without whose efforts this project could not have come to fruition:
the Project Oversight Group for their diligent work overseeing, reviewing and editing this report for accuracy and
relevance.
Project Oversight Group members:
Vince Bodnar
Matt Morton
Ray Nelson
Janet Perrie
Faisal Siddiqi
Bruce Stahl
Sanja Zehnder
At the Society of Actuaries:
Steve Siegel, Sr. Practice Research Actuary
Barbara Scott, Sr. Research Administrator
Copyright © 2021 Society of Actuaries22
Appendix A
2025 projected number
2025 projected 2025 projected of adult neurologists
Top 20 neurology number of persons number of adult per 10,000 persons with
desert states with ADRD neurologists ADRD (ANDI)
Wyoming 26,000 14 5
North Dakota 32,000 18 6
South Carolina 240,000 154 6
South Dakota 40,000 28 7
Oklahoma 152,000 107 7
Iowa 146,000 104 7
Arkansas 134,000 98 7
Hawaii 70,000 52 8
New Mexico 106,000 79 8
Nevada 128,000 97 8
Mississippi 130,000 102 8
Maine 70,000 57 8
Idaho 66,000 54 8
Delaware 46,000 39 8
Alabama 220,000 186 9
Montana 54,000 46 9
Kansas 124,000 110 9
Vermont 34,000 31 9
West Virginia 88,000 79 9
Kentucky 172,000 159 9
Total top 20 2,078,000 1,614 7.8
Total US 14,414,000 16,572 11.5
Copyright © 2021 Society of Actuaries23
Appendix B
CIRR, NCIRR, and CIRR / NCIRR results by state
Issue State CIRR NCIRR CIRR / NCIRR Issue State CIRR NCIRR CIRR / NCIRR
AK 97% 74% 131% MT 100% 74% 135%
AL 123% 126% 97% NC 110% 94% 116%
AR 121% 104% 116% ND 114% 76% 149%
AZ 103% 93% 111% NE 97% 86% 113%
CA 100% 122% 82% NH 111% 81% 137%
CO 99% 83% 119% NJ 91% 108% 84%
CT 98% 94% 104% NM 96% 93% 103%
DC 115% 80% 145% NV 92% 98% 94%
DE 92% 55% 168% NY 96% 103% 93%
FL 99% 144% 69% OH 96% 82% 116%
GA 115% 119% 96% OK 110% 94% 117%
HI 87% 61% 142% OR 101% 96% 106%
IA 99% 71% 139% PA 90% 96% 94%
ID 113% 86% 131% RI 95% 84% 113%
IL 92% 101% 91% SC 114% 101% 113%
IN 90% 81% 111% SD 90% 81% 112%
KS 112% 89% 126% TN 109% 105% 104%
KY 109% 97% 113% TX 107% 97% 110%
LA 129% 109% 118% UT 117% 80% 147%
MA 99% 91% 108% VA 98% 93% 106%
MD 89% 101% 88% VT 101% 82% 123%
ME 97% 75% 129% WA 95% 83% 115%
MI 94% 90% 104% WI 95% 83% 115%
MN 105% 80% 132% WV 100% 97% 103%
MO 104% 83% 124% WY 99% 80% 125%
MS 122% 99% 123%
Copyright © 2021 Society of Actuaries24
Appendix C
2012 Neurologist Supply and Demand per 10,000 life-years of LTC insureds
State Supply Demand State Supply Demand
AK 5.2 8.1 MT 5.9 8.5
AL 5.6 8.9 NC 6.7 8.3
AR 6.2 11.3 ND 3.1 5.5
AZ 9.5 10.8 NE 2.9 4.5
CA 7.0 8.2 NH 7.3 7.1
CO 5.4 6.4 NJ 5.5 5.7
CT 5.1 5.2 NM 5.4 7.7
DC 14.2 3.8 NV 5.7 12.0
DE 6.5 9.4 NY 9.2 6.3
FL 8.4 9.7 OH 7.7 8.5
GA 6.9 9.6 OK 5.0 10.8
HI 3.3 4.1 OR 7.2 8.7
IA 2.9 5.1 PA 8.8 8.1
ID 4.6 9.7 RI 9.2 7.6
IL 6.0 6.9 SC 4.1 9.1
IN 6.5 10.4 SD 3.1 4.7
KS 4.4 6.6 TN 6.0 7.8
KY 5.6 9.7 TX 9.2 11.5
LA 8.2 9.9 UT 15.3 17.0
MA 12.7 6.9 VA 4.7 5.8
MD 9.8 6.1 VT 3.7 4.8
ME 5.6 7.9 WA 5.8 6.8
MI 8.7 9.8 WI 6.0 8.9
MN 6.5 5.4 WV 7.4 11.9
MO 7.5 7.8 WY 2.7 5.9
MS 7.6 14.1
Nationwide 7.1 7.9
Copyright © 2021 Society of Actuaries25
Appendix D
Who diagnoses and treats dementia?
The diagnosis, workup, and care management for patients with dementia involves a wide array of practitioners
including physicians, nurses, neuropsychologists, allied health care professionals and home health aides12,16. Often
these professionals’ roles are interchangeably used by the public; however, they have differences in licensing,
training, prescribing ability, and dementia expertise.
Primary care physicians (PCP) or general physicians (GPs) are medical professionals who act as the patient’s primary
point of contact for comprehensive care5,12,20. These are non-specialists who can refer complex cases to a higher
level of care. In 2020, the Alzheimer’s Association reported that 85% of PCPs say they are on the front lines of
providing dementia diagnosis, and one year after diagnosis, less than a quarter of patients had seen a dementia
expert1. After five years, the percentage of patients who had seen a dementia expert only increased to 36%.
According to a survey conducted by the Alzheimer’s Association, at least 50% of PCPs believe the medical profession
is not prepared to meet the expected increase in patients needing dementia care 1. Medical schools and residency
programs offer little to no training for PCPs on how to evaluate and manage patients with cognitive concerns and
dementia6,23.
Access to dementia experts is limited and dependent on geographic location. Such specialists are important as they
may more consistently evaluate the patient for reversible causes of dementia (such as delirium), provide access to
critical research studies and state of the art clinical trials, and provide customized care planning for patients and
families7.
Among licensed medical professionals who diagnose, evaluate, and treat diseases, neurologists are consulted for all
conditions related to the brain. In the United States, neurologists represent roughly 2% of the total physician
workforce17. Neurologists evaluate and treat common conditions such as stroke, Parkinson’s disease, epilepsy,
delirium, dementia, and multiple sclerosis among others20. Within neurology, geriatric or behavioral neurologists are
“subspecialists” and licensed medical professionals who complete additional fellowship training to understand all
different types of dementia and methods to diagnose dementia. These neurologists also run dementia and aging
focused clinical trials at major academic centers.
A type of PCP who specializes in aging is called a geriatrician. These are medical professionals who commonly work
with neurologists and treat all conditions related to old age. Psychiatrists are licensed medical professionals who
prescribe medications to treat difficult behaviors and agitation related to dementia, but approach dementia with a
mental health perspective. Frequently neurologists, geriatricians, and psychiatrists all work together with the
primary care physician8.
Other professionals and allied health professionals who encounter dementia patients may include
neuropsychologists who test and evaluate the dementia patient with cognitive tests (similar to IQ tests); however,
they do not have a medical degree and cannot prescribe or treat patients with cognitive impairment 7.
Gerontologists have certificates and approach dementia with a social, cultural, and psychological lens to aging,
however they do not practice medicine nor prescribe or treat patients.
Copyright © 2021 Society of Actuaries26
About The Society of Actuaries
The Society of Actuaries (SOA), formed in 1949, is one of the largest actuarial professional organizations in the world
dedicated to serving more than 31,000 actuarial members and the public in the United States, Canada and
worldwide. In line with the SOA Vision Statement, actuaries act as business leaders who develop and use
mathematical models to measure and manage risk in support of financial security for individuals, organizations and
the public.
The SOA supports actuaries and advances knowledge through research and education. As part of its work, the SOA
seeks to inform public policy development and public understanding through research. The SOA aspires to be a
trusted source of objective, data-driven research and analysis with an actuarial perspective for its members,
industry, policymakers and the public.
This distinct perspective comes from the SOA as an association of actuaries, who have a rigorous formal education
and direct experience as practitioners as they perform applied research. The SOA also welcomes the opportunity to
partner with other organizations in our work where appropriate.
The SOA has a history of working with public policymakers and regulators in developing historical experience studies
and projection techniques as well as individual reports on health care, retirement and other topics. The SOA’s
research is intended to aid the work of policymakers and regulators and follow certain core principles:
Objectivity: The SOA’s research informs and provides analysis that can be relied upon by other individuals or
organizations involved in public policy discussions. The SOA does not take advocacy positions or lobby specific policy
proposals.
Quality: The SOA aspires to the highest ethical and quality standards in all of its research and analysis. Our research
process is overseen by experienced actuaries and nonactuaries from a range of industry sectors and organizations. A
rigorous peer-review process ensures the quality and integrity of our work.
Relevance: The SOA provides timely research on public policy issues. Our research advances actuarial knowledge
while providing critical insights on key policy issues, and thereby provides value to stakeholders and decision
makers.
Quantification: The SOA leverages the diverse skill sets of actuaries to provide research and findings that are driven
by the best available data and methods. Actuaries use detailed modeling to analyze financial risk and provide
distinct insight and quantification. Further, actuarial standards require transparency and the disclosure of the
assumptions and analytic approach underlying the work.
Society of Actuaries
475 N. Martingale Road, Suite 600
Schaumburg, Illinois 60173
www.SOA.org
Copyright © 2021 Society of ActuariesYou can also read