Driving the Future of Health Care Real Estate - Corporate Presentation February 2019 - Welltower

Page created by Audrey Arnold
 
CONTINUE READING
Driving the Future of Health Care Real Estate - Corporate Presentation February 2019 - Welltower
Driving the Future of Health
      Care Real Estate
 Corporate Presentation │ February 2019
Driving the Future of Health Care Real Estate - Corporate Presentation February 2019 - Welltower
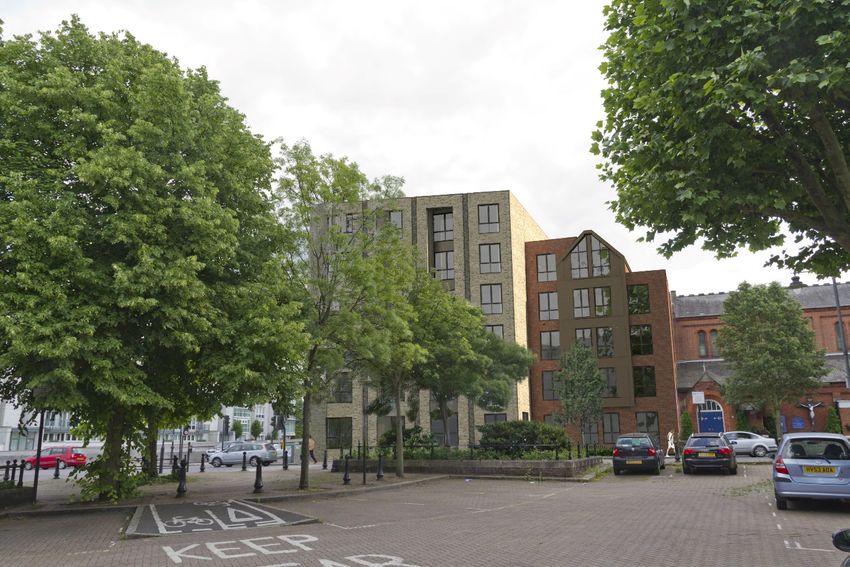
Forward Looking Statements
  This document contains “forward-looking” statements as that term is defined in the Private Securities Litigation Reform Act of 1995. When we use words such as “may,” “will,”
  “intend,” “should,” “believe,” “expect,” “anticipate,” “project,” “pro forma,” “estimate” or similar expressions that do not relate solely to historical matters, we are making
  forward-looking statements. In particular, these forward-looking statements include, but are not limited to, those relating our company’s opportunities to acquire, develop or
  sell properties; our ability to close anticipated acquisitions, investments or dispositions on currently anticipated terms, or within currently anticipated timeframes; the expected
  performance of our operators/tenants and properties; our expected occupancy rates; our ability to declare and to make distributions to stockholders; our investment and
  financing opportunities and plans; our continued qualification as a real estate investment trust (“REIT”); our ability to access capital markets or other sources of funds; and
  our ability to meet our earnings guidance.

  Forward-looking statements are not guarantees of future performance and involve risks and uncertainties that may cause our actual results to differ materially from our
  expectations discussed in the forward-looking statements. This may be a result of various factors, including, but not limited to: the status of the economy; the status of capital
  markets, including availability and cost of capital; issues facing the health care industry, including compliance with, and changes to, regulations and payment policies,
  responding to government investigations and punitive settlements and operators’/tenants’ difficulty in cost-effectively obtaining and maintaining adequate liability and other
  insurance; changes in financing terms; competition within the health care and seniors housing industries; negative developments in the operating results or financial condition
  of operators/tenants, including, but not limited to, their ability to pay rent and repay loans; our ability to transition or sell properties with profitable results; the failure to make
  new investments or acquisitions as and when anticipated; natural disasters and other acts of God affecting our properties; our ability to re-lease space at similar rates as
  vacancies occur; our ability to timely reinvest sale proceeds at similar rates to assets sold; operator/tenant or joint venture partner bankruptcies or insolvencies; the
  cooperation of joint venture partners; government regulations affecting Medicare and Medicaid reimbursement rates and operational requirements; liability or contract claims
  by or against operators/tenants; unanticipated difficulties and/or expenditures relating to future investments or acquisitions; environmental laws affecting our properties;
  changes in rules or practices governing our financial reporting; the movement of U.S. and foreign currency exchange rates; our ability to maintain its qualification as a REIT;
  key management personnel recruitment and retention; and other risks described in our reports filed from time to time with the Securities and Exchange Commission. Finally,
  we assume no obligation to update or revise any forward-looking statements, whether because of new information, future events or otherwise, or to update the reasons why
  actual results could differ from those projected in any forward-looking statements.

                                                                                                                                                                                              2
Driving the Future of Health Care Real Estate - Corporate Presentation February 2019 - Welltower
Welltower at a Glance
Welltower is redefining the settings where healthcare services will be delivered in the future

                      1,676                                                                     ~321,000                                         ~19,965,000
                                                                                                                                                    OUTPATIENT
           TOTAL HEALTH CARE
             PROPERTIES (1)                                                                             RESIDENTS(2)                              MEDICAL VISITS(2)

                                                   NYSE                                                                                 Moody’s         S&P           Fitch
      $45B                                                                           S&P                          Dow Jones World
                                                                                                                                        Baa1
                                                  Symbol:
                                                                                                                   Sustainability                    BBB+ BBB+
Enterprise Value(3)
                                              WELL                                   500                               Index            Stable         Stable         Stable

1. 4Q18 pro-forma for CNL acquisition.
2. Based on internal estimates derived from trailing twelve-month facility level data as of 12/31/2018, and includes CNL acquisition.
3. Source: Bloomberg as of 1/31/2019.                                                                                                                                          3
Driving the Future of Health Care Real Estate - Corporate Presentation February 2019 - Welltower
Real Estate Investment Trust (REIT) Overview

                                    LARGEST U.S. PUBLIC REAL ESTATE COMPANIES By ENTERPRISE VALUE(1)
                        Rank             Company                            Sector           $ (M’s)

                           1              Simon Property Group              Regional Malls   $79,892

                           2              Prologis Inc.                     Industrial       $57,786
                 RANK                           CO M PA N Y
                           3
                                                CO M PA N Y                 Healthcare       $44,502

                           4              Public Storage                    Self-Storage     $42,091

                           5              Equity Residential                Apartment        $36,217

1. Includes RMZ real estate companies. Source: Bloomberg as of 1/31/2019.                              4
Driving the Future of Health Care Real Estate - Corporate Presentation February 2019 - Welltower
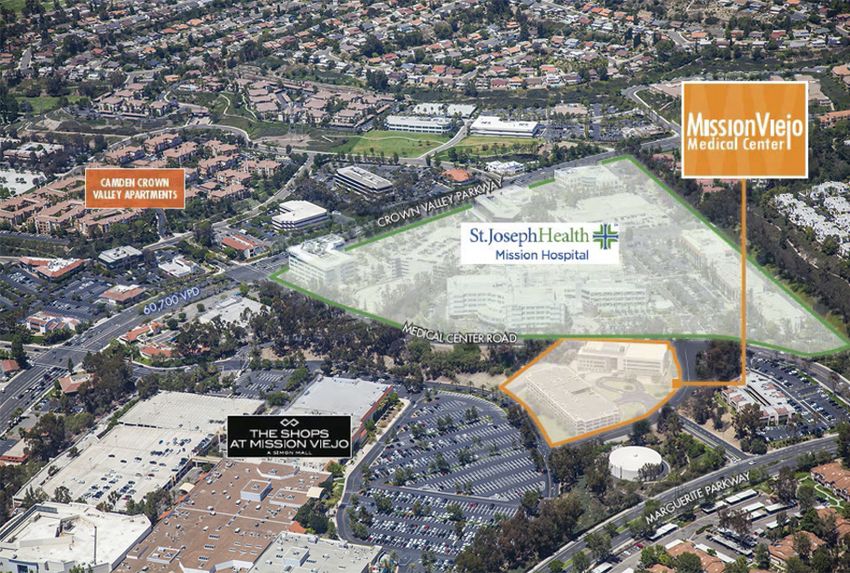
Health Care Real Estate Landscape

$   HIGHER AVERAGE COST
                                                                                         LOWER AVERAGE COST
                                                                                                                $
    ACUTE CARE              POST-ACUTE CARE CONTINUUM                            SENIOR HOUSING

      Hospital        Long-Term        Inpatient      Skilled Nursing   Memory       Assisted     Independent
                     Care Hospital   Rehab Facility        (LTC)         Care         Living         Living

                                                                                       HOME
                 OUTPATIENT / MEDICAL OFFICE BUILDING

                                                                                                            5
Driving the Future of Health Care Real Estate - Corporate Presentation February 2019 - Welltower
Powerful Demographic Tailwinds

                                                                           85+ Age Group % Growth          25-34 Age Group

 110%

   90%

   70%

   50%

   30%

   10%

  -10%
                2018                                                      2023                      2028              2033   2038

Source: US Census Bureau National Population Projections, vintage 2017.                                                             6
Driving the Future of Health Care Real Estate - Corporate Presentation February 2019 - Welltower
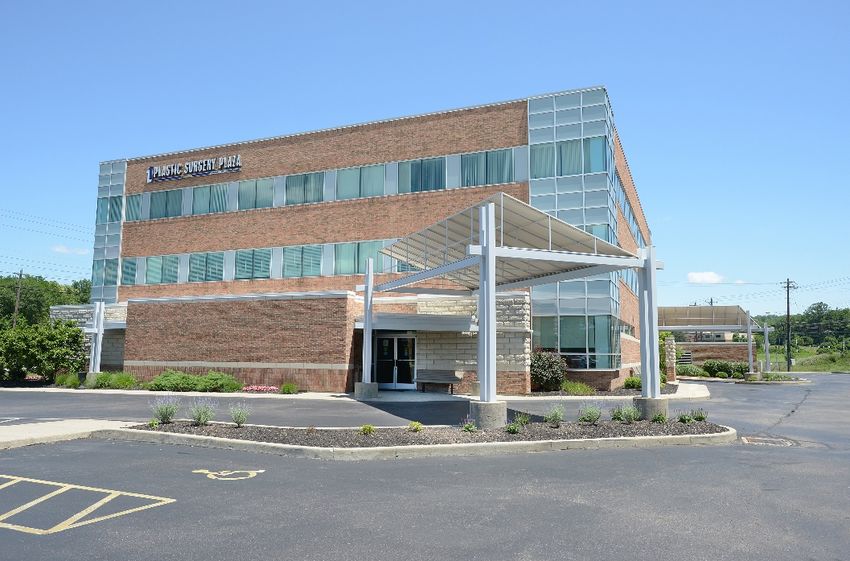
Aging Population Drives Health Care Spending

Source: National Health Expenditure, CMS. Data as of 9/30/2015.   7
Driving the Future of Health Care Real Estate - Corporate Presentation February 2019 - Welltower
Dementia / Alzheimer’s: Residential Memory Care is the Answer

§           Alzheimer’s Disease is the only
            “Top 10 Cause of Death” in the
            U.S. that cannot be prevented,
            slowed or cured                                                                                                                                                            150
                                                                                                                                                                             82      Million
                                                                                                                                                                           Million
                                                                                                                                                       50
§           Number of people with dementia                                                                                                           Million
            globally will almost double every
            20 years

§           Total estimated worldwide cost                                                                                                             2018                 2030      2050
            of dementia care will be $1 trillion
            by 2018, and $2 trillion by 2030

Source: Alzheimer’s Disease International The World Alzheimer Report 2018, The Global Impact of Dementia: An analysis of prevalence, incidence, cost and trends updates.                       8
Driving the Future of Health Care Real Estate - Corporate Presentation February 2019 - Welltower
Recent Strategic Portfolio Optimization

                                          9
Driving the Future of Health Care Real Estate - Corporate Presentation February 2019 - Welltower
Strategic Portfolio Optimization | Capital Recycling
                                                                                                                         (1)
                                                     (1)                           Capital Recycling 2014 – 2018

                       $13B                                $12B

                GROSS INVESTMENTS
                    SINCE 2014                             $10B

                                                           $8B

                       $14B                                $6B
                                                                                                                                             58%

            RESTRUCTURED OR SOLD
                  SINCE 2014                               $4B

                                                           $2B
                                               (2)                                                54%
                           25%
             OF OUR 2014 ASSET BASE                        $0B
             RECYCLED INTO HIGHER                                         Non-Core Dispositions                     Strategic Acquisitions
                 QUALITY ASSETS                                   Post Acute/Acute Care   Outpatient Medical   Seniors Housing   Health System

1.   Investment amounts Pro Rata as of 4Q18.
2.   Based on GAAP Property Values.                                                                                                                10
Strategic Portfolio Optimization | Transformative Transactions
                   Innovative & Accretive Investments
                                § ProMedica/HCR ManorCare: Redefines the care delivery value paradigm and
                                  continuum of care through nationally integrated health system

                                § Johns Hopkins: $79M MOB investment in 100% leased with future development
                                  opportunity

                                § Hammes Medical Office Portfolio: $391M, 23 properties with 150k sq. ft. of land for
                                  development

                                § CNL Medical Office Portfolio: $1.25B, 55 properties across 16 states

                Leveraging Unique Operator Relationships
                                § Pegasus: 36 Brookdale property transition to operator led by turn-around specialty
                                  Steven Vick

                                § Cogir: Expanding relationship by 12 communities with leading & innovative operator

                                § Brookdale: Extended SALI master lease by 8 years with higher annual escalators

                                § Brandywine: Conversion of 27 properties to seniors housing operating platform

                                                                                                                       11
(1)
Portfolio Optimization Enhances Quality of Cash Flow
                                           Strategic Capital Deployment Into OM & Health Systems

                                                    4Q17                                                                                                   4Q18 Pro Forma
                                        SENIORS                                                                                                                SENIORS
                                       HOUSING(2)                                                                                                             HOUSING(2)

                                          70%                                                                                                                    63%
                                                                                                                                                                                           OUTPATIENT
                                                                                                                                                                                            MEDICAL &
                                                                                                                                                                                              HEALTH
                                                                                    OUTPATIENT
                                                                                                                                                                                              SYSTEM
                                                                                       MEDICAL

                                                                                         17%                                                                                                   27%
                                           In-Place                                                                                                               In-Place
                                             NOI                                                                                                                    NOI

                                                                      LONG-TERM/
                                                                      POST-ACUTE CARE                                                                                        LONG-TERM/
                                                                                                                                                                             POST-ACUTE CARE
                                                                      13%
                                                                                                                                                                             10%
                               Private Pay: 94%(3)                                                                                                       Private Pay: 95%(3)
1.   Based on In-Place NOI. See Supplemental Reporting Measures at the end of this presentation. Pro Forma reconciliation can be found at the end of this presentation.
2.   Comprises Seniors Housing Triple-Net and Seniors Housing Operating properties.
3.   Based on Facility Revenue Mix.                                                                                                                                                                           12
Welltower’s Unique Growth Platform
Seniors Housing

                                     13
The Definition of a “Class A” Seniors Housing Portfolio

   High Barrier to Entry
     Premier Markets

                                                                                       Brandywine Living at Alexandria, VA
 Best-In-Class Operating
         Partners

                                            Manhattan Upper West Side
                                                  Development
 Data Science & Analytics
                                                                             Chartwell Toronto Development

     Active Portfolio
      Management

                            Sunrise at Palos Verde,               Sunrise Connecticut Avenue,
                                 Torrance, CA                          Washington, D.C.
                                                                                                                       14
Welltower Family of Brands

                             15
U.S. Seniors Housing Portfolio | Major Urban Market Focus
                                                                97%                                            661                                 $17.1B
                                                                               (1)                                            (2)                                             (2)

                                                     SH Operating NOI in                                 Seniors Housing                          Gross Real Estate
                                                       Top 31 MSAs +                                        Facilities                              Investments
                                                       Coastal States                                      66,470 units
                                                                                                                                                                                    TOP US MARKETS(1)
                                                                                                                                                                                    (% OF US SH OPERATING NOI)

                                                                                                                                                                                     Los Angeles                 14.5%

                                                                                                                                                                                     New York                    12.1%

                                                                                                                                                                                     Boston                      8.3%

                                                                                                                                                                                     San Francisco               5.3%

                                                                                                                                                                                     Washington, D.C.            3.9%

                                                                                                                                                                                     San Diego                   3.7%

                                                                                                                                                                                     Seattle                     3.5%

                                                                                                                                                                                     Dallas                      2.9%

                                                                                                                                                                                     Philadelphia                2.9%

                                                                                                                                                                                     Chicago                     2.8%

1.   Data as of 12/31/2018. NOI data based on In-Place US SH Operating NOI. Please see Supplemental Reporting Measures for reconciliations at the end of this presentation.                                              16
2.   Data as of 12/31/2018. Comprises Seniors Housing Triple-Net and Seniors Housing Operating properties.
Canadian Portfolio | Urban, High Barrier to Entry Markets

                                                                                                                                                                                          CN

                                                                                                                                                                                        78% (1)

                                                                                                                                                                                     SH Operating NOI in
                                                                                                                                                                                    Top 10 Canadian MSAs

       75+ POPULATION (3)
                                                        T o ta
                                                              l Po p
                                                                         .                                                                                                              151       (2)

                                       r th a
                                             n                                                                                                                                            Facilities
                      6            st e                            5.5
                                 Fa
                      5     9.7x
                                               4.0

                                                                                                                                                                                      $2.9B
      (in millions)

                      4                                                                                                                                                                                 (2)
      Population

                      3
                           2.7
                      2
                      1
                                                                                                                                                                                      Gross Real Estate
                      0                                                                                                                                                                 Investments
                          2018               2028                2038

1.
2.
     Data as of 12/31/2018. NOI data based on In-Place Canadian SH Operating NOI. Please see Supplemental Reporting Measures for reconciliations at the end of this presentation.
     Comprises Seniors Housing Triple-Net and Seniors Housing Operating properties as of 12/31/2018.                                                                                                     17
3.   Source: Statistics Canada.
UK Portfolio | Urban, High Barrier to Entry Markets

                                                                                                                                                               88 %(1)
                                                                                                                                                                                            111
                                                                                                                                                                                                      (2)
                                                                                                                                                                                                              $2.8B
                                                                                                                                                                                                                             (2)

                                                                                                                              UK                        SH Operating NOI in                   Facilities      Gross Real Estate
                                                                                                                                                          Greater London &                                      Investments
                                                                                                                                                         Southern England

                Manchester

                                                                                                                                                                                                              op.
                                                                                                                                                                        (3)
                                                                                                                  75+ POPULATION                                                                    o ta lP
                                                                                                                                                                                              a n T
                                                                                                                                                                                     aster th
                  Birmingham
                                                                                                                                       15                                     5x F

                                                                                                                          POPULATION
                                                                                                                           (in millions)
                                                                                                                                                                                                                9.6
                                                                                                                                       10                                                   7.7
                                                                                  London
                                                                                                                                                                  5.6
                                                                                                                                           5

                                                                                                                                           0
                                                                                                                                                               2018                        2028                2038
1.
2.
     Data as of 12/31/2018. NOI data based on In-Place UK SH Operating NOI. Please see Supplemental Reporting Measures for reconciliations at the end of this presentation.
     Comprises Seniors Housing Triple-Net and Seniors Housing Operating properties as of 12/31/2018.                                                                                                                        18
3.   Source: Office for National Statistics.
Urban Market Focus | Aging in Cities Survey
   Welltower-commissioned survey reaffirms current city dwellers desire to age in place

Seniors Wanting to Stay
in Their City
Boston                                                69%
Chicago                                               69%
Houston                                               66%
Los Angeles                                           67%

Miami                                                 70%
New York City                                         65%
San Francisco                                         71%
Seattle                                               68%
Toronto                                               73%
Washington D.C.                                       68%

   Source: Agingincities.com; Whereyoulivematters.org as of 9/25/2017.                    19
Urban Market Focus | Manhattan, NY
                                                   Meeting Significant Demand Growth

                                                                  Two Projects
                                                             underway for the vast,
                                                              highly under-served
                                                        aging population of Manhattan

                                                    Availability of
                                                    assisted living
                                                                              Only 70
                                                                             fully-licensed
Urban Market Focus | The Sumach by Chartwell, Toronto CA

          Development Details
         New independent living
          community located in
        Regent Park neighborhood
       the “gold standard”
           for urban revitalization

 12-story building with      Bistro-style
  332 units &                restaurant         Anticipated
  5,500 sq. ft.             for tenants and      Delivery
    of retail space        open to the public   Q2 2019

            A la carte services
                 to be offered
      (e.g., medication management and
                administration)
                                                              21
Urban Market Focus | The Wandsworth, London UK

                                      Project Overview

                                    Urban development to meet
                            significant and growing demand
                                         in London market

                    Assisted living &                   High end facilities
                     memory care                  offered onsite such as bistro
                    community located in        restaurant, activities lounges,
                   Wandsworth, London UK            emporium and library

                        6-story building with
                           98 units                         Best-in-class
                                                            luxury operator
  Anticipated         70,000 square feet
   Delivery
  Q1 2020

                                                                                  22
Welltower’s Unique Growth Platform
Outpatient Medical

                                     23
Health System Real Estate: A $1 Trillion Opportunity
                       Health Systems & Physicians Currently Own ~65% of Outpatient Medical Real Estate
                     WELL Ownership Offers Opportunity to Drive Efficiencies and Synergies Across Health Care

                                                                                                               5%
                                                                                                               Government/
                                                                                                               Other
                             Properties                           Total      Total
                                                                  Value     Sq. Feet   19%
                                                                                       Investor/Private
Hospital                            5,522                          $640B      1.6B

Outpatient                         32,158                          $372B      1.3B

                                                                                         11%                                 51%
TOTALS                             37,680                           $1.0T                                                    Health Systems
                                                                              2.9B       REIT

                                                                                                     14%
                                                                                                  Physician/
    Source: Revista; Fall 2018 Industry Outlook, data as of 12/31/2017.                            Provider                           24
Growing Relationships with Key Health System Partners
Strategic Health Care Alliances & Innovative Care Delivery Models

                                                                    25
Growing Relationships with Multispecialty Physician Groups
Approximately $1 billion invested with some of the nation’s premier providers

                Multispecialty clinics serve all the health care delivery needs in one convenient location
                                           and are vital health system partners

    1.5M sq ft                                    423K sq ft                                   130K sq ft
  100% occupied                                 100% occupied                                100% occupied
  Kelsey-Seybold Pasadena Clinic             Land O’ Lakes Administrative Building               Summit Florham Park

                                                                                                                       26
U.S. Outpatient Medical Portfolio

                                               $7.5B+                                        340+                       21M+
                                                  Invested(1)                             Properties(1)                Square Feet(1)
                                                                                                                                              95%
                                                                                                                                           HEALTH SYSTEM
                                                                                                                                            AFFILIATION(2)

                                                                                                                                              93%
                                                                                                                                        AVERAGE OCCUPANCY(2)

                                                                                                                                              96%
                                                                                                                                           OF PROPERTIES
                                                                                                                                            MANAGED(3)

1.   Data as of 12/31/2018 adjusted for CNL Acquisition.
2.
3.
     Data as of 12/31/2018. Please see Supplemental Reporting Measures at the end of this presentation.
     Data as of 12/31/2018, includes only multi-tenant properties and is measured as a percentage of square footage.
                                                                                                                                                             27
CNL Acquisition | National “Class A” MOB Portfolio
              •   National portfolio to be acquired for $1.25B                                            UT Cancer Center

              •   Initial cash yield is anticipated to be 5.7%
Transaction   •   Strategic expansion of outpatient medical and health system segments supported by
  Details         high quality and strong credit-backed cash flow

              •   Development opportunity on two acquisition sites with Cleveland Clinic and Summit
                  Medical Group
                                                                                                        Huntersville Physicians
              •   55 medical office building portfolio diversified across 16 states

  Portfolio   •   3.3 million square feet has significant overlap and synergies with existing
                  WELL footprint

 Highlights   •   Properties are 92% affiliated with premier health systems

              •   2.4% weighted average annual rent increase

                                                                                                         330 Physicians MOB
              •   Leveraged proprietary data science and analytics platform to identify opportunity
                  overlooked by market

  Unique      •   Portfolio affiliated with strong hospitals and health systems with zero exposure to
                  “at risk” hospitals based on WELL risk analysis
Perspective
              •   Properties located in high-potential markets based on proprietary predicted gross
                  rent and net need statistics

                                                                                                                                  28
CNL Acquisition | Quality Cash Flow with Investment Grade Credit

   On Campus & Affiliated                       Top Rated Credit               Calvert Medical Arts | Washington-Alexandria MSA
               92% Affiliated                   76%+ A-Rated Credit
                     8%                              10%
                              16%

                                     26%
           50%

                                                             90%
     Adj. to Campus
     Off-Ca mpus Aff.                            Investment Grade
     On-Campus                                   Non-Investment Grade
     Off-Ca mpus Non-Aff

     Geographic Diversity                    Top MSA Concentration               Red Bank Professional MOB | Cincinnati MSA
        Spread Over 16 States                  70%+ in Top 50 MSAs

                                                     17%
                               26%                                 28%
         37%
                                               13%

                                  12%

               7%          10%
                    8%                                      42%

     NC             CA           TX            Top 10              Top 10-50
     TN             FL           All Other     Top 50-100          Top 100+

All percentages based on budgeted NOI.
                                                                                                                                  29
Hammes Acquisition | Strategic Health System Affiliations
 Deploying Capital in “Class A” Outpatient Medical Portfolio and Driving Future Growth Opportunities

    Top Health System Tenants                      • 23 properties = 979,000 rentable sq. ft.
                 • 25k physicians                  • 12 metro markets
                 • 51 hospitals       Portfolio
                                                   • Average age 10 years
                                      Details
                 • 23 hospitals
                                                   • 96% affiliated with health systems
                 • 650 outpatient
                   facilities                      • 94% occupied
                 • 3.2k physicians
                 • 1.4m patients
                                                   • 150,000 sq. ft. of land for development at UNC
                 • 2.6k locations                  • Purchase Price of $391M
                                     Acquisition
                 • 165k associates
                                      Details
                                                   • Strengthens key relationships while introducing new
                 • 400 physicians                    health systems into the portfolio
                 • 14 hospitals

                                                                                                           30
Hammes Portfolio | Snapshot
        Providence Britton Plaza   Elmhurst Memorial Addison Health Center

                                          CHI St Luke’s The Vintage

                                                                             31
Atrium Development | “Class A+” Health Care Anchored Mixed-Use

           Development Details
  Innovative off-market investment
  will redefine outpatient health care delivery

   Two building, 5.5-acre
                        multi-phase
                development

 Adjacent to Carolinas       100% master-leased
Medical Center campus        by Atrium Health                    Anticipated
  with 286k sq. ft. of                                            Delivery
                              (Moody’s: Aa3)
future development           for 15 years with 2%                Q2 2020 &
     opportunities                increasers                      Q3 2020

   Buildings to house integrated specialty
   clinical practices for Atrium Health
including the Sanger Heart and Vascular Institute

                                                                           32
Transformational Joint Venture
Advanced Ambulatory Oncology Programs

               Strategic Health Care Alliances
• Built on a former parking lot at The Shops at Mission Viejo,
  a high-end mall owned by Simon Property Group
• Strategic joint venture with Mission Hospital, a 345-bed
  acute care hospital
• Mission is a member of the Providence St. Joseph Health
  System, which includes 111,000 employees, 50 hospitals,
  and 829 clinics across 7 states

                                                                 Anticipated
              Innovative Care Delivery Models                     Delivery
• 104,500 RSF, on-campus medical office building with 611-       June 2019
  space parking structure
• Long term ground lease with Simon Property Group, building
  master leased by St. Joseph Health Mission Hospital
• Anchor use will be specialized cancer care including an ASC,
  radiology, imaging, and 2-3 LINACs

                                                                               33
Real Estate Solutions Enabling Clinical Transformation
Clinical Network Expansion and Industry Leading Partnership

                                 ON CAMPUS
                                 Howard County General Hospital

                                 216,000 RSF in 2 MOBs on 14 acres,
                                 housing a variety of private multi-     Future Exploration
                                 specialty physician practices, health
                                 system employed and academic faculty    • Active dialog to develop alternative sites of
                                 practices                                 care in collaboration with Howard County
                                                                           General Hospital

                                 OFF CAMPUS                              Strategic Programs Collaboration
                                 Knoll North, Columbia MD
                                                                         • Framework for national seniors housing
                                 155,000 RSF in 2 MOBs on 30+ acres,       quality standards and thought leadership
                                 housing a variety of private multi-       led by diverse Hopkins steering committee
                                 specialty physician practices, health
                                 system employed and academic faculty
                                 practices

                                                                                                                    34
Welltower’s Unique Growth Platform
Health Systems

                                     35
Significant Opportunity to Increase Care Coordination in
Post-Acute Settings
                      New England Journal of Medicine Catalyst Survey Findings
    DEGREE OF CARE COORDINATION BETWEEN IP, POST-ACUTE, HOME SETTINGS
    % health system survey respondents (N=375)

                                          53%                            55%
                                                                         health system leaders
                                                                         recognize decreased
                                                                         readmissions is a benefit of a
                                                                         preferred post-acute network

                          30%
                                                                         77%
                                                                         health system leaders see poor
                                                                         integration with acute care
          7%                                              10%            providers as the greatest post-
                                                                         acute care industry challenge
           Fully           Mostly        Somewhat      Not coordinated
        coordinated      coordinated    coordinated

                                                                                                           36
Shift to Value-Based Care will Increase the Role of Post-
Acute Solutions
                                                                                        VARIATION IN MEDICARE FFS SPEND
                                                                                        % attributable by segment per beneficiary
                                                 projected annual growth of lives
                 20%                             under fully capitated risk models,
                                                 increasing from 9M lives to up to      Post-acute                          73
                                                 17M lives from 2017-20

                                                                                        Acute                     27
                                                 of variation in Medicare FFS
                 73%                             spending is attributed to post-acute
                                                 care, while only 27% is attributed
                                                 to acute-care                          Diagnostic tests     14

                                                 healthcare leaders plan to expand                           14
                 85%
                                                                                        Procedures
                                                 post-acute care partnerships in
                                                 order to maximize alternative
                                                 payment model reimbursement
                                                                                        Rx drugs            9

Source: Premier APM Survey, Centers for Medicare and Medicaid Services.                                                             37
Providers are Investing in and Engaging in Post-Acute
Ventures
   Direct ownership | Expanding regional / national footprint

    ▪   Propels ProMedica into the top 15 largest U.S. nonprofit health systems
        and scales its presence across full spectrum of care and 30 states

    ▪   Invested in a network of 5.5K+ senior care beds, 725K enrollees in
        PACE programs, with a joint-venture with Evolution to expand services

    ▪   Acquired a network of 70 post-acute assets across 9 states to form
        CHI Health at Home

    ▪   Brought together a network of 44 hospitals, 1,400+ physicians and
        200+ post-acute facilities into a national network

   Joint venture | Partnering to create post-acute solutions

    ▪   Created second largest provider of home care and hospice
        services in Western Pennsylvania

    ▪   Developed a network of 70+ facilities with OP, IP and home health
        rehabilitation service, recently expanding into Central TX

    ▪   Jointly launched Homespire, a private-duty home care model for
        Utah’s aging population

    ▪   Formed new post-acute care operations to serve San Diego and
        surrounding communities

  SOURCE: Press Releases (Representative, not exhaustive)
                                                                                  38
Welltower and ProMedica Innovative Strategic Partnership
     Partnership facilitates and redefines the care delivery value paradigm and continuum of care through a nationally
     integrated health system

                      First of its kind partnership between a REIT and health system which spans the full spectrum of care, including wellness,
                      captive insurer, post-acute, assisted living, memory care, hospice and home health

                      Propels ProMedica to top 15 U.S. health system with over ~$7B pro forma revenues and 70,000 employees across 700
                      locations in 30 states

                      Real estate partnership benefiting from a well-covered lease backed by an investment grade health system

                      ProMedica investing ~$400 million(1) in capex over the next 5 years in a well-located portfolio with an attractive cost basis

                                                                                                                                                      39
1.   Represents information provided by ProMedica.
Financial Summary
Primed for Growth

                    40
Balanced and Manageable Debt Maturity Profile
                                                                                    Weighted Average Maturity of 7.6 years
                                                                           Unsecured Debt          Pro Rata Secured Debt          Line of Credit          Wtd. Avg. Interest Rate

                 $3,500                                                                                                                                                                                              6%

                                                   5.00%                                                                                                                                                  5.03%
                 $3,000                                                                  4.86%
                                                                      4.59%                                                                                                                    4.48%                 5%
                                                                                                                              4.35%
                                4.03%                                                                                                                               4.17%
                 $2,500                                                                                                                          3.96%
                                                                                                           3.54%                                                                       3.64%                         4%

                 $2,000
                                                                                                                                                                                                                     3%
                 $1,500

                                                                                                                                                                                                                     2%
                 $1,000

                                                                                                                                                                                                                     1%
                   $500

                     $0                                                                                                                                                                                              0%

in millions                      2019               2020               2021              2022               2023               2024                2025              2026              2027    2028     Thereafter

Unsecured Debt                   $600               $677               $450              $600              $1,783              $400              $1,250              $700                —     $1,452    $1,788
Pro Rata Secured
                                 $466               $169               $278              $268               $244               $241                $569               $44              $160     $51       $216
Debt

Line of Credit                     —                 —                  —                  —               $1,147                —                  —                 —                  —       —         —

Total                           $1,066              $846               $728              $868              $3,174              $641              $1,819              $744              $160    $1,503    $2,004

    Data as of 12/31/2018 in USD. Represents pro rata principal amounts due and excluding unamortized premiums/discounts or other fair value adjustments as reflected on the balance sheet.                          41
Asset Backed Financing Supports Valuations
        Over 70% of portfolio is supported by secured financing with attractive pricing

                            Indicative Pricing Across WELL Asset Classes                                               GSE Seniors Housing Spreads vs Multifamily

        Segment                                                Issuer                  LTV           Spread bps(1)       36% Compression in Seniors Housing Spreads
                                                                                                                     45 bps

        US Seniors Housing                                      GSE              55% - 75%            116 – 130      40 bps

                                                                                                                     35 bps

        CAD Seniors Housing(2)                                CMHC                     75%             90 – 110
                                                                                                                     30 bps

                                                                                                                     25 bps
        Skilled Nursing                                         HUD                    75%             100 - 120

                                                                                                                     20 bps
                                                                                                                               Nov2012
                                                                                                                               Nov 12         Nov2015
                                                                                                                                              Nov 15        Nov2018
                                                                                                                                                            Nov 18

1.   Spread is based on 10 Year Fixed Rate Facility. Benchmark for spreads is 10 Yr US Treasuries.                                                                    42
2.   Benchmark for spreads is 10 Yr GoC bonds.
Significant Relative Outperformance
   Total Returns(1)                                                                          Welltower                    FNHEA Index                     RMZ Index

               100%
                  90%                                                                                                                                                                                                        +86.9%
                  80%
                  70%
                  60%
                                                                                                                                                                                                                             +62.9%
                  50%                                                                                                                                                                                                        +62.4%
                  40%
                  30%
                  20%
                  10%
                    0%
                                              4

                                                                                        5

                                                                                                                                   6

                                                                                                                                                                      7

                                                                                                                                                                                                       8
                         4

                                                                   5

                                                                                                              6

                                                                                                                                                     7

                                                                                                                                                                                      8

                                                                                                                                                                                                                        9
                                   4

                                                                             5

                                                                                                                        6

                                                                                                                                                              7

                                                                                                                                                                                               8
                                                        4

                                                                                                   5

                                                                                                                                             6

                                                                                                                                                                              7

                                                                                                                                                                                                               8
                                 -1

                                                                           -1

                                                                                                                      -1

                                                                                                                                                            -1

                                                                                                                                                                                             -1
                                                      -1

                                                                                                 -1

                                                                                                                                           -1

                                                                                                                                                                            -1

                                                                                                                                                                                                             -1
                                           l-1

                                                                                     l-1

                                                                                                                                l-1

                                                                                                                                                                     l-1

                                                                                                                                                                                                      l-1
                        1

                                                                  1

                                                                                                             1

                                                                                                                                                      1

                                                                                                                                                                                       1

                                                                                                                                                                                                                         1
                     n-

                                                               n-

                                                                                                          n-

                                                                                                                                                   n-

                                                                                                                                                                                    n-

                                                                                                                                                                                                                      n-
                               r

                                                                          r

                                                                                                                     r

                                                                                                                                                             r

                                                                                                                                                                                              r
                                                   ct

                                                                                             ct

                                                                                                                                        ct

                                                                                                                                                                            ct

                                                                                                                                                                                                             ct
                                        Ju

                                                                                  Ju

                                                                                                                             Ju

                                                                                                                                                                  Ju

                                                                                                                                                                                                   Ju
                            Ap

                                                                       Ap

                                                                                                                  Ap

                                                                                                                                                          Ap

                                                                                                                                                                                           Ap
                  Ja

                                                            Ja

                                                                                                       Ja

                                                                                                                                                Ja

                                                                                                                                                                                 Ja

                                                                                                                                                                                                                   Ja
                                                  O

                                                                                            O

                                                                                                                                       O

                                                                                                                                                                           O

                                                                                                                                                                                                            O
                                                                    Average Annual Return
                              15.08%                                  Since Inception (1)                                                          5.0%                      Dividend Yield                  (2)

1. Data as of 12/31/2018. Adjusted for stock splits. Total return assumes reinvestment of dividends.
                                                                                                                                                                                                                                  43
2. Data as of 12/31/2018. The dividend represents the approved dividend rate for 2019, subject to quarterly review by the Board of Directors.
Performance Driven Strategy

                                                                              Investment Grade
                                                                               Balance Sheet &
                                                                             Outstanding Access to
                                                                                    Capital
                                                           Significant and
                                                           Stable Dividend
                                                               Income

                                       Superior Internal
                                       & External Growth
                       Best-in-Class
                       Real Estate &
                        Operating
                         Partners
   Investment in the
  “Silver Economy” &
          Aging                                                                                      44
Commitment to Sustainability
and Governance

                               45
Recognized Leader in Environmental, Social, and Governance

           Only Healthcare REIT to be Listed to the
          2018 Dow Jones Sustainability World Index

                                                         46
Recognized Leader in Diversity & Inclusion

                                                                                                   TOP
           1        ST
                                                                                                    15                                                                             55%
        North American REIT to sign the                                                                             Most Diverse                                                                  Female and Minority
     Women’s Empowerment Principles                                                                           Fortune 1000 Companies                                                             Independent Director
and the CEO Action for Diversity & Inclusion                                                                          in Ohio(1)                                                           Leadership on the Board of Directors(2)

 1.   Based on the 2018 Ohio Fortune 1000 Corporate Governance Report administered by the National Diversity Council, which evaluates racial, ethnic and gender diversity of corporate executive leadership and board membership.
 2.   Proportion as of 12/31/2018.                                                                                                                                                                                                  47
Spotlight on Welltower’s Green Buildings
                 14                                                     8                                24               56                                 2
       LEED-Certified                                  BREEAM-Certified                          IREM-Certified     ENERGY STAR-                     EPC “A” Score
         Buildings                                        Buildings                                Buildings      Certified Buildings(1)               Buildings

                                                                        Sunrise of La Jolla                                                Sunrise East 56th
                                                                        ENERGY STAR score of 98,                                           One of few seniors housing
                                                                        signifying the property is 98%                                     properties to target LEED and
                                                                        more efficient than similar                                        International WELL Building
                                                                        buildings                                                          certifications

                                                                        The Wandsworth                                                     NYPHS Stamford MOB
                                                                        Targeting BREEAM Excellent                                         Powered by 100% renewable
                                                                        rating to be in top 10% for                                        electricity
                                                                        building sustainability

1.   Number of buildings with an ENERGY STAR label earned in current or prior years.                                                                                       48
Recognized For Sustainable Business Practices
                                                                                                                                                                                         ISS Governance Score(2)
                                                                                                                                                                   8
                                                                                                                                                                                              6.1
                                                                                                                                                                   6

                                                                                                                                                                   4                                                                  3.0
                                                                                                                                                                   2
     14,600 MWh                                         Consumed                                           Avoided 8,883
      reduction                                         24,721 MWh                                         metric tons of                                          0                                     (3)

        in energy                                   of renewable electricity                                    greenhouse gas                                                             Peers                                 Welltower Inc.
      consumption(1)                                       in 2018                                                emissions(1)                                    Lower Risk                                                                Higher Risk

                                                                                                         Our Giving At Work

                                                                                 7,000 Meals                                                                     21,501 K-12                                                                82%
$600,000                                                                          to homebound                                                                   Tours to the                                                           employee
                                                                                    elderly New                                                              Toledo Museum of                                                          participation
Donated in 2018
                                                                                 Yorkers through                                                                Art aimed at                                                           in the 2018
       Including:                                                                  City Meals on                                                                                                                                       United Way
                                                                                                                                                              enhancing visual
                                                                                      Wheels                                                                      literacy                                                              Campaign
1.   Reductions in 2017 as compared to 2016 for properties where utility data was available.
2.   ISS Governance Score is a weighted average of scores assigned for (a) board structure, (b) compensation, (c) shareholder rights and (d) audit.
3.   Ventas (VTR), HCP, Crown Castle International (CCI), Equinix (EQIX), Iron Mountain (IRM), Weyerhaeuser Company (WY), American Tower Corporation (AMT), Boston Properties (BXP), Equity Residential (EQR), Prologis (PLD),                      49
     Public Storage (PSA), Simon Property Group (SPG), Vornado Realty Trust (VNO), AvalonBay Communities (AVB), Alexandria Real Estate Equities (ARE).
Appendix

           50
Growth Platform Driving the Future of Health Care Delivery
                                                                                               63% Seniors Housing(2)
                                                                          (Independent Living, Assisted Living & Memory Care)
                                                    •      Invest in top metro markets with high barriers to entry
                                                    •      Strategic partnerships with best-in-class, privately held operators
                                                    •      Scale that drives efficiencies across assisted living and memory care platforms
Portfolio Mix(1)                                    •      Increased NOI and operational upside from partnership management philosophy

                                                                                              20% Outpatient Medical
                                                    •      Full service outpatient medical group managing over 21M square feet of space
                                                                                                                                                                                             Capital-efficient,
                                                    •      95.3% affiliated with health systems as a percentage of NOI(3)                                                                   sustainable growth
                                                    •      Growing MOB portfolio at the forefront of evolving care delivery
                                                                                                                                                                                           supporting long-term
                                                                                                                                                                                              stable income
                                                                                                      7% Health System
                                                    •      Strategic joint venture with ProMedica comprised of 218 properties
                                                    •      Establishes strong credit support for future growth with innovative and
                                                           diversified major health system

                                                                                10% Long-Term, Post-Acute Care
                                                    •      Selective investments in higher acuity/higher impact skilled nursing facilities
                                                           (e.g., Powerback model)
                                                    •      Right size exposure to NOI and balance sheet

  1.   Based on In-Place NOI for 4Q18 with pro forma adjustments for the recently announced CNL Acquisition. Please see Supplemental Reporting Measures at the end of this presentation.
  2.
  3.
       Comprises Seniors Housing Triple-Net and Seniors Housing Operating properties.
       Excludes pro forma adjustments for the recently announced CNL Acquisition.
                                                                                                                                                                                                             51
Outpatient Will Continue to Dominate Care Delivery
                                                                                                                                                                           Outpatient Visits           Inpatient Admissions
 60%

 50%

 40%

 30%

 20%

 10%

    0%
                1999           2000          2001           2002          2003           2004          2005           2006          2007           2008          2009        2010    2011      2012   2013   2014   2015   2016

                                                                 51% increase in outpatient visits since 1999,
                                                              compared with a 3% increase in inpatient admissions

Source: American Hospital Association 2018 Hospital Statistics Report; data represents the change in inpatient admissions and outpatient visits for Community Hospitals.                                                      52
Procedures Driving Outpatient Medical Growth
                                                                                Segment Demand Growth: 2017 - 2027
                                                                                                                                                 31.8%
Ophthalmology
                                                  -8.3%
                                                                                                7.4%
  Gynecology
                                                         -6.2%
                                                                                                                               21.4%
   Cardiology
                                                            -5.4%
                                                                                                                                                         35.1%
     Vascular
                                                     -7.3%
                                                                                                                                                     34.7%
            ENT
                                                                          -1.1%
                                                                                       3.0%
  Orthopedics
                                                                                               7.2%
                                                                                                                    16.8%
    Obstetrics
                                                                                          5.1%
                                                                                                          12.2%
    Oncology
                                                                                                       10.4%
                                                                                                                                                                       41.6%
    Neurology
                                                                                                      9.9%
                                                                                                                                 23.2%
 Neurosurgery
                                                                                                                                         28.0%
                  -20%                              -10%                          0%              10%                    20%             30%                     40%           50%

                                                                                              Outpatient     Inpatient

   Source: Advisory Board Outpatient/Inpatient Volume Report as of 4/23/2018.                                                                                                        53
Superior Assets Lead to Superior Operating Results
        US Seniors Housing

                                                      Welltower US    HC REIT       Public            Industry
                                                        RIDEA(1)       Peers(2)    Operators(3)     Benchmarks

                                   Property Age
                                                          16            19(4)         20(4)              20(5)
                                   Years

                                   Housing Value
                                                        $573,246     $244,284(4)   $216,911(4)       $226,495(6)
                                   Median

                                   Household Income
                                                        $96,170      $64,663(4)    $61,049(4)         $63,174(6)
                                   Median

                                   REVPOR
                                                         $6,784       $4,208(7)     $4,333(7)          $4,803(5)
                                   Monthly

                                   SSREVPOR Growth
                                                         2.0%          1.7%(7)       1.1%(7)           2.7%(5)
                                   Year-over-year

                                   SSNOI per Unit
                                                        $23,636      $12,554(7)    $11,592(7)         $18,930(8)
                                   Annual

                                   SSNOI Growth
                                                         (0.2%)       (4.0%)(7)     (6.0%)(7)     Data Not Available
                                   Year-over-year

See following page for all footnotes.                                                                                  54
Detailed Footnotes
1. Data as of 12/31/2018 for properties included in the seniors housing operating segment. Property age, housing value and household income are NOI-weighted as of December 31, 2018.
   The median housing value and household income is used for the US, and the average housing value and household income is used for the UK. Housing value, household income and
   population growth are based on a 3-mile radius. Growth figures represent average performance of Welltower's same store portfolio. REVPOR is based on total 4Q18 results. Please see
   Supplemental Reporting Measures and reconciliations at the end of this presentation.
2. Average Trailing 4 quarters as of 9/30//2018 results for the following peers: HCP, SNR, SNH, SBRA, and VTR. Housing value and household income are based on 5-mile radius median
   data.
3. Average Trailing 4 quarters as of 9/30/2018 results for the following publicly traded seniors housing operators: BKD, CSU and FVE. Housing value and household income are based on 5-
   mile radius median data.
4. Derived or obtained from BofAML research reports, NIC, Claritas, and/or publicly available documents.
5. Per NIC 3Q18 Majority AL properties in primary and secondary markets.
6. US Median per Claritas 2019.
7. Derived or obtained from publicly available documents as of 3Q18.
8. The State of Seniors Housing 2017. Represents 2016 results.

                                                                                                                                                                                           55
Superior Assets Lead to Superior Operating Results
        Outpatient Medical
                                                                                                                                                  Outpatient
                                                                                                                               Welltower (1)
                                                                                                                                                Medical Peers (2)

                                                             Occupancy                                                             93%                91%

                                                             Average Property Size                                                63,503             62,423
                                                             Square Feet

                                                             Health System Affiliation(3)                                          95%                95%

                                                             NOI per Square Foot                                                  $22.18             $17.91
                                                             Annualized

                                                             Lease Expirations(4)                                                  26%                45%
                                                             Through 2021

                                                             In-house Managed(5)                                                   96%         Data Not Available

1. Data as of 12/31/2018. Please see Supplemental Reporting Measures and reconciliations at the end of this presentation.
2. Data obtained from publicly available documents for the following peers: HCP, HTA, HR, VTR. Peer data is as of 9/30/2018.
3. Welltower percentage based on NOI. Peers based on square feet.
4. Based on occupied square feet.
5. As a percentage of square feet. Includes only multi-tenant properties.                                                                                           56
Superior Assets Lead to Superior Operating Results
    Post-Acute and Long-Term Care
                                                                                       WELLTOWER                                  HC REIT                                 Public                                 Industry
                                                                                        PAC/LTC (1)                               Peers (2)                             Operators (3)                          Benchmarks (4)

                             Property Age                                                       19                                    36                                       32                                        39
                             Years

                             Occupancy                                                         81%                                   81%                                      83%                                      82%

                             Quality Mix                                                     67%(5)                                  45%                                      49%                                      51%

                                                                                                                                                                          Data                                     Data
                             EBITDARM Coverage                                              1.70x(5)                                1.66x
                                                                                                                                                                      Not Available                            Not Available

                             EBITDARM per Bed                                                                                                                                                                      Data
                                                                                            $21,389                               $15,620                                  $14,057
                             Annual                                                                                                                                                                            Not Available

1. Welltower data as of 12/31/2018 for stable portfolio. EBITDARM Coverage and EBITDARM per bed figures represent trailing twelve months results. EBITDARM represents earnings before interest, taxes, depreciation, amortization, rent
and management fees. The company uses unaudited, periodic financial information provided solely by tenants/borrowers to calculate EBITDARM and has not independently verified the information.
2. Average TTM 3Q18 results obtained from publicly available documents for the following peers: OHI, VTR (SNF only), QCP, LTC and SBRA. Quality mix excludes SBRA.
3. Average TTM 3Q18 results obtained from publicly available documents for the following publicly traded skilled nursing operators: GEN, DVCR, ENSG, and NHC. Quality mix excludes NHC.
4. Property age per 3Q18 NIC MAP for Majority NC Properties in the primary and secondary markets; occupancy and quality mix per NIC Skilled Nursing Data Report, June 2018.
5. Per 4Q18 Supplement.                                                                                                                                                                                                                   57
Supplemental Reporting Measures

                                  58
Non-GAAP Financial Measures
Welltower Inc. believes that revenues, net income and net income attributable to common stockholders (NICS), as defined by U.S.
generally accepted accounting principles (U.S. GAAP), are the most appropriate earnings measurements. However, the company
considers Net Operating Income (NOI), In-Place NOI (IPNOI), Same Store NOI (SSNOI), Revenues per Occupied Room (REVPOR),
and Same Store REVPOR (SS REVPOR) to be useful supplemental measures of its operating performance. These supplemental
measures are disclosed on a Welltower pro rata ownership basis.

Pro rata amounts are derived by reducing consolidated amounts for minority partners’ noncontrolling ownership interests and adding
Welltower’s minority ownership share of unconsolidated amounts. Welltower does not control unconsolidated investments. While the
company considers pro rata disclosures useful, they may not accurately depict the legal and economic implications of Welltower’s joint
venture arrangements and should be used with caution.

Welltower’s supplemental reporting measures and similarly entitled financial measures are widely used by investors, equity and debt
analysts and rating agencies in the valuation, comparison, rating and investment recommendations of companies. Welltower’s
management uses these financial measures to facilitate internal and external comparisons to historical operating results and in making
operating decisions. Additionally, these measures are utilized by the Board of Directors to evaluate management.

None of the supplemental reporting measures represent net income or cash flow provided from operating activities as determined in
accordance with U.S. GAAP and should not be considered as alternative measures of profitability or liquidity. Finally, the supplemental
reporting measures, as defined by Welltower, may not be comparable to similarly entitled items reported by other real estate investment
trusts or other companies. Multi-period amounts may not equal the sum of the individual quarterly amounts due to rounding.

                                                                                                                                          59
NOI, IPNOI, SSNOI, REVPOR and SS REVPOR
Net operating income (NOI) is used to evaluate the operating performance of our properties. We define NOI as total revenues, including tenant reimbursements, less property
operating expenses. Property operating expenses represent costs associated with managing, maintaining and servicing tenants for our seniors housing operating and
outpatient medical properties. These expenses include, but are not limited to, property-related payroll and benefits, property management fees paid to operators, marketing,
housekeeping, food service, maintenance, utilities, property taxes and insurance. General and administrative expenses represent costs unrelated to property operations. These
expenses include, but are not limited to, payroll and benefits, professional services, office expenses and depreciation of corporate fixed assets.
In-Place NOI (IPNOI) represents NOI excluding interest income, other income and non-IPNOI and adjusted for timing of current quarter portfolio changes such as acquisitions,
development conversions, segment transitions, dispositions and investments held for sale.
SSNOI is used to evaluate the operating performance of our properties using a consistent population which controls for changes in the composition of our portfolio. As used
herein, same store is generally defined as those revenue-generating properties in the portfolio for the relevant year-over-year reporting periods. Land parcels, loans, and sub-
leases as well as any properties acquired, developed/redeveloped (including major refurbishments where 20% or more of units are simultaneously taken out of commission for
30 days or more), sold or classified as held for sale during that period are excluded from the same store amounts. Properties undergoing operator transitions and/or segment
transitions (except triple-net to seniors housing operating with the same operator) are also excluded from the same store amounts. Normalizers include adjustments that in
management’s opinion are appropriate in considering SSNOI, a supplemental, non-GAAP performance measure. None of these adjustments, which may increase or decrease
SSNOI, are reflected in our financial statements prepared in accordance with U.S. GAAP. Significant normalizers (defined as any that individually exceed 0.50% of SSNOI
growth per property type) are separately disclosed and explained.
REVPOR represents the average revenues generated per occupied room per month at our seniors housing operating properties. It is calculated as our pro rata version of total
resident fees and services revenues from the income statement divided by average monthly occupied room days. SS REVPOR is used to evaluate the REVPOR performance of
our properties under a consistent population which eliminates changes in the composition of our portfolio. It is based on the same pool of properties used for SSNOI and
includes any revenue normalizations used for SSNOI. The company uses REVPOR and SS REVPOR to evaluate the revenue-generating capacity and profit potential of its
seniors housing operating portfolio independent of fluctuating occupancy rates. They are also used in comparison against industry and competitor statistics, if known, to
evaluate the quality of our seniors housing operating portfolio.
We believe NOI, IPNOI, SSNOI, REVPOR and SS REVPOR provide investors relevant and useful information because they measure the operating performance of our
properties at the property level on an unleveraged basis. We use these metrics to make decisions about resource allocations and to assess the property level performance of
our properties.

                                                                                                                                                                                   60
Historical In-Place NOI Reconciliations
(dollars in thousands)
                                                                            4Q18                      4Q17         In-Place NOI by country                  4Q18                     4Q17
Net income (loss)                                                     $      124,696         $          (89,743)   United States                   $   1,743,200  83.3%     $   1,657,642  82.9%
Loss (gain) on real estate dispositions, net                                  (41,913)                  (56,381)   Canada                                174,552   8.4%           169,667   8.5%
Loss (income) from unconsolidated entities                                       (195)                   59,449    United Kingdom                        174,428   8.3%           172,195   8.6%
Income tax expense (benefit)                                                    1,504                    25,663        Total In-Place NOI          $   2,092,180 100.0%     $   1,999,504 100.0%
Other expenses                                                                 10,502                    60,167
Impairment of assets                                                           76,022                    99,821    In-Place NOI by property type
Provision for loan losses                                                          —                     62,966    Seniors Housing Operating       $     965,408    46.1%   $     888,084    44.4%
Loss (gain) on extinguishment of debt, net                                         53                       371    Seniors Housing Triple-net            411,428    19.7%         523,112    26.2%
Loss (gain) on derivatives and financial instruments, net                       1,626                        —     Outpatient Medical                    366,820    17.5%         336,544    16.8%
General and administrative expenses                                            31,101                    28,365    Health System                         143,200     6.8%              —       —%
Depreciation and amortization                                                242,834                   238,458     Long-Term/Post-Acute Care             205,324     9.8%         251,764    12.6%
Interest expense                                                             144,369                   127,217         Total In-Place NOI          $   2,092,180   100.0%   $   1,999,504   100.0%
Consolidated net operating income                                     $      590,599         $         556,353
NOI attributable to unconsolidated investments(1)                              21,933                    21,539
NOI attributable to noncontrolling interests(2)                               (40,341)                  (29,760)
Pro rata net operating income (NOI)                                   $      572,191         $         548,132

Adjust:
Interest income                                                       $       (13,082)       $          (11,975)
Other income                                                                   (7,092)                   (1,937)
Sold / held for sale                                                          (12,724)                  (25,601)
Developments / land                                                               545                        —
Non In-Place NOI(3)                                                           (21,892)                  (10,278)
Timing adjustments(4)                                                           5,099                     1,535
Total adjustments                                                             (49,146)                  (48,256)
In-Place NOI                                                                  523,045                   499,876
Annualized In-Place NOI                                               $     2,092,180        $        1,999,504

(1) Represents Welltower's interest in joint ventures where Welltower is the minority partner.
(2) Represents minority partners' interest in joint ventures where Welltower is the majority owner.
(3) Primarily represents non-cash NOI
(4) Represents timing adjustments for current quarter acquisitions, construction conversions and segment transitions.                                                                                61
Pro Forma In-Place NOI Reconciliation
(dollars in thousands)
                                                                            4Q18                                                                      Pro Forma
                                                                        Annualized In-                                  CNL Portfolio               Annualized In-         % of
                                                                         Place NOI(1)          % of Total               Acquisition(2)                Place NOI            Total
Seniors Housing Operating                                              $       965,408               46.2 %         $                    —          $     965,408          44.7 %
Seniors Housing Triple-Net                                                     411,428               19.7 %                               —               411,428          19.0 %
Outpatient Medical                                                             366,820               17.5 %                          71,250               438,070          20.2 %
Health System                                                                  143,200                6.8 %                              —                143,200           6.6 %
Long-Term/Post-Acute                                                           205,324                9.8 %                              —                205,324           9.5 %
                                                                       $     2,092,180             100.0 %          $                71,250         $   2,163,430         100.0 %

Notes:
(1) Please refer to "Historical In-Place NOI Reconciliations" for a reconciliation of In-Place NOI to net income.
(2) Pro forma adjustment to reflect the $1.25 billion CNL Portfolio acquisition as if the transaction occurred on October 1, 2018. See pages 28-29 of this presentation
for further information on the transaction in addition to our press release dated January 2, 2019. Pro forma adjustments are based on estimates and assumptions
and are preliminary in nature, and should not be assumed to be in indication of the results that would have been achieved had the transaction been completed as of
the date indicated.

                                                                                                                                                                                    62
In-Place NOI Concentration Reconciliations
          $s in thousands at Welltower              % of SHO          % of          Seniors Housing        Seniors Housing      Outpatient          Health            Long-Term/Post-                      % of        % of
                Prorata ownership                  by Country         SHO             Operating              Triple-net          Medical            System              acute Care        Total            Total      Country
New York                                                  12.1%            9.0% $               21,797 $              6,922 $           2,828 $               866 $             2,138 $           34,551       6.6%        7.9%
Los Angeles                                               14.5%           10.8%                 26,183                 426              6,358                 104                  —              33,071       6.3%        7.6%
Philadelphia                                               2.9%            2.1%                  5,161                 117              6,089                2,992              6,492             20,851       4.0%        4.8%
Boston                                                     8.3%            6.3%                 15,088                  —                    293               —                  535             15,916       3.0%        3.7%
Dallas                                                     2.9%            2.2%                  5,312                5,375             7,149                 182                 952             18,970       3.6%        4.4%
Seattle                                                    3.5%            2.6%                  6,286                1,875             3,557                 391                  —              12,109       2.3%        2.8%
Washington D.C.                                            3.9%            2.9%                  7,093                 525                   219             2,735                871             11,443       2.2%        2.6%
Chicago                                                    2.8%            2.1%                  5,070                2,976             1,279                2,352                369             12,046       2.3%        2.8%
San Francisco                                              5.3%            4.0%                  9,557                2,137                   —              1,052                 —              12,746       2.4%        2.9%
Houston                                                    1.7%            1.3%                  3,116                1,515             5,907                  —                   —              10,538       2.0%        2.4%
San Diego                                                  3.7%            2.8%                  6,750                  —                    367               —                  695              7,812       1.5%        1.8%
San Jose                                                   2.3%            1.7%                  4,179                  —                    478              514                  —               5,171       1.0%        1.2%
Other Top 31 US MSAs and Coastal States                   33.1%           24.8%                 59,936              32,221             37,296            16,194                20,490         166,137         31.8%       38.1%
Other United States                                        3.0%            2.3%                  5,344              28,605             14,932                8,418             17,139             74,438      14.3%       17.0%
      Total United States                               100.0%            74.9% $             180,872 $             82,694 $           86,752 $          35,800 $              49,681 $       435,799         83.3%      100.0%

Toronto                                                   24.2%            4.1% $                9,948 $                — $                   — $              — $                 — $             9,948       1.9%       22.8%
Calgary                                                    5.4%            0.9%                  2,228                  —                     —                —                1,650              3,878       0.7%        8.9%
Montréal                                                  16.3%            2.8%                  6,710                  —                     —                —                   —               6,710       1.3%       15.4%
Ottawa                                                    11.1%            1.9%                  4,571                  —                     —                —                   —               4,571       0.9%       10.5%
Vancouver                                                  7.4%            1.3%                  3,047                 352                    —                —                   —               3,399       0.6%        7.8%
Edmonton                                                   2.6%            0.4%                  1,068                  —                     —                —                   —               1,068       0.2%        2.4%
Québec                                                     4.7%            0.8%                  1,935                  —                     —                —                   —               1,935       0.4%        4.4%
Winnipeg                                                   3.5%            0.6%                  1,452                  —                     —                —                   —               1,452       0.3%        3.3%
Hamilton                                                   1.4%            0.2%                    556                  —                     —                —                   —                556        0.1%        1.3%
Kitchener                                                  1.2%            0.2%                    485                  —                     —                —                   —                485        0.1%        1.1%
Remaining Canada                                          22.2%            3.8%                  9,145                 491                    —                —                   —               9,636       1.8%       22.1%
      Total Canada                                      100.0%            17.0% $               41,145 $               843 $                  — $              — $              1,650 $           43,638       8.3%      100.0%

Greater London                                            65.1%            5.2% $               12,581 $              8,618 $           4,953 $                — $                 — $            26,152       5.0%       60.0%
Other Southern England                                    22.5%            1.8%                  4,357                7,222                   —                —                   —              11,579       2.2%       26.6%
Other United Kingdom                                      12.4%            1.1%                  2,397                3,480                   —                —                   —               5,877       1.2%       13.4%
      Total United Kingdom                              100.0%             8.1% $               19,335 $            19,320 $            4,953 $                — $                 — $            43,608       8.4%      100.0%

Total In-Place NOI(1)                                                   100.0% $              241,352 $             102,857 $          91,705 $          35,800 $              51,331 $       523,045        100.0%
(1) Please refer to "Historical In-Place NOI Reconciliations" for a reconciliation of In-Place NOI to net income.                                                                                                                 63
SHO REVPOR Reconciliation
(dollars in thousands, except REVPOR, SS REVPOR and SSNOI/unit)

SHO REVPOR Reconciliation                                                            United States             United Kingdom         Canada               Total

Consolidated SHO revenues                                                        $            666,566      $           80,470     $      114,579       $      861,615

Unconsolidated SHO revenues attributable to Welltower(1)                                       23,519                      —              20,422               43,941

SHO revenues attributable to noncontrolling interests(2)                                       (39,058)                 (6,568)           (25,574)             (71,200)

Pro rata SHO revenues                                                                          651,027                  73,902            109,427             834,356

SHO interest and other income                                                                      (887)                   (31)                (304)               (1,222)

SHO revenues attributable to held for sale properties                                          (20,203)                 (1,224)                 —              (21,427)

Currency and ownership adjustments(4)                                                                —                   3,592             6,235                   9,827

SHO local revenues                                                                            629,937                  76,239            115,358              821,534

Average occupied units/month                                                                   30,701                   2,909             13,244               46,854

REVPOR/month in USD                                                              $               6,784     $            8,663     $        2,880       $           5,797
                                                                                                                                  C
REVPOR/month in local currency(4)                                                                          £            6,417     $        3,600

(1) Represents Welltower's interest in joint venture properties in which Welltower is the minority owner.
(2) Represents minority partners' interest in joint venture properties in which Welltower is the majority partner.
(3) Based on GBP/USD rate of 1:1.35 and USD/CAD rate of 1.25:1.

                                                                                                                                                                             64
SHO Same Store Reconciliations
                                                                                        United States                                    United Kingdom                                           Canada                                               Total
                                                                              4Q17                      4Q18                     4Q17                     4Q18                      4Q17                     4Q18                      4Q17                     4Q18
SHO SS REVPOR Growth
Consolidated SHO revenues                                            $            544,735      $           666,566       $            75,745      $            80,470       $          110,308       $           114,579      $             730,788       $         861,615
Unconsolidated SHO revenues attributable to WELL(1)                                21,787                   23,519                        —                        —                    21,018                    20,422                     42,805                  43,941
SHO revenues attributable to noncontrolling interests(2)                           (41,809)                 (39,058)                   (5,185)                  (6,568)                 (25,934)                  (25,574)                   (72,928)                (71,200)
SHO pro rata revenues(3)                                                          524,713                  651,027                    70,560                   73,902                  105,392                   109,427                    700,665                 834,356
Non-cash revenues on same store properties                                             (85)                     (59)                      (19)                     (19)                        —                        —                        (104)                   (78)
Revenues attributable to non-same store properties                                 (49,609)                (116,070)                  (14,864)                 (15,962)                    (2,672)                  (9,130)                   (67,145)              (141,162)
Currency and ownership adjustments(4)                                                   36                        —                      959                      2,862                    1,703                    5,732                      2,698                   8,594
SH-NNN to SHO conversions (5)                                                        48,017                       —                        —                         —                         —                        —                      48,017                     —
Other normalizing adjustments(6)                                                       611                      730                    (1,351)                    (411)                      —                         —                        (740)                    319
SHO SS revenues(7)                                                                523,683                  535,628                    55,285                   60,372                  104,423                   106,029                    683,391                 702,029
Avg. occupied units/month(8)                                                       24,637                   24,696                      2,218                    2,381                   11,824                   11,799                      38,679                 38,876
SHO SS REVPOR(9)                                                     $              7,028      $             7,171       $              8,241     $              8,383      $             2,920      $             2,971      $                5,841      $           5,970
SS REVPOR YOY growth                                                                     —%                       2.0%                      —%                      1.7%                       —%                      1.7%                        —                     2.2%

SHO SSNOI Growth
Consolidated SHO NOI                                                 $            165,437      $           191,493       $            19,447      $            20,032       $            41,624      $            42,920      $             226,508       $         254,445
Unconsolidated SHO NOI attributable to WELL(1)                                       7,892                     8,412                       —                         —                     8,165                    8,054                     16,057                 16,466
SHO NOI attributable to noncontrolling interests(2)                                  (9,231)                   (8,360)                   (209)                     (958)                   (9,893)                  (9,649)                   (19,333)               (18,967)
SHO pro rata NOI(3)                                                               164,098                  191,545                    19,238                   19,074                    39,896                   41,325                    223,232                 251,944
Non-cash NOI on same store properties                                                (856 )                    (549)                      (19)                     (19)                      —                         0                       (875 )                   (568)
NOI attributable to non-same store properties                                      (12,348)                 (25,657)                    (3,507)                  (2,804)                    (538)                   (3,042)                   (16,393)               (31,503)
Currency and ownership adjustments(4)                                                   3                        —                        279                       806                     650                     2,196                        932                   3,002
SH-NNN to SHO conversions(5)                                                       15,413                         —                        —                        —                         —                        —                      15,413                     —
Other normalizing adjustments(6)                                                      600                      1,230                     (597 )                   (411 )                      —                       (24 )                        3                    795
SHO pro rata SSNOI(7)                                                             166,910                  166,569                    15,394                     16,646                  40,008                   40,455                      222,312               223,670
SHO SSNOI growth                                                                                                (0.2)%                                              8.1 %                                             1.1 %                                              0.6 %

SHO SSNOI/Unit
Trailing four quarters' SSNOI(7)                                                               $           668,829                                $              64,803                              $            160,260                                 $         893,892
Average units in service(10)                                                                                28,297                                              2,829                                             13,073                                             44,199
SSNOI/unit in USD                                                                              $            23,636                                $            22,907                                $            12,259                                  $          20,224
SSNOI/unit in local currency(4)                                                                                                                                  £16,968                                         C$15,324

  Notes:
  (1) Represents Welltower's interests in joint ventures where Welltower is the minority partner.
  (2) Represents minority partners' interests in joint ventures where Welltower is the majority partner.
  (3) Represents SHO revenues/NOI at Welltower pro rata ownership.
  (4) Includes where appropriate adjustments to reflect consistent property ownership percentages, to translate Canadian properties at a USD/CAD rate of 1.25 and to translate UK properties at a GBP/USD rate of 1.35.
  (5) Represents the revenues and NOI of certain properties that were converted from Seniors Housing Triple-net to Seniors Housing Operating with the same operator. Amounts derived from unaudited operating results provided by the operator and were not a component of WELL
  earnings.
  (6) Represents aggregate normalizing adjustments which are individually less than .50% of SSNOI growth.
  (7) Represents SS SHO revenues/SSNOI at Welltower pro rata ownership.
  (8) Represents average occupied units for SS properties related solely to referenced country on a pro rata basis.
  (9) Represents pro rata SS average revenues generated per occupied room per month.
  (10) Represents average units in service for SS properties related solely to referenced country on a pro rata basis.

                                                                                                                                                                                                                                                                                  65
Outpatient Medical NOI Reconciliations
(dollars in thousands, except per square foot)                             Three Months Ended
                                                                            December 31, 2018
                                                                                  Total
OM revenues                                                               $           134,844
OM property operating expenses                                                         (40,136)
OM NOI                                                                    $             94,708
OM NOI margin                                                                             70.2%

OM NOI                                                                    $                94,708
Less: In-Place NOI adjustments                                                             (3,003)
OM In-Place NOI                                                                            91,705
OM In-Place NOI Annualized                                                $               366,820

OM NOI                                                                    $                 94,708

Total square feet                                                                      17,947,619
Pro rata adjustments(1)                                                                  (865,818)
Pro rata rental square feet                                                            17,081,801

OM NOI per square foot annualized                                         $                  22.18

OM NOI                                                                    $                 94,708
Non health system affiliated NOI                                                            (4,412)
OM health system affiliated NOI                                           $                 90,296
OM health system affiliated NOI %                                                             95.3%

Unless otherwise noted, amounts presented on Welltower pro rata ownership basis. See "Historical
In-Place NOI Reconciliations" for reconciliation to net operating income from continuing operations.
(1) Represents amounts attributable to joint venture partners, both unconsolidated and noncontrolling.

                                                                                                         66
You can also read