Evaluation of grain boundaries as percolation pathways in quartz rich continental crust using Atomic Force Microscopy
←
→
Page content transcription
If your browser does not render page correctly, please read the page content below
www.nature.com/scientificreports
OPEN Evaluation of grain boundaries
as percolation pathways
in quartz‑rich continental crust
using Atomic Force Microscopy
Ritabrata Dobe1, Anuja Das2, Rabibrata Mukherjee2 & Saibal Gupta1*
Hydrous fluids play a vital role in the chemical and rheological evolution of ductile, quartz-bearing
continental crust, where fluid percolation pathways are controlled by grain boundary domains. In
this study, widths of grain boundary domains in seven quartzite samples metamorphosed under
varying crustal conditions were investigated using Atomic Force Microscopy (AFM) which allows
comparatively easy, high magnification imaging and precise width measurements. It is observed
that dynamic recrystallization at higher metamorphic grades is much more efficient at reducing grain
boundary widths than at lower temperature conditions. The concept of force-distance spectroscopy,
applied to geological samples for the first time, allows qualitative estimation of variations in the
strength of grain boundary domains. The strength of grain boundary domains is inferred to be higher
in the high grade quartzites, which is supported by Kernel Average Misorientation (KAM) studies
using Electron Backscatter Diffraction (EBSD). The results of the study show that quartzites deformed
and metamorphosed at higher grades have narrower channels without pores and an abundance of
periodically arranged bridges oriented at right angles to the length of the boundary. We conclude that
grain boundary domains in quartz-rich rocks are more resistant to fluid percolation in the granulite
rather than the greenschist facies.
A number of mechanisms have been proposed in material and geological sciences to explain how fluids percolate
through a medium under ductile and brittle c onditions1–10. Most postulated mechanisms agree that in a 3-dimen-
sional material framework, grain/phase boundaries play a major role in fluid percolation7,11,12. In the metallurgical
and material sciences, it is well known that fluid percolation leads to corrosion or cracking; to circumvent these
effects, attempts have been made to impart certain beneficial characteristics to the grain boundary network and
make the material more resistant, a process referred to as ‘Grain Boundary Engineering (GBE)’13,14. In general,
resistance to corrosion is controlled by the presence of ‘Coincident Site Lattice (CSL)’ boundaries between grains,
which are basically high angle grain boundaries with additional periodic matches on lattice sites determined by
a particular axis and angle of mismatch15 which impart certain ‘special’ properties to materials. In such cases, it
has been suggested that small deformation followed by annealing (single step or iterative) may improve grain
boundary properties, by increasing the proportion of CSL boundaries16,17.
In the geological sciences, fluid percolation has been investigated in mono-mineralic rocks like quartzites,
as the mineral quartz constitutes much of the continental crust. Kruhl et al.2 estimated variations in the widths
of grain boundary domains in quartzites metamorphosed at different metamorphic grades using a Transmitted
Electron Microscope (TEM). While TEM is a very high resolution and high magnification technique, it is destruc-
tive in nature and involves an elaborate sample (wafer) preparation technique using a Focussed Ion Beam (FIB),
which limits both its accessibility and convenience. In this study, we suggest Atomic Force Microscopy (AFM)
as an alternative non-destructive method to study grain boundary morphology in geological materials. AFM
enables nano-scale imaging of a sample surface directly from a thin section and gives additional information
about the depth profile. While surface morphology imaging using AFM is routinely used in Materials Science and
Nanotechnology18,19, it has only rarely been applied in geosciences, e.g. to study in-situ dissolution precipitation
of minerals such as barite, celestite and calcite and for studying calcite surface structure20,21. It has also been used
to study grooving and wetting along grain boundaries in quartz during hydrothermal a nnealing4. In this study,
1
Department of Geology and Geophysics, IIT Kharagpur, Kharagpur, West Bengal 721 302, India. 2Instability and
Soft Patterning Laboratory, Department of Chemical Engineering, IIT Kharagpur, Kharagpur, West Bengal 721
302, India. *email: saibl2008@gmail.com
Scientific Reports | (2021) 11:9831 | https://doi.org/10.1038/s41598-021-89250-z 1
Vol.:(0123456789)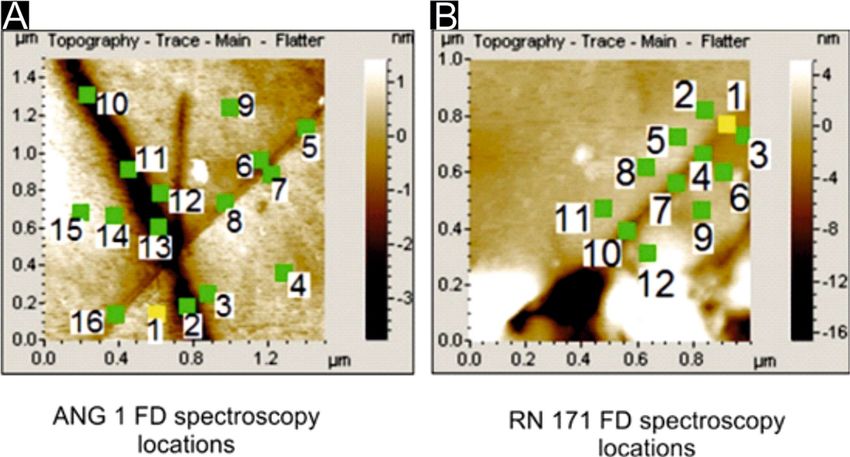
www.nature.com/scientificreports/
Figure 1. Thin section photomicrographs of four representative quartzite samples used for the purpose of this
study, generated using Leica Qwin version 3 (Leica Microsystems); (A) RD 47: predominantly sedimentary
quartzite from the Singhbhum Craton with limited deformation overprint. The average grain size is large but
incipient recrystallization results in the development of prominent core-mantle structures with highly irregular
grain boundaries. (B) RN 192: sheared quartzite from the Rengali Province. The average grain size is small
and quartz grains are flattened and stretched in the direction of shearing, with prominent dextral asymmetry.
(C) RN 36: quartzite from the Rengali Province which records a dominantly amphibolite facies deformation
overprint. Grains are polygonal and equant with relatively straight boundaries implying deformation by
dominantly static recrystallization. (D) RN 235: quartzite from the granulite unit of the central Rengali Province.
Grains are amoeboid with highly irregular boundaries and comparatively larger sizes. Dynamic recrystallization
at high temperatures implies that Grain Boundary Migration was the dominant deformation mechanism.
we demonstrate that systematic changes in grain boundary morphology in quartzite samples metamorphosed
at different metamorphic grades can be directly visualized using AFM. We show that high resolution imagery
of grain boundary domains using AFM permits determination of grain boundary features with precision, and
suggest that this technique may be used for relating the width of grain boundaries to fluid percolation. Finally,
we argue that these changes have implications for fluid flow in the middle and lower continental crust.
Sample description. To eliminate variations originating from differences in mineralogy, seven relatively
pure quartzite samples metamorphosed at different grades have been chosen for the purpose of this study. A pol-
ishing regimen similar to one used for Electron Backscatter Diffraction (EBSD) analyses has been used wherein
the samples have been polished initially to a thickness of 30 microns on a polishing plate followed by polish-
ing using colloidal silica for 6 h to remove surficial imperfections. The samples have been collected from the
vicinity of a major terrane boundary zone in the eastern part of the Indian shield—specifically, between the
Singhbhum Craton, the Rengali Province and the Eastern Ghats Province22 (see Supplementary Figure S1). The
tectonothermal histories as well as the geochronological evolution of these terranes have been described in detail
elsewhere23–28. Samples collected during fieldwork have been studied using a Leica DM-LP-4500 microscope.
The metamorphic conditions experienced by the quartzites used in this study range from greenschist to granu-
lite facies. RD 47 is an originally sedimentary quartzite metamorphosed under greenschist facies conditions,
collected from the southern margin of the Singhbhum Craton. The quartz grains are polygonal in shape and
evidence of strain retention is limited to Bulging Recrystallization (BLG)29,30 along with Grain Boundary Area
Reduction (GBAR). Comparatively high strain zones within the quartzite are characterised by sub-grain rotation
(SGR) and the development of core-mantle structures, with larger relict grains of quartz surrounded by smaller,
recrystallized grains (Fig. 1A).
Scientific Reports | (2021) 11:9831 | https://doi.org/10.1038/s41598-021-89250-z 2
Vol:.(1234567890)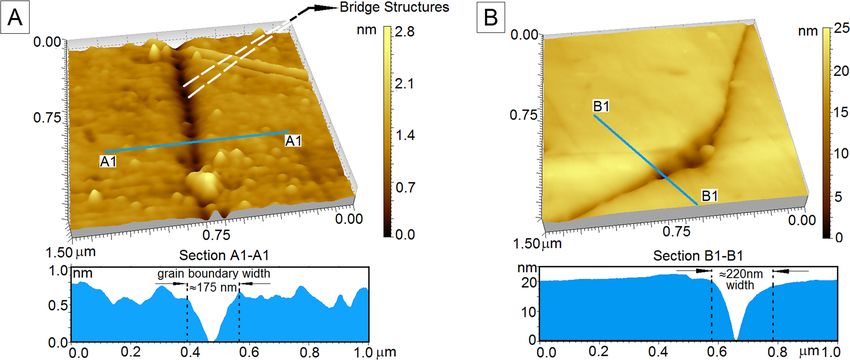
www.nature.com/scientificreports/
Figure 2. AFM scan images of two representative quartzite samples generated using PicoImage Basic
Rendering Software (produced by Digital Surf), that comes integrated with Agilent PicoView Software (version
1.14.4, Agilent Technologies) URL:https://www.keysight.com/in/en/lib/software-detail/instrument-firmw
are-software/for-your-convenience-you-can-now-download-picoview-and-pico-image-software-for-your-afm-
2282256.html. Depth profiles are shown below each scan image. Varying shades of yellow describe the surface
elevation within each scan image; widths have been measured along the dotted lines in black which mark
the inflection points. (A) Straight segment of a boundary within a quartzite deformed under granulite facies
conditions (RN 235). Periodically arranged bridges, perpendicular to the length of the boundary are clearly
observable. A polishing-induced scratch is visible in the top right corner of the image, which is slightly elevated
with respect to the plane of the thin-section (B) Junction of two boundary segments within a quartzite deformed
under amphibolite facies conditions (RN 36). The width of the junction is significantly larger than the individual
boundary segments. Bridge structures are not apparent in this image. Very fine surficial imperfections are visible
as linear features cutting across the pore at the junction of the boundary segments.
Quartzites of the Rengali Province are significantly different in character from those in the Singhbhum
Craton. The intensity of deformation, as well as the metamorphic grade is higher than that experienced by the
samples from the Singhbhum C raton31. High grade (amphibolite to granulite facies) metamorphism of Archean
age accompanied pervasive fabric formation and annealing, which was followed by intense shearing along the
terrane margins of the Rengali Province under greenschist facies conditions around ~ 500 M a24. In samples
from a sheared quartzite unit of the Rengali Province (RN 178, RN 192 and RN 201), quartz shows evidence of
widespread dynamic recrystallization which accompanied dextral strike-slip shearing under greenschist facies
conditions24. Mylonitization and accompanying grain size reduction is a characteristic feature of these sheared
quartzites (Fig. 1B). Rotated kyanite porphyroclasts in RN 201 survive within the sheared matrix and serve as
shear sense indicators. Away from the sheared domains, the effect of shear-related recrystallization gradually
diminishes. Quartz grains in RN 36 from the Rengali Province are equant in shape, show undulose extinction29,
and largely preserve the earlier, annealed granoblastic mosaic texture (Fig. 1C), although the marginal parts are
modified by Bulging Recrystallization during later shearing. The texture is characteristic of static recrystallization
followed by annealing at high temperatures. In the interior of the Rengali Province, the quartzites show evidence
of high temperature recrystallization without any subsequent low temperature overprint. RN 235 contains amoe-
boid grains (Fig. 1D) indicative of Grain Boundary Migration (GBM)30. RN 235 also contains sillimanite needles
oriented along the long axis of quartz ribbons. Quartz grains within ANG 1, a quartzite collected from the Eastern
Ghats Mobile Belt south of the Rengali Province shows chess-board extinction patterns consisting of rectangular
subgrains with relatively straight boundaries characteristic of deformation above 550 °C29,32.
Results
Atomic Force Microscopy. Width data estimated from a total of 441 grain boundary segments is presented
in Table R1 (Section S2) of the Electronic Supplementary Information (ESI) with average widths mentioned in
bold at the end of each column and calculated population standard deviation values mentioned in red. Grain
boundary width has been computed as the distance along a straight line between successive inflection points
on the AFM curve (see Fig. 2). Highest average grain boundary width (407.17 nm) is recorded in the statically
recrystallized quartzite from the Rengali Province (RN 36), with a maximum width of 930 nm and a minimum
width of 190 nm (Fig. 2B). The lowest average grain boundary width (97.25 nm) is recorded in a quartzite
deformed and metamorphosed under granulite facies conditions (RN 235), with a maximum width of 212 nm
and a minimum width of 34 nm (Fig. 2A). Widths show significant variation along the length of grain bounda-
ries in greenschist facies samples, while they remain relatively consistent along boundaries in granulite facies
samples. In the greenschist facies quartzite samples, the degree of dynamic recrystallization and the recrystal-
Scientific Reports | (2021) 11:9831 | https://doi.org/10.1038/s41598-021-89250-z 3
Vol.:(0123456789)www.nature.com/scientificreports/
lization regime in general (static vs dynamic) appears to influence grain boundary widths in the quartzites, with
a greater degree of dynamic recrystallization accompanying smaller grain boundary widths, and vice versa. RD
47, which has limited imprint of dynamic recrystallization in the form of incipient sub-grain formation at the
margins of large grains (see Fig. 1A), has an average boundary width of 323.19 nm, while the extensively sheared
and recrystallized samples RN 178, RN 192 and RN 201 have average boundary widths of 364.34 nm, 339.05 nm,
and 344.48 nm respectively.
The nature of grain boundary domains is not consistent within the scale of individual thin sections, and
reveals a number of interesting features when imaged at high resolutions. Calculated standard deviation in grain
boundaries from the greenschist facies samples RN 178, RN 192 and RN 201 are 378.72, 384.70, and 190.29
respectively. These values are significantly higher than the values calculated from the granulite facies samples
ANG 1 and RN 235 (72.09 and 54.42). The large difference in standard deviation values between samples meta-
morphosed at different grades is due to the development of pore spaces at triple junctions and along individual
segments of grain boundaries in low grade rocks. If these pores connect and create an inter-connected network,
this could substantially ease percolation through these rocks. On the other hand, triple junctions in high grade
rocks do not develop such pores but often consist of a comparatively wider boundary terminating at the junc-
tion of two comparatively narrower boundaries. While the average width is computed to be higher in the case
of the statically recrystallized quartzite (RN 36), the widest grain boundary segments are present in the sheared
(greenschist facies) quartzites which contain a number of pores along the grain boundary network, some of
which are as wide as 1700 nm (see Table R1, Section S2, ESI).
High magnification imagery of the grain boundary domains reveals periodic ‘bridge’-type structures that are
otherwise undetectable both in thin section and at lower magnifications under the AFM (Fig. 2A). These bridge
structures are regularly arranged across the grain boundary voids and their abundance varies from sample to
sample. 3D profiles of grain boundaries from two samples, RN 235 and RN 36 are shown in Fig. 2, where these
bridges are clearly visible (Fig. 2A). The origin of these bridge structures may correspond to development of CSL
boundary relationships described by M cLaren33, especially because of their periodic distribution. To ensure that
width measurements are not influenced by subjectivity in the choice of inflection points, the entire area occupied
by representative boundary domains has been calculated. Calculated areas show no deviations from the trends
observed in calculated widths across different metamorphic grades. The lowest average area of grain boundary
domains is observed in RN 235 (0.086 µm2) while the highest average area is observed in RD 47 (19.974 µm2).
ANG 1, the other quartzite sample which experienced granulite facies metamorphism, also contains smaller
grain boundary domains on average (0.103 µm2) compared to RN 178 (3.155 µm2), RN 192 (1.666 µm2) and
RN 201 (1.948 µm2) which were recrystallized under greenschist facies conditions. RN 36, which underwent
static recrystallization, has an average grain boundary area of 0.956 µm2 which is intermediate between the
values obtained for quartzites deformed under granulite and greenschist facies conditions. For the purpose of
this study, boundaries between grains have been correctly identified and there are substantial morphological
differences between grain boundaries as viewed under an AFM and surficial features such as polishing effects.
Scratches due to polishing are typically limited in horizontal and vertical extent and individual scratches are
straight and typically a few microns long and only a few nanometers deep (see Fig. 2, caption). Grain boundaries,
on the other hand are arcuate, with locally short straight segments that extend vertically for several nanometers,
showing only slight variations in width with depth. The boundaries exist entirely between grains and have been
traced horizontally over several microns to ensure that they are not artefacts, such as healed fractures. Optical
microscopy confirms the absence of any evidence of brittle deformation within the grains.
Force‑distance spectroscopy. Table 1 presents representative calculated deformation data using force-
distance (FD) spectroscopy for ANG 1 and RN 171. Corresponding AFM images marked with indent locations,
generated using the FD module of the AFM software, are shown in Fig. 3. Additional deformation data obtained
from FD spectroscopy at multiple locations for both samples have been listed in Table R2 and R3 (Section S3
of ESI). It is to be noted that all the FD curves were generated by the same AFM tip and on the same day to
avoid any change in the material of the tip due to ambient conditions. The deformation of the sample surface is
significantly greater in the case of RN 171 compared to ANG 1, and this has important implications for grain
boundary character. A total of 36 points in ANG 1 and 21 points in RN 171 have been chosen for the purpose
of force-distance spectroscopy (some of which are shown in Table 1, remaining in Section S3 of ESI), and these
points are evenly distributed across the interior of the grains as well as along grain boundary domains. The
overall deformation of the surface due to interaction with the tip, in case of ANG 1, is significantly less than RN
171, in addition to variations in deformation within a sample depending upon the location of the point being
analysed. Within ANG 1, the difference in degree of deformation between points on the grain boundary (con-
taining bridge structures) and the interior of the grain is small (e.g. 62.8 nm vs 66.3 nm), whereas the difference
is significantly larger in the case of RN 171 along segments where bridges are absent. To emphasize the varia-
tion in intermolecular force over the bridge and non-bridge areas of one particular grain boundary, FD spectra
have been obtained along grain boundary segments in RN 171, where bridges are present as well as those along
which bridges are absent. Segments where bridges are present show smaller differences in extent of deformation
between the interior of the grains and over the bridges, while segments where bridges are absent show much
greater variability in degree of deformation between grain interiors and boundary domains. This implies that
the deformation may be influenced by the presence of the bridge structures described earlier. The significantly
higher population of bridge structures along grain boundaries in ANG 1 makes it more difficult for the tip to
deform the surface significantly in comparison to grain boundaries in RN 171, in which the relatively scant
occurrence of bridges makes it less rigid, thereby allowing the tip to deform the sample more. The deformation
across all points for ANG 1 is one order less than that experienced by RN 171, from which it can be inferred that
Scientific Reports | (2021) 11:9831 | https://doi.org/10.1038/s41598-021-89250-z 4
Vol:.(1234567890)www.nature.com/scientificreports/
Location ANG 1 (nm) RN 171 (nm)
1 66.3 175.02
2 62.8 43.8
3 54.6 180.9
4 57 630.9
5 60.7 123.7
6 54.9 376.5
7 65.5 738.7
8 61.1 619.1
9 75.8 752.2
10 56.9 319.7
11 67.4 564.9
12 51 493
13 60.2
14 60.6
15 61.1
16 62
Table 1. Results of plastic deformation calculated using force-distance spectroscopy on ANG 1 and RN 171.
The deformation of the surface in case of ANG 1 is significantly lesser than that of RN 171 implying greater
strength of the surface of ANG 1 in all domains, compared to RN 171.
intermolecular strength at grain boundaries is stronger for ANG 1 than RN 171. The FD spectra curves have
been used to calculate the average elastic moduli for ANG 1 and RN 171 (for details see section S5 of the ESI).
ANG 1 has an average elastic modulus of 255 GPa within grains, and an average elastic modulus of 216 GPa in
the grain boundary domains. The average elastic modulus within grains of RN 171 is 95 GPa and in the grain
boundary domains, the average elastic modulus is 115 GPa. The elastic modulus is representative of the stiffness
of a sample, or the resistance offered by a sample to deformation. The elastic modulus, both within grains and
in grain boundary domains of ANG 1 is significantly higher than that in RN 171, implying that ANG 1 is more
resistant to deformation than RN 171. This implies that granulite facies metamorphism results in significantly
stronger bonds between constituent mineral grains compared to greenschist facies metamorphism.
EBSD studies. Kernel Average Misorientations (KAM) are a useful tool for visualizing remnant strain in
terms of dislocation density (see Fig. 4). KAM values have been computed using Mtex for M ATLAB34 from
(EBSD) data generated from four quartzite samples (RN 36, RN 178, RN 221 and RN 235), to understand the
effect (if any) played by dislocation density on widening of grain boundary domains. A higher dislocation den-
sity would imply greater remnant strain and vice versa. The sheared quartzites (RN 178, Fig. 4A; RN 221, Fig. 4B)
preserve a high degree of remnant strain in their microstructure, but most of it is restricted to intra-granular
domains, away from grain boundaries. The statically recrystallized quartzite sample (RN 36, Fig. 4C) has the
least remnant strain, since it was initially metamorphosed at higher, amphibolite facies conditions, and was in
a low strain zone of the later greenschist facies shearing; only marginal effects along the grain boundary were
impressed during this later event24. The quartzite recrystallized at high temperature (RN 235, Fig. 4D) has a
significant amount of remnant strain in its microstructure, evidenced by dislocation build up within grains as
well as a significant number of dislocation walls cross-cutting grain boundary domains. The results of the KAM
analyses indicate that the proportion of remnant strain does not necessarily accentuate grain boundary widths
during polishing and sample preparation. The sheared quartzites have wider grain boundaries, and have strain
concentrated in the grain interiors away from boundary domains; in contrast, the high temperature quartzite has
narrower grain boundaries but a significant dislocation density near grain boundary domains.
Discussion
It has been suggested that open grain boundaries, cavities, and depressions can form a network which allows
fluid circulation in r ocks2,7,11,35–37. However, such cavities and pores in rocks are not uniformly d
istributed8,11,38.
During metamorphism, it is known that textural equilibration significantly modifies grain boundary geometry29;
however, there has been no systematic investigation as yet to determine if there is any correlation between the
grain boundary width and the grade of metamorphism, which is one of the primary controls on rock texture,
along with other factors such as the orientation of the grain boundary relative to local kinematics, stretching
direction, or cavitation along specific boundaries, to name a few. Textural equilibration is accompanied by attain-
ment of equilibrium dihedral angles at triple junctions of grains38,39 with a concomitant change in crystallographic
orientations across grain boundaries; these changes are commonly determined by Electron Backscatter Diffrac-
tion (EBSD). During metamorphism, crystallographic re-orientation may in some cases lead to the formation
of ‘special’ boundaries between grains, known as Coincident Site Lattice or CSL boundaries15,40. The mechanical
process of migration of fluids along a grain boundary is controlled by the width of the channel, with a greater
width facilitating easier fluid transport along the channel. If some of these boundaries are CSL boundaries, they
Scientific Reports | (2021) 11:9831 | https://doi.org/10.1038/s41598-021-89250-z 5
Vol.:(0123456789)www.nature.com/scientificreports/
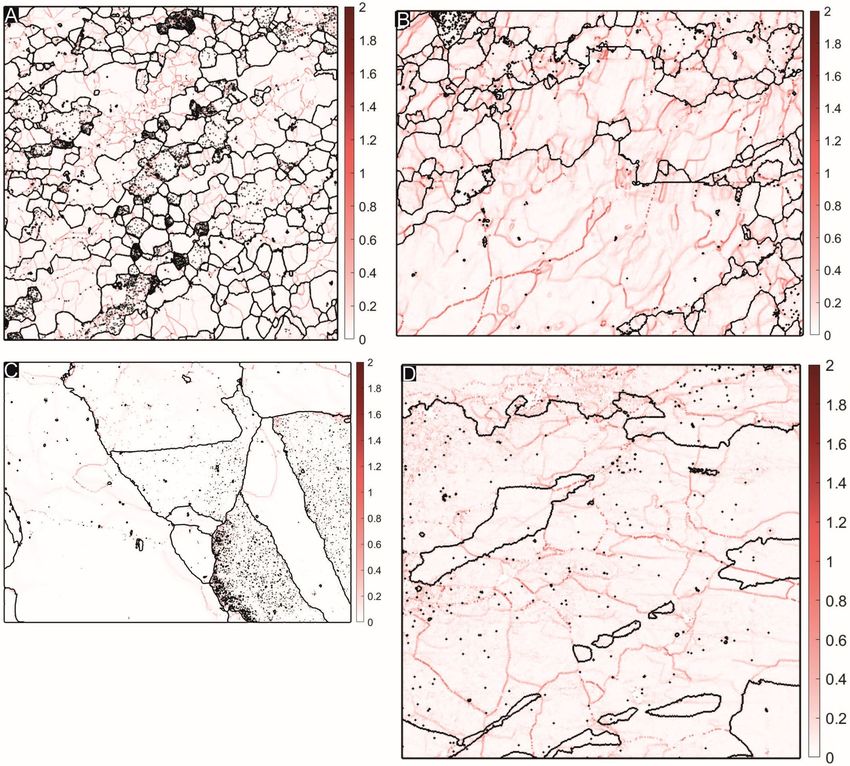
Figure 3. AFM images generated using PicoImage Basic Rendering Software (produced by Digital Surf), that
comes integrated with Agilent PicoView Software (Version 1.14.4, Agilent Technologies) URL: https://www.
keysight.com/in/en/lib/software-detail/instrument-firmware-software/for-your-convenience-you-can-now-
download-picoview-and-pico-image-software-for-your-afm-2282256.html. Further, for better visual clarity, the
numbers and the line profiles were drawn using MS Paint. Indent locations from which force-distance spectra
have been obtained for two samples (A) ANG1 (B) RN171 are shown.
offer enhanced resistance to fluid percolation along the grain boundary n etwork17,33,41,42. Thus, in metallurgical
and material science studies, the width of the grain boundaries, in terms of wider general boundaries and nar-
rower CSL boundaries, are taken into consideration to model percolation behaviour in metals and m aterials41,43.
In this study, we estimated the width of the grain boundary domain using Atomic Force Microscopy (AFM),
which also reveals other interesting morphological features along the boundaries. Comparison of grain bounda-
ries in quartzites metamorphosed under conditions varying from the greenschist to granulite facies shows distinct
differences. Quartzites metamorphosed under greenschist facies conditions have wider grain boundaries com-
pared to those metamorphosed under granulite facies conditions. For all the dynamically recrystallized samples,
the reduction of grain boundary width is correlatable with increasing metamorphic grade. This implies that
lower grade rocks generally have wider grain boundary domains, with abundant pores along the grain bound-
ary network, than high grade rocks, and are therefore more amenable to fluid flow. The wide grain boundary
domains in one apparently discrepant sample in this study (RN 36) can be attributed to the effect of modifica-
tion of statically recrystallized grain boundary domains during the later lower temperature shearing event in
the Rengali Province. Apart from the grain boundary width, an important morphological feature observed
across the grain boundaries are the bridge-type structures detected with the AFM under high magnification,
suggesting enhanced bonding across these boundaries. These bridge-structures are exclusively observed along
narrower grain boundary segments, and have not been previously documented with any alternative technique.
The results of force-distance spectroscopy provide more insight into the significance of these bridges. On grain
boundary segments that contain bridges, the bridge domains show significantly less deformation on interaction
with the AFM tip compared to the domains between the bridges. This suggests that there is a spatial variation
in bond strength along these grain boundaries, being significantly higher across the bridges than in inter-bridge
segments. Additionally, force-distance spectroscopy on one low grade and one high grade sample also suggests
that bonding across grain boundaries in high grade rocks are significantly stronger than in low grade rocks. The
enhanced bonding strength, and the presence of bridges across grain boundaries in high grade rocks increase
the bulk strength of the rock and improve resistance to fluid percolation; they may also be regarded as evidence
for the existence of special (CSL) boundaries in rocks, similar to those reported in metals. The most common
such CSL relationship observed in quartz rich rocks are Dauphiné twins which involve a 60° rotation about the
axis33,44–48.
Since the present study attempts to relate grain boundary domains in metamorphic rocks of different grades
to fluid flow, it is pertinent to discuss if the grain boundary widths measured under ambient pressure temperature
conditions are representative of the in situ situation at depth. Studies on q uartz49–52 show that volume reduction
associated with decompression is anisotropic. This implies that quartz grains would undergo volume reduction
as they cool through the brittle-ductile transition during uplift, with associated widening of grain boundaries.
Scientific Reports | (2021) 11:9831 | https://doi.org/10.1038/s41598-021-89250-z 6
Vol:.(1234567890)www.nature.com/scientificreports/
Figure 4. Kernel Average Misorientation maps of four representative quartzite samples used in this study,
generated using the software package Mtex version 5.6.0 for Matlab. (Matlab version 2020a). URL: https://mtex-
toolbox.github.io/. Varying shades of red describe the misorientation angle at different points in the map; (A)
RN 178: sheared quartzite from the Rengali Province. Larger grains have a significantly higher amount of strain
(dislocations) compared to smaller grains, as is expected for incomplete dynamic recrystallization. In some
grains, dislocations are perpendicular to the grain boundary lengths. (B) RN 221: sheared quartzite from the
Rengali Province. Comparatively larger grain size compared to A, because of which the density of dislocations is
higher. Smaller grains are almost dislocation free whereas large grains have dense concentrations of dislocations
within them. (C) RN 36: statically recrystallized quartzite from the Rengali Province. Almost strain free, with
very few isolated dislocations in the grain interiors. Static recrystallization and accompanying polygonization
without further strain imprint appears to have left this quartzite relatively strain free. (D) RN 235: quartzite
deformed under granulite facies conditions. Large amoeboid grains with a significant dislocation density are the
dominant feature of this quartzite. Smaller recrystallized grains appear to be relatively strain free.
However, the results of this study argue that for high grade and low grade rocks, the situation should be different.
The enhanced degree of bonding (manifested as bridges under an AFM) in high grade rocks would imply that the
constriction of grains on either side of the boundary is limited, and does not necessarily influence the boundary
width itself. Additionally, strong bonds across a grain boundary would prevent the boundary from widening or
forming voids due to decompression, to a much larger extent than boundaries across which the bonds are weak.
The width of boundaries that contain bridge structures are therefore inferred to preserve their original widths
from depth to the surface, and are not an artefact of exhumation. Thus, it appears that in quartzites, grain bound-
ary widths reduce significantly with increasing metamorphic grade, with enhanced bonding at higher grades
forming ‘bridge-type’ structures across the grain boundaries. Ultimately, this implies an increased resistance of
channels in quartz-rich high grade rocks to fluid flow, consistent with the relatively anhydrous character of the
Scientific Reports | (2021) 11:9831 | https://doi.org/10.1038/s41598-021-89250-z 7
Vol.:(0123456789)www.nature.com/scientificreports/
granulite facies. Enhanced bonding across most grain boundaries in high grade rocks reduces the degree of open-
ing of grain boundaries on cooling and decompression, whereas the more limited amount of bonding in lower
grade rocks means these boundaries open more; therefore, difference in observed widths reflect the difference
in bonding and its influence on grain boundary opening.
Conclusions
Atomic Force Microscopy allows comparatively easy, high magnification imaging and precise width measure-
ments along grain boundary domains within a rock. Within quartzites deformed and metamorphosed at differ-
ent metamorphic conditions, those that are deformed at lower grades have wider grain boundaries with voids
along the channels and at triple junctions and a much lower proportion of bridges compared to those that are
deformed at higher grades. The latter have narrower channels, no voids along these channels, and an abundance
of periodically arranged bridges oriented at right angles to the length of the boundary. The width of a grain
boundary is not constant laterally and shows significant variability along the length of the boundary. The effect
of the dominant recrystallization mechanism (dynamic vs static) on grain boundary widths has not been studied
previously, and this study suggests that dynamic recrystallization results in much narrower grain boundaries
compared to static recrystallization. Thus, dynamic recrystallization at higher metamorphic grades is much more
efficient at reducing grain boundary widths compared to static recrystallization under similar or slightly lower
temperature–pressure conditions. The concept of force-distance (FD) spectroscopy has been applied to geological
samples for the first time, and the results allow for a qualitative estimate of variations in strength of grain bound-
ary domains and grain interiors within quartzites deformed at different metamorphic conditions. The results of
FD spectroscopy demonstrate that high grade rocks are in general significantly less deformable compared to low
grade rocks. Additionally, grain boundary domains containing bridges across them are less deformable compared
to segments along which bridges are absent, irrespective of metamorphic grade. We suggest that the strength
of grain boundary domains is higher in high grade metamorphic rocks compared to lower metamorphic grade
rocks, and together with the other grain boundary features, contribute to enhanced resistance to fluid percolation
in granulite facies quartzites compared to those metamorphosed under greenschist facies conditions.
Methods
Atomic Force Microscopy. Surface morphologies of the seven quartzite samples were studied using an
Atomic Force Microscope (Model 5100, Agilent Technologies). An Atomic Force Microscope images the surface
of a ‘material’ based on minute variations in elevations of the sample surface relative to the deepest point that
the AFM tip can probe for a specific sample. A n doped—Silicon Nitride (PPP-NCL, Nanosensors Inc., USA) four
sided AFM tip attached to a silicon cantilever, having a tip radius of curvature of 8 ± 2 nm, cantilever resonating
frequency in the range of 180–250 kHz and force constant of 48 N/m, records the variation in topography at the
surface. All AFM scans are obtained in intermittent contact mode (widely known as tapping mode) to ensure
there is no damage made to either the AFM tip or the surface of the sample. Scans have been generated by Raster
Scanning at a speed of 0.3 lines per second. Since pure quartzites (containing more than 90% quartz) have been
used in this study, all grain boundary width data relate to boundaries between adjacent quartz grains. Addition-
ally, the quartzites have been studied under an optical microscope to delineate domains free of accessory miner-
als, and these domains have been further imaged using the AFM. The darkest zones are the deep trenches in the
image and are obviously grain boundaries (see Fig. 2); depth profiles were obtained across them using the AFM.
Grain boundary widths are then computed from these depth profiles.
Force Distance Spectroscopy. Force-distance spectra have been obtained using the AFM both over grain
boundary domains, and in the interior of grains. A total of 36 points for ANG 1 and 21 points for RN 171 have
been identified by first imaging the area and then capturing the FD spectra at each point. Details with regard
to this technique have been outlined in Cappella and Dietler53. Out of several extractable parameters, which
describe the sample surface with the help of Force—Distance (FD) Spectroscopy, a property known as ‘Plas-
tic Deformation’ has been calculated in this study, which can qualitatively explain variations in intermolecular
forces within the grain boundary domains, as well as variations in intermolecular forces between grain bound-
ary domains and the grain interior. This is actually deformation that occurs and recovers gradually over time
depending upon the elasticity of the material, and indicates that there is ongoing deformation at that particular
point within the observation time-scale or time window during which the FD curves are being generated. Lesser
deformation implies stronger grain boundary structures. In addition to this, elastic modulii (ES) of locations
within the grains and near the grain boundaries have been calculated for both samples; detailed calculation pro-
cedures are shown in Section S5 of the ESI. To obtain the FD spectra, the applied force on the AFM tip has been
kept constant throughout the study at ≈ 6.84 µN (equivalent to 9.5 V on photodiode) (calculation of the applied
force from electrical signal generated on photodiode is shown in Section S4 of ESI).
EBSD studies. Electron Backscatter Diffraction (EBSD) data have been generated using a Zeiss-Auriga
Compact system with a Gemini column Schottky type field emission filament. EBSD pattern detection is car-
ried out using an Oxford Nordlys detector. The EBSD analyses have been carried out using a voltage of 30 kV
and a step size of 0.5 microns. Grains within the EBSD map have been delineated using a threshold angle of 10°
and from indexed grains only. Raw EBSD data have been de-noised using a half-quadratic filter and the KAM
threshold has been set as 2.5° to document sensitive local misorientations, which provide an estimate of the
dislocation density in a region.
Scientific Reports | (2021) 11:9831 | https://doi.org/10.1038/s41598-021-89250-z 8
Vol:.(1234567890)www.nature.com/scientificreports/
Received: 4 February 2021; Accepted: 19 April 2021
References
1. Aust, K. T., Erb, U. & Palumbo, G. Interface control for resistance to intergranular cracking. Mater. Sci. Eng. A 176, 329–334 (1994).
2. Kruhl, J. H., Wirth, R. & Morales, L. F. G. Quartz grain boundaries as fluid pathways in metamorphic rocks. J. Geophys. Res. Solid
Earth 118, 1957–1967 (2013).
3. Bargen, N. & Waff, H. S. Permeabilities, interfacial areas and curvatures of partially molten systems: RESULTS of numerical
computations of equilibrium microstructures. J. Geophys. Res. Solid Earth 91, 9261–9276 (1986).
4. Klevakina, K., Renner, J., Doltsinis, N. & Adeagbo, W. Transport processes at quartz-water interfaces: constraints from hydrother-
mal grooving experiments. Solid Earth https://doi.org/10.5194/se-5-883-2014 (2014).
5. Billia, M. A., Timms, N. E., Toy, V. G., Hart, R. D. & Prior, D. J. Grain boundary dissolution porosity in quartzofeldspathic ultra-
mylonites: implications for permeability enhancement and weakening of mid-crustal shear zones. J. Struct. Geol. 53, 2–14 (2013).
6. Raimondo, T., Clark, C., Hand, M., Cliff, J. & Anczkiewicz, R. A simple mechanism for mid-crustal shear zones to record surface-
derived fluid signatures. Geology 41, 711–714 (2013).
7. Fusseis, F., Regenauer-Lieb, K., Liu, J., Hough, R. M. & De Carlo, F. Creep cavitation can establish a dynamic granular fluid pump
in ductile shear zones. Nature https://doi.org/10.1038/nature08051 (2009).
8. Nagurney, A. B., Caddick, M. J., Law, R. D., Ross, N. L. & Kruckenberg, S. C. Crystallographically controlled void space at grain
boundaries in the Harkless quartzite. J. Struct. Geol. https://doi.org/10.1016/j.jsg.2020.104235 (2020).
9. Précigout, J., Prigent, C., Palasse, L. & Pochon, A. Water pumping in mantle shear zones. Nat. Commun. 8, 1–10 (2017).
10. Holness, M. B. & Watt, G. R. Quartz recrystallization and fluid flow during contact metamorphism: a cathodoluminescence study.
Geofluids 1, 215–228 (2001).
11. Menegon, L., Fusseis, F., Stünitz, H. & Xiao, X. Creep cavitation bands control porosity and fluid flow in lower crustal shear zones.
Geology https://doi.org/10.1130/G36307.1 (2015).
12. Mancktelow, N. S. & Pennacchioni, G. The influence of grain boundary fluids on the microstructure of quartz-feldspar mylonites.
J. Struct. Geol. 26, 47–69 (2004).
13. Mandal, S., Bhaduri, A. K. & Subramanya Sarma, V. One-step and iterative thermo-mechanical treatments to enhance ∑3 n
boundaries in a Ti-modified austenitic stainless steel. J. Mater. Sci. 46, 275–284 (2011).
14. Randle, V., Davies, H. & Cross, I. Grain boundary misorientation distributions. Curr. Opin. Solid State Mater. Sci. 5, 3–8 (2001).
15. Randle, V. The coincidence site lattice and the ‘sigma enigma’. Mater. Charact. 47, 411–416 (2001).
16. Kumar, M., King, W. E. & Schwartz, A. J. Modifications to the microstructural topology in f.c.c. materials through thermomechani-
cal processing. Acta Mater. https://doi.org/10.1016/S1359-6454(00)00045-8 (2000).
17. Prithiv, T. S., Bhuyan, P., Pradhan, S. K., Subramanya Sarma, V. & Mandal, S. A critical evaluation on efficacy of recrystallization vs.
strain induced boundary migration in achieving grain boundary engineered microstructure in a Ni-base superalloy. Acta Mater.
146, 187–201 (2018).
18. Banik, M., Bhandaru, N. & Mukherjee, R. Transfer printing of colloidal crystals based on UV mediated degradation of a polymer
thin film. Chem. Commun. 54, 3484–3487 (2018).
19. Das, A., Banerji, A. & Mukherjee, R. Programming feature size in the thermal wrinkling of metal polymer bilayer by modulating
substrate viscoelasticity. ACS Appl. Mater. Interfaces 9, 23255–23262 (2017).
20. Stipp, S. L. S., Eggleston, C. M. & Nielsen, B. S. Calcite surface structure observed at microtopographic and molecular scales with
atomic force microscopy (AFM). Geochim. Cosmochim. Acta 58, 3023–3033 (1994).
21. Dove, P. M. & Platt, F. M. Compatible real-time rates of mineral dissolution by Atomic Force Microscopy (AFM). Chem. Geol. 127,
331–338 (1996).
22. Dobmeier, C. J. & Raith, M. M. Crustal architecture and evolution of the Eastern Ghats Belt and adjacent regions of India. Geol.
Soc. Lond. Spec. Publ. 206, 145–168 (2003).
23. Bose, S., Guha, S., Ghosh, G., Das, K. & Mukhopadhyay, J. Tectonic juxtaposition of crust and continental growth during orogenesis:
example from the Rengali Province, eastern India. Geosci. Front. 6, 537–555 (2015).
24. Misra, S. & Gupta, S. Superposed deformation and inherited structures in an ancient dilational step-over zone: post-mortem of
the Rengali Province, India. J. Struct. Geol. 59, 1–17 (2014).
25. Chaudhuri, T., Wan, Y., Mazumder, R., Ma, M. & Liu, D. Evidence of enriched, hadean mantle reservoir from 4.2–4.0 Ga zircon
xenocrysts from Paleoarchean TTGs of the Singhbhum Craton, Eastern India. Sci. Rep. 8, 7069 (2018).
26. Saha, A. K. Crustal Evolution of Singhbhum-North Orissa, Eastern India (Geological Society of India, 1994).
27. Mahapatro, S. N., Pant, N. C., Bhowmik, S. K., Tripathy, A. K. & Nanda, J. K. Archaean granulite facies metamorphism at the Sin-
ghbhum Craton-Eastern Ghats Mobile Belt interface: implication for the Ur supercontinent assembly. Geol. J. 47, 312–333 (2012).
28. Bose, S. et al. Neoarchean tectonothermal imprints in the Rengali Province, eastern India and their implication on the growth of
Singhbhum Craton: evidence from zircon U-Pb SHRIMP data. J. Metamorph. Geol. 34, 743–764 (2016).
29. Vernon, R. H. A Practical Guide to Rock Microstructure (Cambridge University Press, 2004). https://doi.org/10.1017/CBO9780511
807206.
30. Stipp, M., Stünitz, H., Heilbronner, R. & Schmid, S. M. Dynamic recrystallization of quartz: correlation between natural and
experimental conditions. Geol. Soc. Lond. Spec. Publ. 200, 171–190 (2002).
31. Crowe, W. A., Nash, C. R., Harris, L. B., Leeming, P. M. & Rankin, L. R. The geology of the Rengali Province: implications for the
tectonic development of northern Orissa, India. J. Asian Earth Sci. 21, 697–710 (2003).
32. Kruhl, J. H. Prism- and basal-plane parallel subgrain boundaries in quartz: a microstructural geothermobarometer. J. Metamorph.
Geol. 14, 581–589 (1996).
33. McLaren, A. C. Some speculations on the nature of high-angle grain boundaries in quartz rocks. In Mineral and Rock Deformation:
Laboratory Studies Vol. 36 (eds Hobbs, B. E. & Heard, H. C.) 233–245 (American Geophysical Union, Washington, 1986). https://
doi.org/10.1029/GM036p0233.
34. Bachmann, F., Hielscher, R. & Schaeben, H. Texture Analysis with MTEX – Free and Open Source Software Toolbox. Solid State
Phenom. 160, 63–68 (2010).
35. Mancktelow, N. S., Grujic, D. & Johnson, E. L. An SEM study of porosity and grain boundary microstructure in quartz mylonites,
Simplon Fault Zone, Central Alps. Contrib. Mineral. Petrol. https://doi.org/10.1007/s004100050379 (1998).
36. Putnis, A. & Austrheim, H. Fluid-induced processes: metasomatism and metamorphism. Geofluids 10, 254–269 (2010).
37. Hiraga, T., Nishikawa, O., Nagase, T. & Akizuki, M. Morphology of intergranular pores and wetting angles in pelitic schists studied
by transmission electron microscopy. Contrib. Mineral. Petrol. 141, 613–622 (2001).
38. Holness, M. B., Clemens, J. D. & Vernon, R. H. How deceptive are microstructures in granitic rocks? Answers from integrated
physical theory, phase equilibrium, and direct observations. Contrib. Mineral. Petrol. 173, 62 (2018).
39. Holness, M. B., Cheadle, M. J. & McKenzie, D. On the use of changes in dihedral angle to decode late-stage textural evolution in
cumulates. J. Petrol. 46, 1565–1583 (2005).
40. Kronberg, M. L. & Wilson, F. H. Secondary recrystallization in copper. JOM 1, 501–514 (1949).
Scientific Reports | (2021) 11:9831 | https://doi.org/10.1038/s41598-021-89250-z 9
Vol.:(0123456789)www.nature.com/scientificreports/
41. Randle, V. Application of electron backscatter diffraction to grain boundary characterisation. Int. Mater. Rev. https://doi.org/10.
1179/095066004225010514 (2004).
42. Toy, V. G., Mitchell, T. M., Druiventak, A. & Wirth, R. Crystallographic preferred orientations may develop in nanocrystalline
materials on fault planes due to surface energy interactions. Geochem. Geophys. Geosyst. 16, 2549–2563 (2015).
43. Miller, H. M., Kim, C. S., Gruber, J., Randle, V. & Rohrer, G. S. Orientation distribution of Σ3 grain boundary planes in Ni before
and after grain boundary engineering. Mater. Sci. Forum 558–559, 641–647 (2007).
44. Thomas, L. A. & Wooster, W. A. Piezoerescence—the growth of Dauphiné twinning in quartz under stress. Proc. R. Soc. Lond. Ser.
A Math. Phys. Sci. 208, 43–62 (1951).
45. Frondel, C. Characters of quartz fibers. Am. Mineral. 63, 17–27 (1978).
46. Mainprice, D., Lloyd, G. E. & Casey, M. Individual orientation measurements in quartz polycrystals: advantages and limitations
for texture and petrophysical property determinations. J. Struct. Geol. 15, 1169–1187 (1993).
47. Wenk, H. R. et al. Dauphiné twinning and texture memory in polycrystalline quartz. Part 3: texture memory during phase trans-
formation. Phys. Chem. Miner. 36, 567–583 (2009).
48. McLaren, A. C. & Phakey, P. P. Diffraction contrast from Dauphiné twin boundaries in quartz. Phys. Status Solidi 31, 723–737
(1969).
49. Raz, U., Girsperger, S. & Thompson, A. B. Thermal expansion, compressibility and volumetric changes of quartz obtained by single
crystal dilatometry to 700 °C and 3.5 kilobar (0.35 GPa). Schweizerische Mineral. und Petrogr. Mitteilungen https://d
oi.o
rg/1 0.3 929/
ethz-a-004392716 (2002).
50. Raghami, E., Schrank, C. & Kruhl, J. H. 3D modelling of the effect of thermal-elastic stress on grain-boundary opening in quartz
grain aggregates. Tectonophysics 774, 228242 (2020).
51. Caumon, M.-C., Dubessy, J., Robert, P. & Tarantola, A. Fused-silica capillary capsules (FSCCs) as reference synthetic aqueous fluid
inclusions to determine chlorinity by Raman spectroscopy. Eur. J. Mineral. 25, 755–763 (2013).
52. Scheidl, K. S. et al. Extending the single-crystal quartz pressure gauge up to hydrostatic pressure of 19 GPa. J. Appl. Crystallogr.
49, 2129–2137 (2016).
53. Cappella, B. & Dietler, G. Force-distance curves by atomic force microscopy. Surf. Sci. Rep. 34, 1–104 (1999).
Acknowledgements
RD thanks the Council of Scientific and Industrial Research (CSIR), for the award of the fellowship and contin-
gency Grant (No. 09/081(1242)/2015-EMR-I). SG acknowledges the infrastructural facilities provided by Head,
Dept. of Geology and Geophysics, IIT Kharagpur. SG thanks the Indian Institute of Technology Kharagpur, for
the infrastructural facilities that enabled us to conduct this study.
Author contributions
The idea of the work presented here was conceived by S.G. and R.M. R.D. wrote the primary draft of the manu-
script and did the EBSD work. A.D. performed all the AFM study. All authors looked through and worked on
the final draft of the manuscript, and approve the submission of the same.
Competing interests
The authors declare no competing interests.
Additional information
Supplementary Information The online version contains supplementary material available at https://doi.org/
10.1038/s41598-021-89250-z.
Correspondence and requests for materials should be addressed to S.G.
Reprints and permissions information is available at www.nature.com/reprints.
Publisher’s note Springer Nature remains neutral with regard to jurisdictional claims in published maps and
institutional affiliations.
Open Access This article is licensed under a Creative Commons Attribution 4.0 International
License, which permits use, sharing, adaptation, distribution and reproduction in any medium or
format, as long as you give appropriate credit to the original author(s) and the source, provide a link to the
Creative Commons licence, and indicate if changes were made. The images or other third party material in this
article are included in the article’s Creative Commons licence, unless indicated otherwise in a credit line to the
material. If material is not included in the article’s Creative Commons licence and your intended use is not
permitted by statutory regulation or exceeds the permitted use, you will need to obtain permission directly from
the copyright holder. To view a copy of this licence, visit http://creativecommons.org/licenses/by/4.0/.
© The Author(s) 2021
Scientific Reports | (2021) 11:9831 | https://doi.org/10.1038/s41598-021-89250-z 10
Vol:.(1234567890)You can also read