Detection Limits for Chiral Amino Acids Using a Polarization Camera - IOPscience
←
→
Page content transcription
If your browser does not render page correctly, please read the page content below
The Planetary Science Journal, 1:46 (17pp), 2020 September                                                                       https://doi.org/10.3847/PSJ/abae57
© 2020. The Author(s). Published by the American Astronomical Society.

                   Detection Limits for Chiral Amino Acids Using a Polarization Camera
               Claire Cook1             , Shane Byrne1, Christian Drouet d’Aubigny1, Donna Viola2, Jill Mikucki3, and Walther Ellis4
                                  1
                                      Lunar and Planetary Laboratory, University of Arizona, Tucson, AZ 85721, USA; clairec@lpl.arizona.edu
                                                        2
                                                          NASA Ames Research Center, Mountain View, CA 94035, USA
                                               3
                                                 Department of Microbiology, University of Tennessee, Knoxville, TN 37996, USA
                                                   4
                                                     Sonoran Analytical Instruments and Diagnostics, Tucson, AZ 85705, USA
                                       Received 2020 April 3; revised 2020 July 18; accepted 2020 August 9; published 2020 September 17

                                                                                  Abstract
             The detection of biosignatures on a planetary surface is of high scientific interest, and enantiomeric excesses of
             organic molecules are one such signature. Enantiomeric excesses can be detected by their polarizing effects on
             transmitted light. As part of instrument development work for a microscopic imager, the Cold Lightweight Imager
             for Europa (C-LIFE), we assess the potential of polarization measurements to quantify enantiomeric excesses. We
             investigated the optical rotation of the amino acids serine and phenylalanine for a range of enantiomeric
             abundances. Measurements were made with mixtures of serine and phenylalanine as well as Europa-relevant salts
             to determine how well these combinations can be detected. We also conducted a small number of measurements on
             samples of bacteria taken from glacial environments. We found that concentrations greater than 10−3 M are needed
             to detect serine and concentrations greater than 10−4 M are needed to detect phenylalanine, with larger
             concentrations needed for smaller enantiomeric excesses. Salts do not have a significant effect on the optical
             rotation. Optical rotation of bacterial samples were detected at concentrations >106 cells ml−1. Systematic errors in
             our polarization detector limited our sensitivity to optical activity changes of ∼0.008°, leading to an inability to
             distinguish enantiomeric abundances separated by 5%, but tests show that improvements to our laboratory
             technique can yield a factor of 20 improvement in sensitivity.
             Unified Astronomy Thesaurus concepts: Astrobiology (74); Biosignatures (2018); Jovian satellites (872);
             Polarimetry (1278)

                                      1. Introduction                                      hosts a liquid water ocean beneath a water ice shell (Anderson
                                                                                           et al. 1998; Khurana et al. 1998; Kivelson et al. 2000). The
   The detection of biosignatures on a planetary surface is of
                                                                                           composition of this subsurface ocean may include material
significant scientific interest in the search for life beyond Earth.
                                                                                           critical for life as we know it, and the potential for
High enantiomeric excesses are one such biosignature that
                                                                                           biogeochemical cycling, which could provide a source of
suggests the favoring or concentration of biogenic macro-
                                                                                           energy for life (Hand et al. 2009). Sulfates and chlorides of
molecules. Enantiomers are each of the two non-super-
                                                                                           magnesium and sodium are likely solutes in the ocean (Zolotov
imposable mirror-image configurations of chiral molecules
                                                                                           & Kargel 2009). Magnesium and sodium salts are also
(Figure 1). In biological materials on Earth, the ratio of the
                                                                                           indicated on the surface by spectra (Dalton 2007; Brown &
L-enantiomer to the D-enantiomer of amino acids is high
                                                                                           Hand 2013; Fischer et al. 2015; Trumbo et al. 2019) and by
(Kvenvolden 1973), with a ∼98% L-enantiomer abundance as
                                                                                           color (Hand & Carlson 2015). The ocean’s conductivity
a fraction of the whole for amino acids derived from bacteria
                                                                                           implies that it is at least slightly, and potentially highly, saline;
(Aubrey 2008). In abiotically synthesized amino acids and the
                                                                                           however, the upper limit on the conductivity is not well
amino acids found in meteorites, the two enantiomers are
                                                                                           constrained (Hand & Chyba 2007; Schilling et al. 2007;
generally found in approximately equal amounts (Kvenvolden
                                                                                           Zolotov & Kargel 2009). Based on formation models,
1973), although there are exceptions. L-enantiomer abundances
                                                                                           biologically essential elements such as carbon, nitrogen,
of 50.5%–57.5% (excesses of 1%–15%; Pizzarello 2006), up
                                                                                           phosphorous, and sulfur are likely present in Europa’s ocean
to 60.5% (excesses up to 21%; Elsila et al. 2016), and even
                                                                                           (Hand et al. 2009) and carbon and sulfur compounds have been
>70% (excesses of >40%; Glavin et al. 2012) have been
                                                                                           observed on Europa’s surface (Hand et al. 2009). Other species
reported for some amino acids in meteorites, and terrestrial
                                                                                           observed on Europa’s surface include radiolytically produced
contamination is unlikely to be the cause of the L-enantiomer
excesses in all cases (Pizzarello 2006; Glavin et al. 2012; Elsila                         molecular oxygen and hydrogen peroxide, which are oxidants
et al. 2016).                                                                              that could take part in important chemical cycles (Carlson
   Icy moons of the outer solar system, such as Jupiter’s moon                             et al. 2009).
Europa and Saturn’s moon Enceladus, are targets in the search                                 The surface detection of biological material arising in the
for life elsewhere in the solar system due to their global or                              ocean is predicated on transport through the thick ice cover,
regional subsurface oceans. Magnetometer and radio Doppler                                 leading to emplacement of ocean material on Europa’s surface.
measurements by the Galileo spacecraft indicate that Europa                                Water vapor plumes have been observed (Roth et al. 2014;
                                                                                           Sparks et al. 2016, 2017, 2019; Arnold et al. 2019) potentially
                                                                                           leading to material sourced from the ocean eventually being
                 Original content from this work may be used under the terms
                 of the Creative Commons Attribution 4.0 licence. Any further              deposited on the surface. Various observations and formation
distribution of this work must maintain attribution to the author(s) and the title         hypotheses for Europan surface features also indicate that
of the work, journal citation and DOI.                                                     surface–ocean interactions may occur. Double ridges are

                                                                                       1
The Planetary Science Journal, 1:46 (17pp), 2020 September                                                                                                Cook et al.

Figure 1. Diagram of L-serine and D-serine chemical structure. Note the dashed line connecting the nitrogen for L-serine, indicating that part of the molecule is
extending behind the plane of molecule, and the solid line connecting the nitrogen for the D-serine, indicating that part of the molecule is extending in front of the
plane of the molecule. Modified from National Center for Biotechnology Information. PubChem Database. Note that in water, serine will be in zwitterion form rather
than the neutral form shown here.

common on Europa’s surface and formation hypotheses                                   deg ml g−1 dm−1, is given by
involve upwelling (Greenberg et al. 1998; Head et al. 1999;
                                                                                                                                a
Nimmo & Gaidos 2002) or eruption (Kadel et al. 1998) of                                                             [a]T l =       ,                              (1 )
either ocean water or ice. Patchy, diffuse dark deposits flank                                                                   lc
some ridges and may be due to cryovolcanic eruption or local                          where α is the observed optical rotation in degrees, l is the path
sublimation of icy surface materials due to a subsurface heat                         length in decimeters, and c is the concentration in grams ml−1.
source (Fagents et al. 2000). Another common feature is bands                         For our study, we utilized specific optical rotations for
of new crustal material emplaced between tension fractures.
                                                                                      materials reported in The Merck Index (O’Neil et al. 2001).
Their formation may involve ocean water that has come to the
                                                                                      For a given temperature, wavelength, and path length, the
surface through cracks in the ice shell (Tufts et al. 2000) or
                                                                                      optical rotation is expected to be a linear function of
buoyant upwelling of a deeper layer of ice (Prockter et al.
                                                                                      concentration.
2002). Chaotic terrain is characterized by disrupted plates of
                                                                                         The two enantiomers of a chiral molecule will have optical
preexisting material surrounded by a hummocky matrix.
                                                                                      rotations of equal magnitude and opposite sign. In racemic
Formation hypotheses involve disruption of the ice shell due                          mixtures of two enantiomers (equal amounts of L and D), like
to melt through of the ice (Greenberg et al. 1999), diapirism                         those likely to be found in abiotic materials, no net optical
(Pappalardo et al. 1998), partial melting of brines induced by                        rotation is expected. However, in nonracemic mixtures more
diapirism (Head et al. 1999), and the formation and collapse of                       likely to have a biogenic origin, a net optical rotation that can
melt lenses in the near subsurface (Schmidt et al. 2011).                             be used to constrain the abundance of that chiral molecule is
   A recent NASA report delineated requirements for a Europa                          expected. Because some enantiomeric excesses have been
Lander, which include searching for biosignatures at the                              observed in meteorites, this optical rotation on its own would
moon’s surface using a variety of techniques including                                not be conclusive evidence of a biological origin for the
determining the enantiomeric excess of amino acids to an                              sample. However, optical rotation could strengthen an argu-
accuracy of 5% or better (Hand et al. 2017).                                          ment for potential biology or quickly downselect what samples
   Toward this objective, a camera suite under development,                           are most interesting for detailed analysis by other instruments.
the Cold Lightweight Imager for Europa (C-LIFE), includes a                           Variations on this approach have also been studied. For
microscope capable of detecting the polarization of light                             example, MacDermott et al. (1996) proposed using an array of
transmitted through molten ice samples. Here we assess the                            multiple fixed polarizers at different angles to detect optical
potential of polarization measurements, specifically optical                           rotation. Kothari et al. (2008) tested a system for which the
rotation, to quantify enantiomeric abundances, and determine                          plane-polarized beam entering a sample was rotating, a
the minimum concentration of amino acids that can be detected                         technique that reduced the effect of depolarizing light scattering
using this approach. Given that in situ samples could include                         caused by biological samples. Thaler et al. (2006) utilized a
                                                                                      polarimeter to measure the change in optical rotation over time
mixtures of several amino acids and other compounds such as
                                                                                      during a racemization reaction.
salts, we also determined how the detection limits change when
amino acids are mixed together and when salt is added.                                                                2. Methods
   The abundance of L- and D-enantiomers impacts the
observed optical rotation of light transmitted through a sample.                                                     2.1. Overview
The optical rotation imparted by a molecule is the angle by                              The C-LIFE instrument tested here is a polarization camera
which plane-polarized light is rotated when it passes through a                       with a micropolarizer array over the detector that measures the
sample of the molecule. The measured optical rotation depends                         intensity of light at four different polarizations (Brock et al.
on the wavelength of light, temperature, path length, and                             2011). These values can be used to find the angle by which the
concentration of the solution. The specific optical rotation                           sample rotates linearly polarized light (angle of linear
([a]T l ) at temperature T and wavelength λ, in units of                              polarization, AoLP). We investigated the optical rotation of

                                                                                  2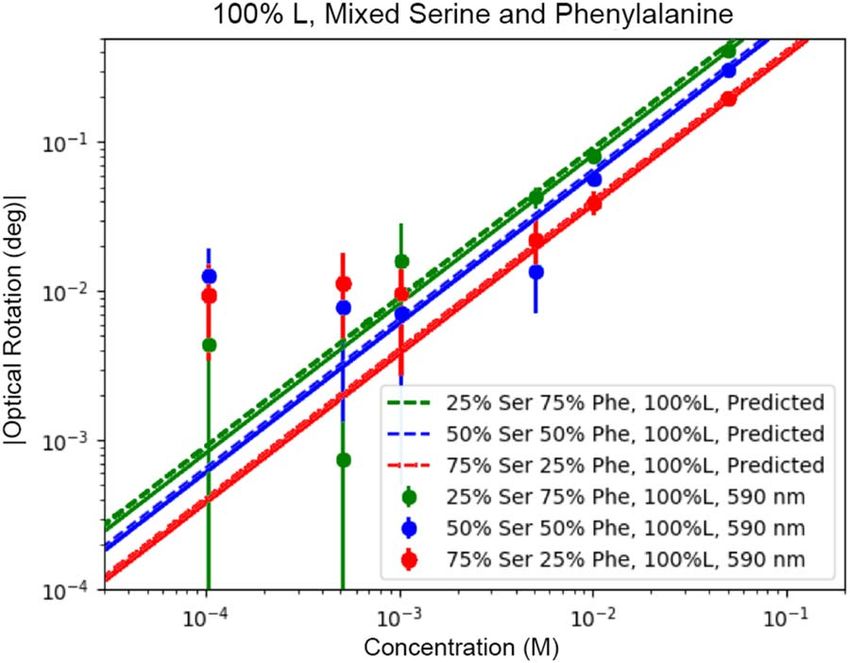
The Planetary Science Journal, 1:46 (17pp), 2020 September Cook et al.
−1 −1
the amino acids serine and phenylalanine for a range of optical rotation of +14.95 deg ml g dm (O’Neil et al. 2001,
enantiomeric abundances. Both of these amino acids function p. 1517), indicating an enantiomeric excess of ∼99%
in proteins and are found in organisms as wells as fossils and (corresponding to an L abundance of ∼99.5%). The measured
sediments on Earth (Kvenvolden 1973). We also conducted a D-serine specific optical rotation of −15.5 deg ml g−1 dm−1 is
small number of measurements of bacterial samples taken from ∼104% of the expected value, making the enantiomeric excess
glacial environments to test whether the optical rotation of such unclear and indicating some of the chemical impurities may
samples could be measured using this instrument. have been optically active. The L-phenylalanine optical
Serine has a specific optical rotation at λ=590 nm and 20 °C rotation of −33.6 deg ml g−1 dm−1 is 96% of the expected
of −6.83 deg ml g−1 dm−1 in water (O’Neil et al 2001, p. 1517). value of −35.1 deg ml g−1 dm−1 in water (O’Neil et al. 2001,
Phenylalanine has a specific optical rotation at λ=590 nm and p. 1305), indicating that the enantiomeric excess is ∼96%
20 °C of −35.1 deg ml g−1 dm−1 in water (O’Neil et al. 2001, p. (corresponding to ∼98% L abundance). The D-phenylalanine
1305). Measuring the optical rotation of both of these amino optical rotation of +33.4 deg ml g−1 dm−1 is ∼95% of the
acids allowed us to determine how the concentration detection expected value. Note that L-abundances shown in figures do
limit for optical rotation differs for molecules with different not take into account the enantiomeric purities discussed here.
magnitudes of optical rotation. These specific amino acids were Amino acids and distilled water (purified by steam
also chosen for their stability over long periods of time. distillation, filtration, and ozonation) were measured by mass,
For each amino acid, we tested L-enantiomer abundances of combined, and stirred (and in some cases heated slightly) until
100% L, 95% L, 90% L, 75% L, 60% L, and 55% L. Note that dissolved. Solutions with any visible insoluble particulates
these correspond to L-enantiomer excesses (%ee = %L – %D) were filtered with an 11 μm filter. We did not filter out smaller
of 100%, 90%, 80%, 50%, 20%, and 10%. We also tested the particles and cells that might have been introduced by the water
corresponding majority D-enantiomer abundances (except for because impurities in the sample and control solutions should
95% D and 90% D). This range spans relative abundances of have the same effect on their optical rotation, and this effect
amino acids from that of a likely biological origin through should mostly cancel out as we utilize only the differences
abundances that are likely abiotically sourced and includes between these values. In addition, our measurements at
several abundances at intervals 5% apart, allowing us to test 590 nm, e.g., for 100% L-serine are close to predicted values
whether these intervals are distinguishable. For each amino at concentrations >10−2 M, indicating that impurities do not
acid and enantiomeric abundance, we measured the optical provide significant optical rotation at those concentrations. At
rotation at a range of concentrations in order to determine the lower concentrations, the measured optical rotations deviate
concentration limit at which optical rotation could no longer be from expected values because instrument errors dominate the
detected. The highest-concentration measured was based on the signal at those concentrations.
solubility of the amino acids. Phenylalanine is less soluble than The masses of water and amino acid were used to calculate
serine (Yalkowsky et al. 2010) so a lower-concentration stock the molality of the solution, which was converted to a molarity.
solution was used for the phenylalanine solutions than those of Serial dilutions were made in distilled water so that a range of
serine. Although L-serine and D-serine should have the same concentrations could be measured, and the solutions were again
solubility, we observed that D-serine was slightly less soluble, filtered if any particulates were visible. The distilled water used
which may be explained by differences in impurities in the as the solvent for these solutions served as a control for the
samples. This limited the maximum concentration of solutions polarization measurements. Measurements were typically made
with a large proportion of D-serine. shortly after mixing solutions. If measurements were not made
Mixtures of materials were also investigated. Solutions on the same day, the solutions were filtered again and stored in
containing different ratios of serine and phenylalanine were sealed containers at 4 °C.
prepared, and their optical rotations were measured to For the solutions to which salt was added, the amino acid
determine how well these combinations can be detected. Salts stock solution and dilutions were made first, and the mass of
have previously been found to affect the optical rotation of salt to be added was determined by their volume. Europa’s
amino acids (Nostro et al. 2006; Rossi et al. 2007). Therefore, ocean salinity is not well constrained, but terrestrial seawater
sodium chloride (NaCl) and magnesium sulfate heptahydrate salinity (∼0.6 M) is among the range of possibilities. For
(MgSO4 · 7H2O) were added to the amino acid solutions to Enceladus, the NaCl concentration of grains sourced from the
determine the effect of potentially Europa-relevant salts plumes is 0.05–0.2 mol kg−1 or ∼0.1–0.4 M (Postberg et al.
(Dalton 2007; Brown & Hand 2013; Fischer et al. 2015; Hand 2009). Thus, we tested salt concentrations of 0.3, 0.6,
& Carlson 2015) on the optical rotation detection limits. and 1.2 M.
Table 1 provides a summary of all experiments performed.
2.3. Optical Setup
2.2. Sample Preparation
Light from an LED was passed through a collimator and
Tested amino acids used were purchased from Acros polarizer to produce plane-polarized light. Two apertures were
Organics and had the following chemical purities: 98% used to control the amount of light entering a cuvette that held
(D-serine), 98.5% (L-phenylalanine), and 99% (L-serine and the sample. After passing through the cuvette, the light was
D-phenylalanine). The enantiomeric purities of these amino detected by a polarization camera, which measures the angle
acid samples are unknown but can be estimated by comparing and degree of linear polarization of the light. Figure 2 shows
specific optical rotation values measured by the manufacturer this experimental setup. The measurements were taken in a
(at λ=590 nm) to literature specific optical rotation values, darkened room with light shields around the cuvette to decrease
assuming that the given compound is the only optically active noise from ambient light.
substance in the sample. The measured L-serine optical rotation Light sources used were 490 nm and 590 nm LEDs
of +14.8 deg ml g−1 dm−1 in HCl is ∼99% of the literature (Thorlabs M490L4, and M590L3, respectively) equipped with
3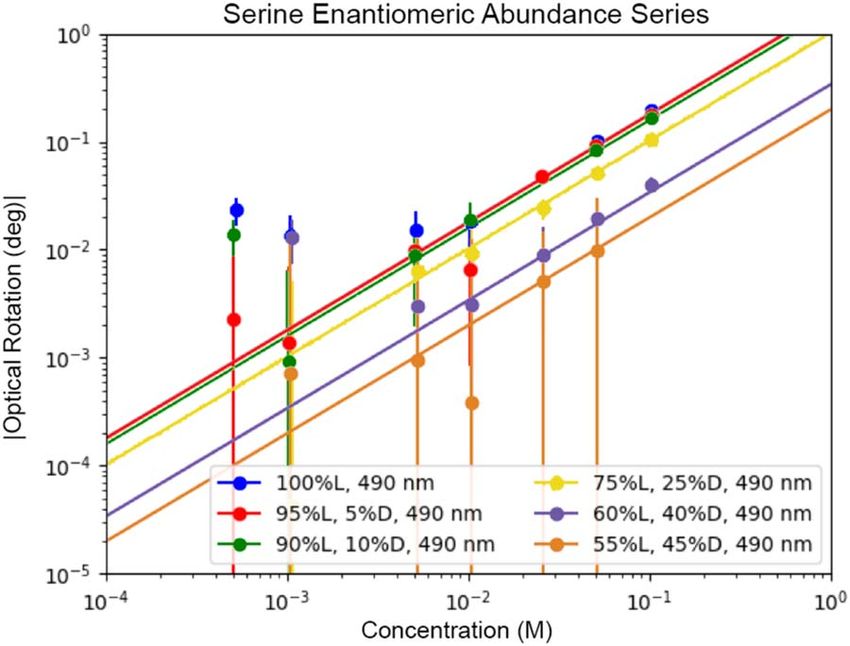
The Planetary Science Journal, 1:46 (17pp), 2020 September Cook et al.
Table 1
Summary of All Experiments Performed
Compound Enantiomeric Abundances Concentration Range (M) Wavelengths (nm)
Serine 100% L 0.1, 0.05, 0.01, 0.005, 0.001, 0.0005 490, 590
Serine 100% D 0.1, 0.05, 0.01, 0.005, 0.001, 0.0005 490
Serine 95% L, 5% D 0.1, 0.05, 0.025, 0.01, 0.005, 0.001, 0.0005 490
Serine 90% L, 10% D 0.1, 0.05, 0.01, 0.005, 0.001, 0.0005 490
Serine 75% L, 25% D 0.1, 0.05, 0.025, 0.01, 0.005, 0.001 490
Serine 60% L, 40% D 0.1, 0.05, 0.025, 0.01, 0.005, 0.001 490
Serine 55% L, 45% D 0.05, 0.025, 0.01, 0.005, 0.001 490
Serine 45% L, 55% D 0.1, 0.05, 0.025, 0.01, 0.005, 0.001 490
Serine 40% L, 60% D 0.1, 0.05, 0.025, 0.01, 0.005, 0.001 490
Serine 25% L, 75% D 0.1, 0.05, 0.025, 0.01, 0.005, 0.001 490
Phenylalanine 100% L 0.05, 0.01, 0.005, 0.001, 0.0005, 0.0001 490, 590
Phenylalanine 100% D 0.01, 0.005, 0.001, 0.0005, 0.0001 490
Phenylalanine 95% L, 5% D 0.01, 0.005, 0.001, 0.0005, 0.0001 490
Phenylalanine 90% L, 10% D 0.01, 0.005, 0.001, 0.0005, 0.0001 490
Phenylalanine 75% L, 25% D 0.01, 0.005, 0.001, 0.0005, 0.0001, 0.00001 490
Phenylalanine 60% L, 40% D 0.01, 0.005, 0.001, 0.0005, 0.0001, 0.00001 490, 590
Phenylalanine 55% L, 45% D 0.01, 0.005, 0.001, 0.0005, 0.0001, 0.00001 490, 590
Phenylalanine 45% L, 55% D 0.01, 0.005, 0.001, 0.0005, 0.0001, 0.00001 490, 590
Phenylalanine 40% L, 60% D 0.01, 0.005, 0.001, 0.0005, 0.0001, 0.00001 490, 590
Phenylalanine 25% L, 75% D 0.01, 0.005, 0.001, 0.0005, 0.0001, 0.00001 490, 590
Equal parts Ser and Phe 100% L 0.05, 0.01, 0.005, 0.001, 0.0005, 0.0001 490, 590
75% Ser, 25% Phe 100% L 0.05, 0.01, 0.005, 0.001, 0.0005, 0.0001 490, 590
25% Ser, 75% Phe 100% L 0.05, 0.01, 0.005, 0.001, 0.0005, 0.0001 490, 590
Equal parts Ser and Phe 75% L, 25% D 0.05, 0.01, 0.005, 0.001, 0.0005, 0.0001 490, 590
Equal parts Ser and Phe 25% L, 75% D 0.05, 0.01, 0.005, 0.001, 0.0005, 0.0001 490, 590
Serine + 1.2M NaCl 100% L 0.5, 0.1, 0.05, 0.01, 0.005, 0.001 490, 590
Serine + 0.6M NaCl 100% L 0.1, 0.05, 0.01, 0.005, 0.001, 0.0005 490, 590
Serine + 0.3M NaCl 100% L 0.5, 0.1, 0.05, 0.01, 0.005, 0.001 490, 590
Phenylalanine + 0.6 NaCl 100% L 0.05, 0.01, 0.005, 0.001, 0.0005, 0.0001 490, 590
Serine + 0.6 M MgSO47H2O 100% L 0.5, 0.1, 0.05, 0.01, 0.005, 0.001 490, 590
a Glan–Thompson prism polarizer (Thorlabs, with extinction wavelengths, could lead to depolarization. Also, optical
ratio >100:1). Specific optical rotation values for serine and rotation behavior for some molecules can change drastically
phenylalanine have previously been measured only for 590 nm at short wavelengths (Schreier et al. 1995), so we did not want
(O’Neil et al. 2001). However, shorter wavelengths tend to to test at wavelengths far from 590 nm, where data were not
induce larger rotations (e.g., Polavarapu & Covington 2015), so available. All of the samples were measured using 490 nm
in theory, lower concentrations could be detected using the light, and select samples were also measured at 590 nm for
490 nm LED. Wavelengths shorter than 490 nm were not tested comparison to previously reported specific optical rotations
because radiation hard glasses doped with cerium, such as (Figure 3). The 490 nm LED emits over a range of wavelengths
might be used in a realistic Europa Lander imager (e.g., around 490 nm (460–520 nm with a peak at 480 nm), so a filter
Centurelli et al. 2018), are opaque at wavelengths shorter than (Thorlabs FL488-1) with a center wavelength of 488±0.2 nm
∼450 nm (Henson & Torrington 2001). In addition, in a and FWHM=1±0.2 nm was used to limit this range. The
realistic sample, optical scattering, which is worse at shorter 590 nm LED emits over a somewhat narrower range of
4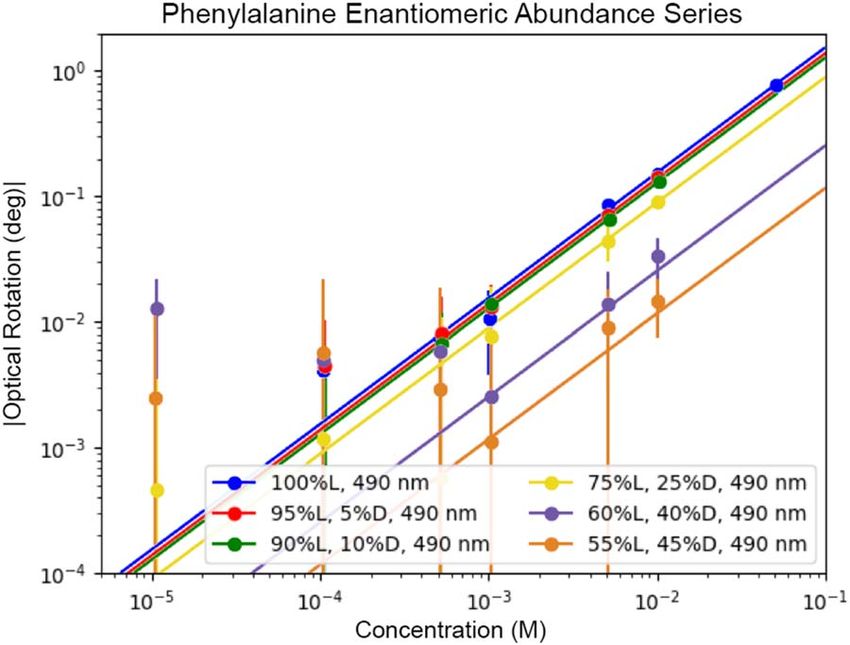
The Planetary Science Journal, 1:46 (17pp), 2020 September Cook et al.
Figure 2. Picture and diagram of the optical setup. From left to right: PolarCam, cuvette, aperture 2, collimator, and polarizer with aperture 1 on the end, LED.
Figure 3. Absolute value of optical rotation of 100% L-serine at 490 and 590 nm. Curves shown are linear fits to the data points. The black dashed line shows the
expected optical rotation at 590 nm using the specific optical rotation and Equation (1).
wavelengths, from 582 to 608 nm with a peak at 596 nm. No The LED optics were focused at infinity, and the LED,
filter was used. Samples (56 ml) were measured in a 200 mm- polarizer, first aperture, and collimator were aligned. The first
long UV quartz cylindrical cell cuvette (FireflySci). The aperture was adjusted to prevent light hitting the edges of the
cuvette length is the path length used in Equation (1) for the polarizer. Then, the cuvette was placed in a stand at the correct
prediction of optical rotation as a function of concentration that height, and the second aperture and cuvette were aligned with
is shown in Figure 3. each other and the other components. The second aperture was
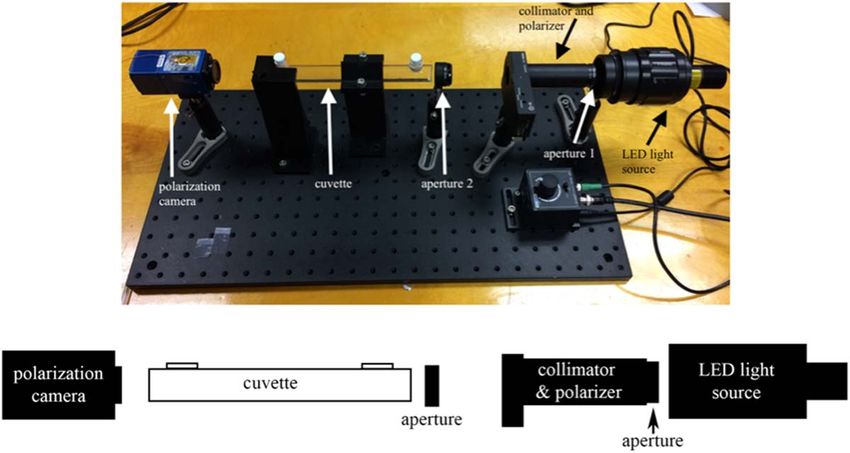
Measurements were obtained with a PolarCam Snapshot adjusted to prevent reflections off the sides of the cuvette. The
Micropolarizer Camera made by 4D Technology. The PolarCam was then aligned with the cuvette, and the polarizer
PolarCam uses a wire grid polarizer array which contains a was rotated to approximately balance the intensity in two of the
pattern of polarizers with 0°, 45°, 90°, and 135° polarizations different polarization quadrants with polarizations of 0° and
that together form a superpixel which is repeated over the array 45°, as we determined the angle of linear polarization is most
(Figure 4; Brock et al. 2011). accurately measured in this configuration. The exposure time
5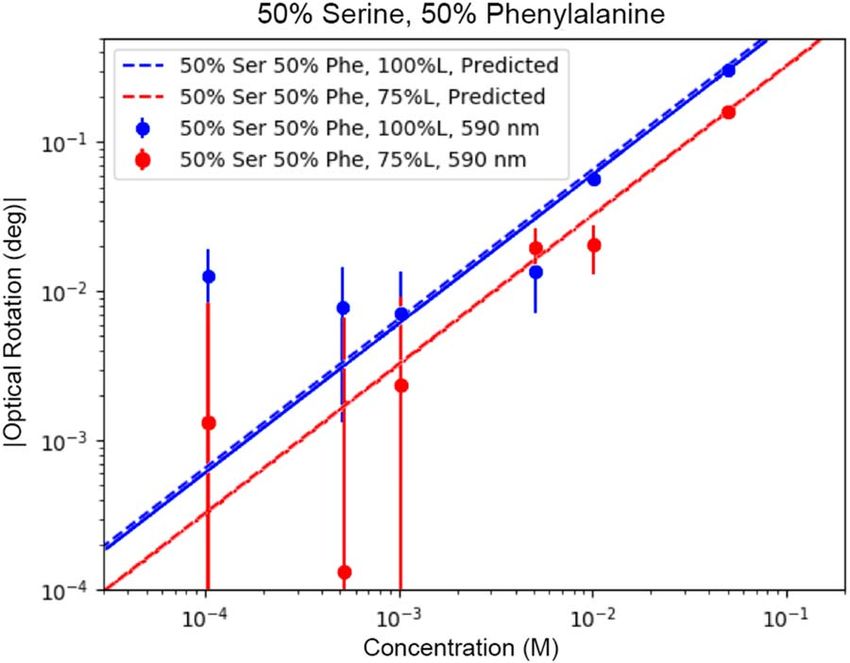
The Planetary Science Journal, 1:46 (17pp), 2020 September Cook et al.
Figure 4. Diagram of the PolarCam charge-coupled device (CCD) sensor overlaid by the polarizer array, a portion of the polarizer array, and the arrangement of a
single superpixel (based on Brock et al. 2011). The dimensions of the CCD sensor are 1700×1200 pixels, which are divided into four-pixel clusters by the polarizer
array to form 850×600 superpixels.
Figure 5. AoLP of water every 30 s over an hour, with the camera warmed up for >1 hr.
(typically a few milliseconds) was adjusted to receive as many 2.5. Data and Error Analysis
photons as possible while avoiding saturation.
PolarView software associated with the PolarCam outputs
the intensity for each pixel of the micropolarizer array, i.e., the
2.4. Data Collection intensities of the 0°, 90°, 45°, and 135° linearly polarized
components (I0, I90, I45, I135) for each superpixel on the
To find the optical rotation caused by the amino acid, the detector. These can be used to find the Stokes vector describing
angle of linear polarization for a control measurement of the polarized light:
distilled water must be subtracted from the angle of linear
polarization measured for the amino acid solution. We reverse ⎡ S0 ⎤ ⎡ I0 + I90 ⎤
the polarity of the angle recorded by the system to be consistent ⎢S ⎥ ⎢ I - I ⎥
with the definitions of positive and negative rotations for L- S = ⎢ 1⎥ = ⎢ 0 90 ⎥
, (2 )
and D-enantiomers. Control measurements were taken before ⎢ S2 ⎥ ⎢ I45 - I135 ⎥
and after measurements of each amino acid solution. The ⎢⎣ S3 ⎥⎦ ⎢⎣ ILHC - IRHC ⎥⎦
cuvette was rinsed twice with distilled water and once with
higher purity ASTM (American Society for Testing and where I0, I90, I45, and I135 are as described above, and ILHC and
Materials) standard type II deionized water (>1 MΩ cm) after IRHC are the left- and right-hand circularly polarized compo-
each measurement of amino acid solutions. nents (not measured by the PolarCam and not required for our
6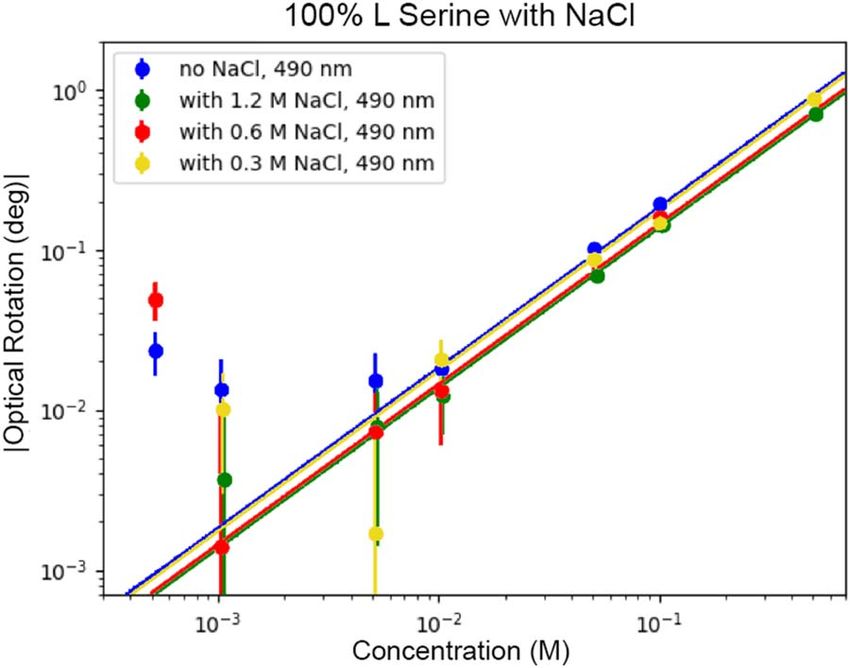
The Planetary Science Journal, 1:46 (17pp), 2020 September Cook et al.
calculations). The components of the Stokes vector can be used
to find the degree of linear polarization (DoLP), which is the
fraction of incident light that is linearly polarized:
S12 + S22
DoLP = . (3 )
S0
They can also be used to find the AoLP, which is the
polarization angle of the incident light relative to the detector
axis:
1 ⎛S ⎞
AoLP = arctan ⎜ 2 ⎟. (4)
2 ⎝ S1 ⎠
Systematic errors were caused by the measured AoLP
changing over time and this error depended significantly on the
temperature of the camera. This error was partially mitigated,
and results converged to their final values if the camera was Figure 6. Histogram of the absolute value of the difference between the
allowed to warm up for at least 1 hr. Therefore, all of the interpolated AoLP and measured AoLP using tcc and tcs for the serine 100%
measurements reported here were taken after the camera L, 0.1 M measurements.
warmed up for at least 1 hr. After finding the AoLP and DoLP
for each superpixel of the detector for each measurement, the
average AoLP over all superpixels on the detector was the error we base detection limits on. However, we also
determined. The large number of superpixels behave as many calculated the error for the AoLP from a single measurement.
independent polarimeters to increase the resolution of the We propagated the standard deviation for each of the intensity
system and reduce the noise contributed by any single pixel in measurements to get the error for the AoLP measurements.
the micropolarizer array. This gives an average AoLP error of ∼0.008°.
Error is dominated by the systematic drift in AoLP with
time. Thus, measurements of the sample and control (at
2.6. Bacterial Sample Measurements
different times) cannot be simply subtracted. We mitigate the
impact of drift of the control AoLP by linearly interpolating Bacteria contain a variety of metabolites and biomolecules
between the AoLP for the controls taken before and after the including compounds such as L-amino acids and D-sugars,
sample measurement to find what the control AoLP would be at either of which can have positive or negative optical rotations.
the time the sample measurement was taken. We then subtract However, rotation in some direction is expected due to the low
the AoLP of the sample from this control AoLP to get the likelihood that the summed rotations of an abundance of chiral
optical rotation (this convention gives the appropriate sign for molecules would exactly cancel to zero. Previous polarimetric
the optical rotation). observations found that microorganisms have a negative
This approach depends on the AoLP measurements being rotation (Berthod et al. 2003) and that proteins exhibit optical
taken close in time so that changes appear linear. To determine activity because of both their asymmetric structure and their
the accuracy of this approach, we took measurements of constituent amino acids (Jirgensons 1973). Here, we measured
distilled water every 30 s for an hour (Figure 5). AoLP varied the optical rotations of three bacterial samples isolated from icy
by up to 0.09° during this time at rates of up to 8×10⁻⁵ deg environments. These were (1) Marinobacter gelidimuriae
s−1. We used those measurements to find the difference (Chua et al. 2018), a moderate halophile originally isolated
between the measured AoLPs and AoLPs based on linear from a subglacial brine (salinity 8%) that discharges at a glacial
interpolation between two measurements at time t1 and feature known as Blood Falls in Antarctica; (2) a Shewanella
t1 + tcc , where tcc is the time between control measure- strain designated Schw_1 from the surface ice around Blood
ments for a given amino acid solution. This linear interpolation Falls, where subglacial salts precipitate at the surface and
was used to calculate a value for the AoLP at a time t1 + tcs, freezing and thawing regularly occurs; and (3) an isolate
where tcs is the time between the first control measurement denoted strain Easton_1, originally from snowpack on Easton
and the sample measurement for an amino acid solution. We Glacier, WA, USA. All cultures were initially grown in
calculated ∣AoLPmeasured (t1 + tcs)–AoLPinterpolated (t1 + tcs)∣ commercially available media. The M. gelidimuriae sample
and repeated this for every pair of measurements at a time tcc and Schw_1 were grown in a marine broth (DIFCO) and
apart. The histogram of these differences based on tcc and tcs Easton_1 was grown in a lower nutrient, low conductivity
for one amino acid solution is shown in Figure 6. To be broth (R2A; Bacto).
conservative in finding detection limits, we take the 90th The bacteria were allowed to grow until they reached
percentile value of these differences as the error. This process stationary phase at a concentration estimated to be ∼108 cells
was repeated for every amino acid solution because tcc and ml−1. Because they reached stationary phase, it is likely that
tcs are different for each. The average of the 90th percentile some lysed cells were present in the measured samples. Before
errors, for all amino acid solutions, is ∼0.008°, but it ranges measurement, cells were separated from media by gentle
between 0.004° and 0.03°. centrifugation (1163 × g for 10 minutes) so that additional cells
The error described above determines the consistency of were not lysed by this process. Cell pellets were resuspended in
results from multiple measurements of the same sample and is pH 7 phosphate buffer (Fisher Chemical) and then serial-diluted
7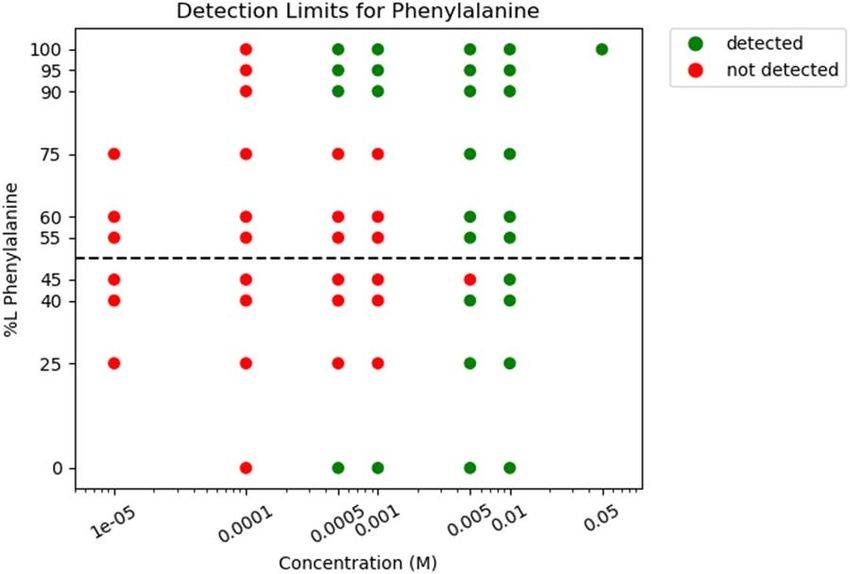
The Planetary Science Journal, 1:46 (17pp), 2020 September                                                                                              Cook et al.

Figure 7. Absolute value of optical rotation of serine for various L-enantiomer abundances and concentrations. Curves shown are linear fits to the data points with a
prescribed intercept of (0, 0).

Figure 8. Absolute value of optical rotation of phenylalanine for various L-enantiomer abundances and concentrations. Curves shown are linear fits to the data points
with a prescribed intercept of (0, 0).

at known concentrations. This work was done in a class II                                                             3. Results
biosafety cabinet. Measurements were conducted in essentially
                                                                                                         3.1. Serine and Phenylalanine
the same way as the amino acid measurements, using the
phosphate buffer as the control rather than water. We were not                          Measured optical rotation values for the serine experiments
able to take optical density measurements of the samples;                            at 490 nm (Figure 7) confirm the expected result that more
however, the highest-concentration samples were almost opaque,                       equal enantiomeric abundances result in a smaller optical
while the lower-concentration samples were more transparent,                         rotation. The relation between optical rotation and concentra-
necessitating adjustment of exposure time and the size of the first                   tion is linear down to ∼0.005 M, below which optical rotations
aperture between each concentration.                                                 are not detectable. The apparent nonlinearity we observed at

                                                                                 8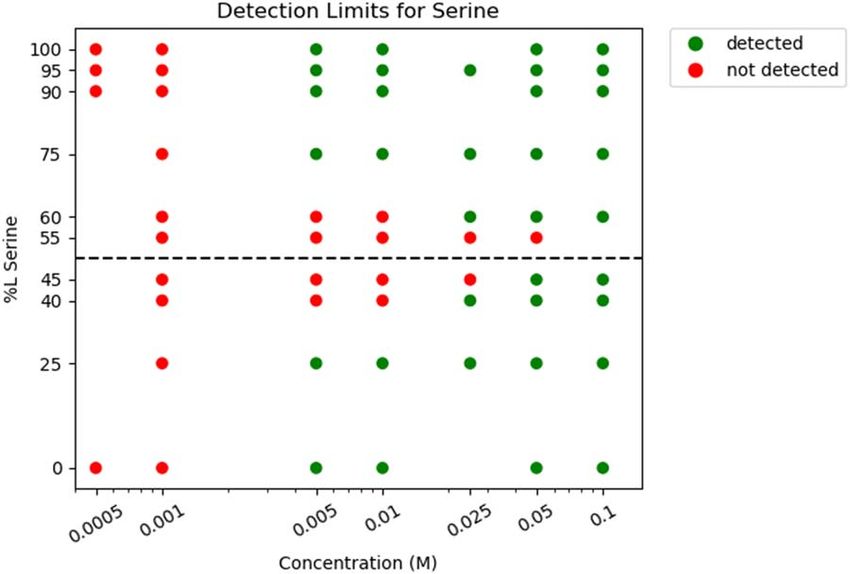
The Planetary Science Journal, 1:46 (17pp), 2020 September                                                                                                 Cook et al.

Figure 9. L-serine percent abundance vs. concentration, with colors representing whether the corresponding solutions had detectable optical rotation. Green dots
represent samples with concentrations at the detection limit or higher. Red dots represent samples with concentrations below the detection limit. The dashed line is at
50% (no enantiomeric excess). Results are generally symmetric about that line, with the exception of 55% L-serine and 45% L-serine.

Figure 10. L-phenylalanine abundance vs. concentration, with colors representing whether the corresponding solutions had detectable optical rotation. Green dots
represent samples with concentrations at the detection limit or higher. Red dots represent samples with concentrations below the detection limit. The dashed line is at
50% (no enantiomeric excess). Results are generally symmetric about that line, with the exception of 55% L- phenylalanine and 45% L- phenylalanine.

the lowest concentrations is understood to be due to                                   concentration measurement satisfies conditions (1) and (2).
measurement limitations, rather than a physical difference in                          Detections could potentially occur at concentrations between
the dependence of rotation on concentration.                                           this concentration and the next lowest investigated concentra-
   Measured optical rotation values for phenylalanine experi-                          tion that did not satisfy the conditions. Note that in the
ments at 490 nm (Figure 8) were higher at any given                                    following, we present results using L or D abundances rather
concentration than for serine. The relation between optical                            than enantiomeric excess.
rotation and concentration is linear down to ∼0.0005 M but at                             We confirmed that the concentration detection limit for
lower concentrations appears to be nonlinear, again likely due                         lower enantiomeric excesses is higher, e.g., compare abun-
to measurement limitations.                                                            dances of 100% L- to 45% L-serine (Figure 9 and Table 2). In
   In this study, we designated the concentration detection limit                      addition, it is observed that detection limits for solutions with
for optical rotation as the lowest concentration for which (1) the                     some L-enantiomeric abundance and the equivalent
optical rotation plus or minus its error never crosses zero, (2)                       D-enantiomeric abundance are generally the same. This is the
the optical rotation has the expected sign, and (3) every higher                       case for 100% L- and 100% D-serine, 75% L- and 75%

                                                                                  9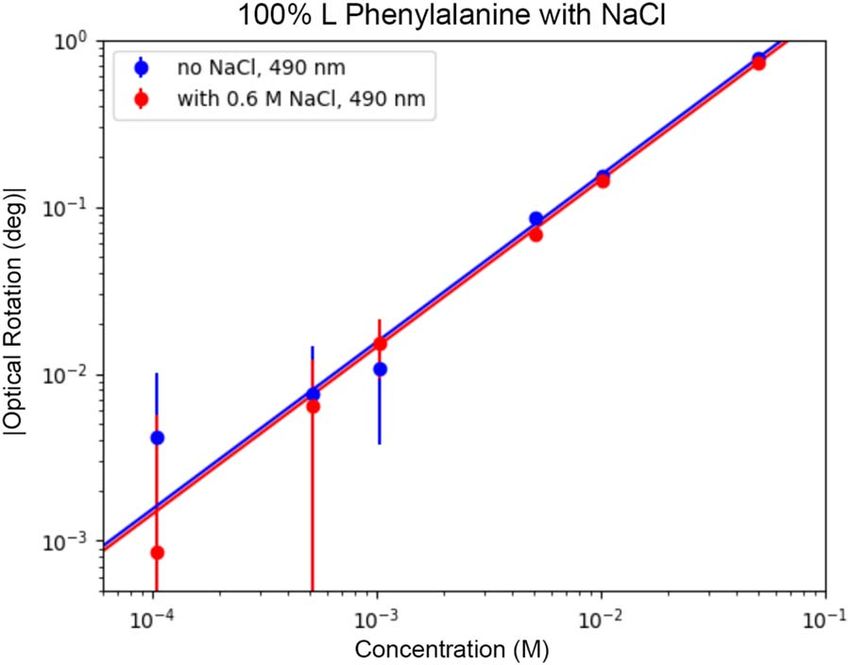
The Planetary Science Journal, 1:46 (17pp), 2020 September                                                                                            Cook et al.

                                Table 2                                                                                  Table 3
         Summary of Detection Limits for Serine and Phenylalanine                         Summary of Amino Acid Solutions with Enantiomeric Abundances 5% Apart
                                                                                              and Concentrations at Which Optical Rotations of the Two Were
                                        Concentration            Next Lowest                           Distinguishable (Taking Errors into Account)
                    Enantiomeric       Detection Limit at       Measured Con-
Amino Acid          Abundances           490 nm (M)             centration (M)                                         Concentrations (M) at Which Optical Rota-
                                                                                          Solutions                    tions Are Distinguishable
Serine                100% L                 0.005                  0.001
                                                                                          Serine 100% L and 95% L      0.1
                   95% L, 5% D               0.005                  0.001
                                                                                          Serine 95% and 90% L         None
                  90% L, 10% D               0.005                  0.001
                                                                                          Serine 60% L and 55% L       None
                  75% L, 25% D               0.005                  0.001
                                                                                          Serine 45% L and 40% L       None
                  60% L, 40% D               0.025                  0.01
                                                                                          Phenylalanine 100% L and     0.005
                  55% L, 45% D                None                                          95% L
                  45% L, 55% D               0.05                   0.025                 Phenylalanine 95% and        None
                                                                                            90% L
                  40% L, 60% D               0.025                  0.01
                                                                                          Phenylalanine 60% L and      None
                  25% L, 75% D               0.005                  0.001
                                                                                            55% L
                      100% D                 0.005                  0.001
                                                                                          Phenylalanine 45% L and      None
Phenylalanine         100% L                 0.0005                 0.0001                  40% L

                   95% L, 5% D               0.0005                 0.0001

                  90% L, 10% D               0.0005                 0.0001                next higher concentration of 0.01 M, and no other sets of
                  75% L, 25% D               0.005                  0.001
                                                                                          phenylalanine measurements with enantiomeric abundances
                                                                                          5% apart were distinguishable at any of the measured
                  60% L, 40% D               0.005                  0.001                 concentrations. Therefore, we conclude that no pairs of
                  55% L, 45% D               0.005                  0.001
                                                                                          phenylalanine solutions with enantiomeric abundances 5%
                                                                                          apart were consistently separable. Note that in Figures 7 and 8,
                  45% L, 55% D               0.01                   0.005                 these pairs are not clearly distinguishable because of the
                  40% L, 60% D               0.005                  0.001
                                                                                          logarithmic scale.
                                                                                             Table 4 shows the concentrations at which the percent errors
                  25% L, 75% D               0.005                  0.001                 (error divided by absolute value of the optical rotation) were
                      100% D                 0.0005                 0.0001
The Planetary Science Journal, 1:46 (17pp), 2020 September Cook et al.
Figure 11. Absolute value of optical rotation of mixtures of 100% L-serine and 100% L-phenylalanine. Solid curves shown are linear fits to the data points, passing
through (0, 0). Dashed curves are based on Equation (1) using a linear combination of the specific optical rotations for serine and phenylalanine.
3.3. Effect of Adding Salts to Amino Acid Solutions
Table 4
Adding NaCl and MgSO47H2O slightly decreased the Summary of Concentrations for All Serine and Phenylalanine Experiments at
optical rotation of serine (Figure 13) and phenylalanine. Which the Percent Error WasThe Planetary Science Journal, 1:46 (17pp), 2020 September Cook et al.
Figure 12. Absolute value of optical rotation of 50% serine, 50% phenylalanine mixtures for various L-enantiomer abundances and concentrations. Solid curves
shown are linear fits to the data points, passing through (0, 0). Dashed curves are based on Equation (1) using a linear combination of the specific optical rotations for
serine and phenylalanine.
Table 5
Summary of Detection Limits for All Experiments Involving Mixtures of Serine and Phenylalanine
Amino Acid Mixture Enantiomeric Abundances Concentration Detection Limit (490 nm) (M) Next Lowest Measured Concentration (M)
50% Serine, 50% Phenylalanine 100% L 0.005 0.001
50% Serine, 50% Phenylalanine 75% L, 25% D 0.005 0.001
50% Serine, 50% Phenylalanine 25% L, 75% D 0.005 0.001
75% Serine, 25% Phenylalanine 100% L 0.005 0.001
25% Serine, 75% Phenylalanine 100% L 0.001 0.0005
to instrument noise, although it is possible that positive optical protocol to decrease the time between the control measurement
rotations could be due to the bacteria producing D-amino acids and the sample measurement or otherwise calibrate the system
with positive optical rotations (Cava et al. 2011). could decrease the errors.
NASA’s Europa Lander report stipulated that enantiomeric
4. Discussion excess should be quantified with an accuracy of 5% or better
Although in general we find that many of our measurements (Hand et al. 2017). Using the C-LIFE instrument, the percent
follow expected trends, there are some discrepancies, due error in the optical rotation is >5% at the detection limit, and
primarily to variability in the magnitude of the systematic error solutions with enantiomeric abundances 5% different (corresp-
caused by drift in measured AoLP over time. We mitigate this onding to enantiomeric excesses 10% different) are rarely
error by comparing our sample AoLP to a control AoLP value distinguishable through their polarization effects. Even when
obtained by linearly interpolating between control AoLP they are distinguishable, the concentrations at which they are
measurements taken before and after the sample measurement, distinguishable are more than an order of magnitude higher
but this does not completely correct for the problem because than the detection limits, meaning that even if an amino acid
the change in AoLP is not precisely linear. Measurements taken were detected at the C-LIFE instrument detection limits, the
while the AoLP is changing nonlinearly have errors, and this enantiomeric excess could not necessarily be determined to the
may affect the detection limits found. In addition, slight desired accuracy.
variability in the amount of time taken between the control and The Europa Lander report also stipulates detecting amino
sample measurements can influence the magnitude of errors acids (using an instrument like a separation mass spectrometer)
(the longer the time between measurements, the larger the error to approximately the nM level (Hand et al. 2017). However, if
if AoLP changes nonlinearly), and this may affect the detection amino acids were detected at this level, the polarization camera
limits found. Further improvements to the measurement we tested could not determine their enantiomeric excess. A
12The Planetary Science Journal, 1:46 (17pp), 2020 September Cook et al.
Figure 13. Absolute value of optical rotation of 100% L-serine with various molarities of NaCl added. Curves shown are linear fits to the data points, passing through
(0, 0).
Figure 14. Absolute values of optical rotation of Marinobacter gelidimuriae.
much higher concentration, of >10−4 M, is needed to compare the control measurement and the sample measurement
determine the optical rotation of amino acids using this to an intermediate measurement before comparing them to each
approach as is. other. We tested measuring the LED polarization before and
To estimate the precision required to have a 5% error, we after the control measurement and before and after the sample
consider the optical rotation of 0.05 M 60% L-serine, which measurement by removing the filled cuvette from the setup,
was ∼ −0.02°, so an error of 5% would be 0.001°, which is which took less than a minute, rather than the ∼5 minutes
about four times lower than the lowest errors we found. One needed to switch the contents of the cuvette. An optical rotation
way of decreasing the errors is decreasing the time between the value for the control compared to the LED with no cuvette was
control and sample measurements. For example, we could found by comparing the control AoLP measurement to the
13The Planetary Science Journal, 1:46 (17pp), 2020 September Cook et al.
LED-only AoLP measurements taken beforehand and after- (Nostro et al. 2006; Rossi et al. 2007). We found that the
wards. The error was estimated using interpolation of the LED- addition of relevant salts, including NaCl, decreased optical
only measurements as described in Section 2.5. An optical rotation for serine and phenylalanine, but not significantly.
rotation for the sample compared to the LED with no cuvette While the salt concentrations tested in this study were relatively
was found in the same way. The difference between the sample low, these results are encouraging as salts can challenge many
optical rotation relative to LED and control optical rotation analytic techniques.
relative to LED gives the optical rotation for the sample relative Results from our microbial isolate measurements were
to control. This method yielded errors of ∼0.0004° (a 20-fold equivocal, particularly at low concentrations. This is most
improvement), which would be less than a 5% error for a likely due to instrument systematic errors or noise. However, it
sample with an optical rotation of magnitude 0.01°. could be due in part to D-amino acid synthesis. While the role
To estimate the precision required to distinguish samples of D-amino acid synthesis in prokaryotic cells remains poorly
with L-abundances 5% different, we consider the optical understood, recent studies suggest a variety of cellular
rotation of 0.005 M 100% L- and 95% L-serine, which are regulatory and ecological functions for D-amino acids (Cava
different by 0.01°. Distinguishing them would require each of et al. 2011; Hernández & Cava 2016). For example, evidence
these measurements to have an error of less than half that, shows D-amino acid synthesis plays a role in regulating cell
0.005°. This could also be achieved using the modification wall construction, sporulation, or biofilm disruption (Cava et al.
described above. However, the ability to detect optical rotation 2011), with differences of D-amino acid concentrations
at this precision depends on the concentration detection limit of potentially reflecting distinct growth conditions (Cava et al.
the instrument, and this presents a more stringent requirement 2011; Radkov & Moe 2014). Thus, the possibility exists to
that is farther beyond the capabilities of this instrument. We can elucidate novel enantiomeric patterns that reflect various
estimate the required concentration detection limit by con- ecological conditions. To this end, future work could include
sidering the amino acid content in Earth’s polar oceans. The measuring enantiomeric patterns at various stages of growth,
dissolved free amino acid concentration in winter circumpolar mixtures of cultures, and environmental analog samples.
deep ocean water is ∼88 nM (Hand et al. 2017). To estimate Additionally, microorganisms respond to environmental con-
the optical rotation required to detect these amino acids, we use ditions. Structures, such as spores, can provide microorganisms
the mass and optical rotation (at 590 nm) of the most abundant with protection under harsh conditions or in nutrient-limited
optically active amino acid in aquatic environments, serine environments, and similar cellular structures may be an
(Moura et al. 2013). Assuming an Earth-like enantiomeric important survival strategy on ocean worlds (Robinson &
Mikucki 2018). Combining optical measurements of amino
excess of 96% and using Equation (1), we find an optical
acid enantiomeric abundances using a polarization camera with
rotation of ∼10−7 deg. In estimating this, we assume that the
the detection of other biosignatures for ecological status, such
behavior of the measured optical rotation as a function of
as dipicolinic acid, a biosignature for spore formation, could
concentration is linear up to the detection limit and therefore
provide multiple lines of evidence for life detection.
Equation (1) is valid. Optical rotation measured with the
PolarCam is approximately linear up to its detection limit, so
with a similar but more sensitive instrument, we might also 5. Conclusions
expect the results to be linear to smaller concentrations. We used polarized light to measure the optical rotation of
This more stringent requirement for the sensitivity of the serine and phenylalanine for various enantiomeric abundances
instrument is beyond the capabilities of even current state-of- and concentrations in order to determine the lowest concentra-
the-art laboratory instruments. For instance, the Anton Paar tion at which a nonzero optical rotation, indicative of a
MCP-500 Sucromat saccharimeter is capable of measuring nonracemic mixture of enantiomers, could be detected. We
0.0001° optical rotation. Other state-of-the-art instruments found that concentrations greater than 10−3 M are needed to
obtain polarization errors of 0.0007° (van Harten et al. 2014). detect serine and concentrations greater than 10−4 M are
However, these laboratory instruments are not easily adapted to needed to detect phenylalanine, with larger concentrations
a Europa-like temperature and radiation environment or the needed for smaller enantiomeric excesses. Mixtures of amino
constraints of a small lander. This motivates our testing of an acids are well approximated by averages of the optical rotations
instrument with minimal active mechanical parts that could be of the components, weighted by the proportion of the amino
integrated into another lander system like an imager. acid present in the mixture. Europa-relevant salts do not have a
There are other possible avenues for improving the significant effect on the optical rotation. Measurements of
sensitivity of the PolarCam that we have not explored. The bacterial samples were made as proof of concept, showing that
limited sensitivity of the PolarCam is partly due to its low their optical rotation can be detected with this technique.
extinction ratio (∼20–100), as well as nonuniformity in the Further studies using this approach with a wider range of
pixel-to-pixel polarizer characteristics. Improving these aspects microbial cells in a diversity of milieus may elucidate
of the sensor and polarizer array could be useful in increasing ecological patterns of microbial biosignatures. Continued effort
the sensitivity. The temperature was an important factor in the to apply high technical readiness level instrumentation to life
drift of AoLP over time, so further stabilizing the temperature detection is critical for future exploration of ocean worlds such
with better heat sinking could be beneficial. Other possibilities as Europa.
for reducing noise are to further reduce the small amount of
ambient light during the experiments, averaging more frames, Funding for this work was provided by NASA COLDTech
and further reducing the gain while increasing the exposure Award NNX17AF69G to S.B. and NASA Exobiology
(Brock et al. 2011, and personal communication). 80NSSC17K0243 to J.A.M. We thank L. Powers for providing
A decrease in the magnitude of optical rotation of serine in lab space for the bacteria optical rotation experiments and
the presence of NaCl has been observed in previous studies thank C. Schuler and E. Taylor for shipping glacial strains.
14The Planetary Science Journal, 1:46 (17pp), 2020 September Cook et al.
We also thank two anonymous reviewers for their helpful The detection limit for serine with 0.3 M NaCl and with 0.6 M
feedback. MgSO47H2O is higher than that without salt, while all of the
other detection limits are the same as with no salt added. The
higher detection limit of 0.01 M serine with the addition of 0.3 M
Appendix NaCl and 0.6 M MgSO47H2O is due to the optical rotations
A.1. Effect of Adding Salts to Amino Acid Solutions measured at 0.005 M serine being the wrong sign for both. The
The addition of NaCl to phenylalanine did not significantly errors for these measurements are slightly larger than for the
change the optical rotation (Figure A1). The addition of NaCl others (around 7×10⁻³ and 8×10⁻³ rather than 6×10⁻³)
because of slightly more time being taken between measurements
and MgSO47H2O to serine also did not significantly affect the
(∼100 s longer). However, taking errors into account, the optical
detection limits for optical rotation (Table A1).
rotations of all the measurements taken with salt added overlap.
Figure A1. Absolute value of the optical rotation of 100% L-phenylalanine with 0.6 M NaCl added. Curves shown are linear fits to the data points, passing through (0,
0). Salt does not significantly affect the optical rotation.
Table A1
Summary of Detection Limits for All Experiments Involving Mixtures of Amino Acids and Salts
Amino Acid Salt Concentration Detection Limit (490 nm) (M, of amino acid) Next Lowest Measured Concentration (M)
100% L-serine none 0.005 0.001
100% L-serine 0.3 M NaCl 0.01 0.005
100% L-serine 0.6 M NaCl 0.005 0.001
100% L-serine 1.2 M NaCl 0.005 0.001
100% L-serine 0.6 M MgSO47H2O 0.01 0.005
100% L-phenylalanine none 0.0005 0.0001
100% L-phenylalanine 0.6 M NaCl 0.0005 0.0001
15The Planetary Science Journal, 1:46 (17pp), 2020 September Cook et al.
A.2. Bacteria Optical Rotation rotations and erratic jumps in the magnitude of optical rotation,
The Schw_1 and Easton_1 samples (Figures A2 and A3, which are most likely due to instrument noise.
respectively) exhibit unusual results, including positive optical
Figure A2. Absolute values of the optical rotation of the Schw_1 sample.
Figure A3. Absolute values of the optical rotation of the Easton_1 sample.
16The Planetary Science Journal, 1:46 (17pp), 2020 September Cook et al.
ORCID iDs Kadel, S. D., Fagents, S. A., Greeley, R., & Team, G. S. 1998, LPI, 29,
1078
Claire Cook https://orcid.org/0000-0001-8202-7263 Khurana, K. K., Kivelson, M. G., Stevenson, D. J., et al. 1998, Natur, 395,
777
References Kivelson, M. G., Khurana, K. K., Russell, C. T., et al. 2000, Sci, 289, 1340
Kothari, N., Jafarpour, A., Trebino, R., Thaler, T. L., & Bommarius, A. S.
Anderson, J. D., Schubert, G., Jacobson, R. A., et al. 1998, Sci, 281, 2019 2008, AsBio, 8, 1061
Arnold, H., Liuzzo, L., & Simon, S. 2019, GeoRL, 46, 1149 Kvenvolden, K. A. 1973, SLSci, 4, 60
Aubrey, A. D. 2008, Amino Acid Biosignatures—Implications for the MacDermott, A. J., Barron, L. D., & Brack, A. 1996, P&SS, 44, 1441
Detection of Extinct or Extant Microbial Communities on Mars (San Moura, A., Savageau, M. A., & Alves, R. 2013, PLoSO, 8, e77319
Diego, CA: Univ. California) Nimmo, F., & Gaidos, E. 2002, JGR, 107, 5021
Nostro, P. L., Ninham, B. W., Milani, S., Fratoni, L., & Baglioni, P. 2006,
Berthod, A., Zhang, B., & Armstrong, D. W. 2003, J. Sep. Sci., 26, 20
Brock, N., Kimbrough, B. T., & Millerd, J. E. 2011, Proc. SPIE, 8160, Biopolymers, 81, 136
81600W O’Neil, M., Smith, A., Heckelman, P. E., et al. 2001, The Merck Index: An
Brown, M. E., & Hand, K. P. 2013, AJ, 145, 110 Encyclopedia of Chemicals, Drugs, and Biologicals (13th ed.; Whitehouse
Carlson, R. W., Calvin, W. M., Dalton, J. B., et al. 2009, in Europa, ed. Station, NJ: Merck & Co. Inc.)
R. T. Pappalardo, W. B. McKinnon, & K. K. Khurana (Tucson, AZ: Univ. Pappalardo, R. T., Head, J. W., Greeley, R., et al. 1998, Natur, 391, 365
Pizzarello, S. 2006, Acc. Chem. Res., 39, 231
Arizona Press), 283
Polavarapu, P. L., & Covington, C. L. 2015, PCCP, 17, 21630
Cava, F., Lam, H., de Pedro, M. A., & Waldor, M. K. 2011, Cell. Mol. Life
Sci., 68, 817 Postberg, F., Kempf, S., Schmidt, J., et al. 2009, Natur, 459, 1098
Centurelli, J., Turtle, Z. P., Slack, K. A., Osterman, S. N., & Roth, D. R. 2018, Prockter, L. M., Head, J. W., Pappalardo, R. T., et al. 2002, JGR, 107, 5028
Proc. SPIE, 10698, 106984D Radkov, A. D., & Moe, L. A. 2014, Appl. Microbiol. Biotechnol., 98, 5363
Chua, M. J., Campen, R. L., Wahl, L., Grzymski, J. J., & Mikucki, J. A. 2018, Robinson, J. M., & Mikucki, J. A. 2018, in Habitability of the Universe Before
Earth, ed. R. Gordon & A. A. Sharov (Cambridge, MA: Academic
FEMS Microbiol. Ecol., 94, fiy021
Press), 199
Dalton, J. B. 2007, GeoRL, 34, L21205
Elsila, J. E., Aponte, J. C., Blackmond, D. G., et al. 2016, ACS Cent. Sci., Rossi, S., Nostro, P. L., Lagi, M., Ninham, B. W., & Baglioni, P. 2007,
2, 370 JPhChB, 111, 10510
Fagents, S. A., Greeley, R., Sullivan, R. J., et al. 2000, Icar, 144, 54 Roth, L., Saur, J., Retherford, K. D., et al. 2014, Sci, 343, 171
Fischer, P. D., Brown, M. E., & Hand, K. P. 2015, AJ, 150, 164 Schilling, N., Neubauer, F. M., & Saur, J. 2007, Icar, 192, 41
Glavin, D. P., Elsila, J. E. S. B. A., Callahan, M. P., et al. 2012, M&PS, Schmidt, B. E., Blankenship, D. D., Patterson, G. W., & Schenk, P. M. 2011,
47, 1347 Natur, 479, 502
Greenberg, R., Geissler, P., Hoppa, G., et al. 1998, Icar, 135, 64 Schreier, P., Bernreuther, A., & Huffer, M. 1995, Analysis of Chiral Organic
Greenberg, R., Hoppa, G. V., Tufts, B. R., et al. 1999, Icar, 141, 263 Molecules: Methodology and Applications (Berlin: De Gruyter & Co), 17
Hand, K. P., & Carlson, R. W. 2015, GeoRL, 42, 3174 Sparks, W. B., Hand, K. P., McGrath, M. A., et al. 2016, ApJ, 829, 121
Hand, K. P., & Chyba, C. F. 2007, Icar, 189, 424 Sparks, W. B., Richter, M., deWitt, C., et al. 2019, ApJL, 871, L5
Hand, K. P., Chyba, C. F., Priscu, J. C., Carlson, R. W., & Nealson, K. H. Sparks, W. B., Schmidt, B. E., McGrath, M. A., et al. 2017, ApJL, 839, L18
2009, in Europa, ed. R. T. Pappalardo, W. B. McKinnon, & K. K. Khurana Thaler, T. L., Gibbs, P. R., Trebino, R. P., & Bommarius, A. S. 2006, AsBio,
(Tucson, AZ: Univ. Arizona Press), 589 6, 901
Hand, K. P., Murray, A., Gavin, J. B., et al. 2017, Europa Lander Mission— Trumbo, S. K., Brown, M. E., & Hand, K. P. 2019, SciA, 5, eaaw7123
Europa Lander Study 2016 Report JPL D-97667 (Pasadena, CA: JPL) Tufts, B. R., Greenberg, R., Hoppa, G., & Geissler, P. 2000, Icar, 146, 75
Head, J. W., Pappalardo, R. T., & Sullivan, R. 1999, JGRE, 104, 24223 van Harten, G., Snik, F., Rietjens, J. H. H., Martijn Smit, J., & Keller, C. U.
Henson, T. D., & Torrington, G. K. 2001, Proc. SPIE, 4452, 54 2014, ApOpt, 53, 4187
Hernández, S. B., & Cava, F. 2016, Environ. Microbiol., 18, 1673 Yalkowsky, S. H., He, Y., & Jain, P. 2010, Handbook of Aqueous Solubility
Jirgensons, B. 1973, in Optical Activity of Proteins and Other Macromolecules, Data (2nd ed.; Boca Raton, FL: CRC Press)
ed. A. Kleinzeller, G. F. Springer, & H. G. Wittmann (Berlin: Springer), 47, Zolotov, M. Y., & Kargel, J. S. 2009, in Europa, ed. R. T. Pappalardo,
doi:10.1007/978-3-642-87713-1_4 W. B. McKinnon, & K. K. Khurana (Tucson, AZ: Univ. Arizona Press), 431
17You can also read