Spectroscopic Estimation of N Concentration in Wheat Organs for Assessing N Remobilization Under Different Irrigation Regimes - Frontiers
←
→
Page content transcription
If your browser does not render page correctly, please read the page content below
ORIGINAL RESEARCH
                                                                                                                                               published: 09 April 2021
                                                                                                                                        doi: 10.3389/fpls.2021.657578

                                             Spectroscopic Estimation of N
                                             Concentration in Wheat Organs for
                                             Assessing N Remobilization Under
                                             Different Irrigation Regimes
                           Edited by:
                                             Wei Li 1† , Xiaonan Zhou 1† , Kang Yu 1* ‡ , Zhen Zhang 1 , Yang Liu 1 , Naiyue Hu 1 , Ying Liu 1 ,
            Shawn Carlisle Kefauver,
                                             Chunsheng Yao 1 , Xiaoguang Yang 2 , Zhimin Wang 1,3* and Yinghua Zhang 1,3*
       University of Barcelona, Spainf
                                             1
                           Reviewed by:        College of Agronomy and Biotechnology, China Agricultural University, Beijing, China, 2 College of Resources
    Salah Elsayed Mohamed Elsayed,           and Environmental Sciences, China Agricultural University, Beijing, China, 3 Engineering Technology Research Center
        University of Sadat City, Egypt      for Agriculture in Low Plain Areas, Cangzhou, China
                       Anne Marmagne,
  Institut National de Recherche pour
          l’Agriculture, l’Alimentation et   Nitrogen (N) remobilization is a critical process that provides substantial N to winter
     l’Environnement (INRAE), France         wheat grains for improving yield productivity. Here, the remobilization of N from
                     Omar Vergara-Diaz,
                                             anthesis to maturity in two wheat cultivars under three irrigation regimes was measured
         University of Barcelona, Spain
                                             and its relationship to organ N concentration was examined. Based on spectral
                   *Correspondence:
                              Kang Yu        data of organ powder samples, partial least squares regression (PLSR) models were
                   kangyu@cau.edu.cn         calibrated to estimate N concentration (Nmass ) and validated against laboratory-based
                          Zhimin Wang
                 zmwangcau@126.com           measurements. Although spectral reflectance could accurately estimate Nmass , the
                        Yinghua Zhang        PLSR-based Nmass -spectra predictive model was found to be organ-specific, organs
                  yhzhang@cau.edu.cn
                                             at the top canopy (chaff and top three leaves) received the best predictions (R2 > 0.88).
     † These   authors have contributed
                    equally to this work
                                             In addition, N remobilization efficiency (NRE) in the top two leaves and top third internode
                    ‡ Presentaddress:
                                             was highly correlated with its corresponding N concentration change (1Nmass ) with an
                             Kang Yu,        R2 of 0.90. 1Nmass of the top first internode (TIN1) explained 78% variation of the whole-
    School of Life Sciences, Technical
                                             plant NRE. This study provides a proof of concept for estimating N concentration and
       University of Munich, Freising,
                             Germany         assessing N remobilization using hyperspectral data of individual organs, which offers
                                             a non-chemical and low-cost approach to screen germplasms for an optimal NRE in
                   Specialty section:
                                             drought-resistance breeding.
         This article was submitted to
 Technical Advances in Plant Science,        Keywords: hyperspectral, N concentration, PLSR, plant organ reflectance, winter wheat, N remobilization
               a section of the journal      efficiency
            Frontiers in Plant Science
         Received: 23 January 2021
          Accepted: 15 March 2021            INTRODUCTION
           Published: 09 April 2021
                                Citation:    Wheat is one of the three major cereal crops providing over 700 million tons of grain worldwide
          Li W, Zhou X, Yu K, Zhang Z,       per annual (FAO, 2019). The high yield potential and grain quality in wheat are dependent on the
     Liu Y, Hu N, Liu Y, Yao C, Yang X,      uptake and utilization of nutrients, from which nitrogen (N) is a key composition of chlorophyll
          Wang Z and Zhang Y (2021)          maintaining photosynthesis assimilates that determines the grain yield ultimately. N also composes
        Spectroscopic Estimation of N
                                             the gluten protein which is used for improving the viscoelastic properties of food products
       Concentration in Wheat Organs
for Assessing N Remobilization Under
                                             (Shewry, 2009). Previous studies have demonstrated that around 60–90% of N in grains at maturity
           Different Irrigation Regimes.     (Barbottin et al., 2005; White et al., 2016) is remobilized from vegetative organs in cereal crops. In
          Front. Plant Sci. 12:657578.       wheat, this proportion could be as high as 95% (Kichey et al., 2007). Post-anthesis N remobilization
       doi: 10.3389/fpls.2021.657578         efficiency (NRE) is taken as an essential criterion for evaluating N recycling (Have et al., 2017). In

Frontiers in Plant Science | www.frontiersin.org                                    1                                            April 2021 | Volume 12 | Article 657578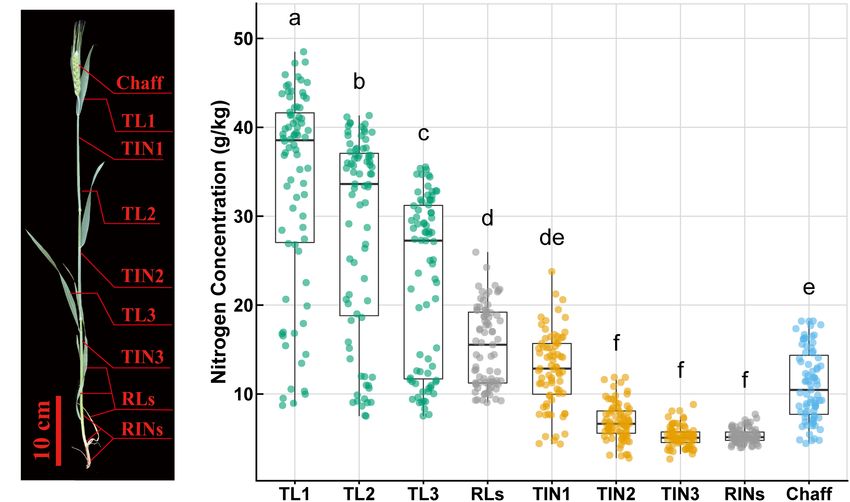
Li et al.                                                                                                  Spectroscopic Estimation of N Remobilization

addition to the genetic variation (Gaju et al., 2014), NRE varies            the N variations simultaneously in morphologically distinct
between wheat organs, where leaves have higher NRE than stems                organs and the feasibility of such an approach in evaluating the
and chaff (Pask et al., 2012). Besides, water deficit has been found         reallocation of N between organ tissues are rarely investigated
to affect the N remobilization (Xu et al., 2006), and can result             (Vilmus et al., 2014).
in an improved NRE in wheat (Bahrani et al., 2011). It has also                  As an alternative to NIRS, hyperspectral imaging (HSI) has
been reported in rice that moderate soil drying is beneficial to             several advantages to obtain spectral reflectance and analyze
improve NRE without sacrifice yield potential (Wang et al., 2016),           chemical properties (Caporaso et al., 2018a; Meacham-Hensold
while in most cases, water deficit or less irrigation is found to lead       et al., 2020). HSI holds three-dimensional data that involves not
to lower productivity (Sun et al., 2006). Hence, balancing grain             only spectral data but also spatial information of the samples
yield loss and N remobilization improvement is an eternal topic              from the captured images (Gao and Smith, 2015; Fu et al.,
of sustainable agriculture.                                                  2020), which makes it possible to investigate the variability of
    N content varies significantly in different growth stages,               samples with texture differences. Hyperspectral images could be
especially after anthesis when N remobilizes from vegetative                 rapidly acquired with an HSI system under the controlled light
organs (including leaves, stems, and sheaths) to grains during               condition as well as outdoor platforms with sunlight calibration
the process of plant senescence and grain development in cereal              in the field (Caporaso et al., 2018b; Malmir et al., 2019; Fu et al.,
crops (Bidinger et al., 1977; Yang and Zhang, 2006). Thus,                   2020; Meacham-Hensold et al., 2020). Thanks to the flexibility of
optimizing NRE is critical to improve grain yield and N use                  imaging a variety of samples, HSI enables rapid and repeatable
efficiency. Typically, NRE is determined by N remobilization                 measurements of N traits on the individual organs of the same
amount (NRA) in vegetative organs at anthesis and maturity                   plants, which brings new opportunities to study the variations
(Gaju et al., 2014), while the estimation of NRE involves two                and dynamics of plant-organ N traits and gain insights into the
key steps, dry mass (DM) and N concentration determination.                  response of plant N reallocation to drought stress (Bertheloot
The Kjedahl method is a traditional wet-chemical approach for                et al., 2008; Hawkesford, 2017).
measuring N concentration in plant tissues (Bertheloot et al.,                   Therefore, this study intended to investigate the feasibility
2008). Alternatively, the combustion-based approach such as the              of using HSI-based spectroscopy to predict N variations in
Dumas method can also measure N concentration accurately                     organs and to further evaluate the post-anthesis N remobilization
(Simonne et al., 1994). However, these methods are usually labor-            in wheat organs under different irrigation regimes. For this
intensive and may cause environmental contamination (Galvez-                 aim, our main objectives were (1) to compare NRE between
Sola et al., 2015). Among others, the complex procedures of these            organs under different irrigation regimes, (2) to develop organ-
laboratory-based N concentration determination methods are the               specific N concentration prediction models using spectral
major limiting factors of determining NRE in a large number of               reflectance, and (3) to evaluate N remobilization through N
samples. Therefore, efficient evaluation of NRE requires a rapid             concentration change.
and environmental-friendly method.
    Near-infrared spectroscopy (NIRS) is considered as a “green”
analytical tool for determining N concentration (Galvez-Sola                 MATERIALS AND METHODS
et al., 2015; Gredilla et al., 2016). In addition to NIRS, the
spectrum at the visible (VIS) region associated with chlorophylls            Field Treatments and Experimental
absorption can also reflect nitrogen variations (Asner and                   Design
Martin, 2008; Meacham-Hensold et al., 2020). Recently, spectral              Two winter wheat (Triticum aestivum L.) cultivars of Jimai22
reflectance acquired by hyperspectral sensor (VIS and NIRS)                  (JM22, high-yielding and cold-resistant cultivar) and Nongda399
instruments has been increasingly used for predicting N                      (ND399, fast-growing and drought-resistant cultivar) were
concentration in leaves (Ely et al., 2019; Meacham-Hensold                   planted at Wuqiao Experimental Station of China Agricultural
et al., 2020), shoots (Nguyen et al., 2019), grains (Caporaso                University, Cangzhou (37◦ 410 N, 116◦ 360 E), Hebei Province,
et al., 2018a), and the entire plants (Li et al., 2010; He J. et al.,        China, in 2018–2019 winter wheat growing season. Soil fertility
2020). By analyzing the full-spectrum data with chemometric                  (0–20 cm) and characteristics of climate in the experimental
modeling techniques such as partial least square regression                  filed are shown in Supplementary Table 1 and Supplementary
(PLSR), nutrient elements (e.g., N and micronutrients) could be              Figure 1. During wheat growing season in this study, the
estimated from hyperspectral reflectance (Vigneau et al., 2011;              experimental site received a total 66.6 mm precipitation,
Serbin et al., 2012). The capability of estimating N concentration           3843 MJ/m2 solar radiation, 2021 sunshine hours, a daily average
from spectroscopy has been verified to be robust in many                     air temperature of 10.2◦ C, and a cumulative temperature above
previous studies, such as the NIRS (e.g., 830–2600 nm) for                   0◦ C of 2977 degree-days (◦ C·d). Fertilizers were applied before
citrus leaf N (Galvez-Sola et al., 2015), the VIS-near-infrared              sowing with a total of 240 kg N ha−1 , 140 kg P2 O5 ha−1 ,
(VIS-NIR, 400–1000 nm) spectroscopic analysis for cacao tree                 and 120 kg K2 O ha−1 , which were broadcast incorporated into
leaf N (Malmir et al., 2019), and the hyperspectral (VIS-NIR-                the 20 cm surface layer of soil just before rotary tillage. Soil
SWIR, 350–2500 nm) determination for leaf N in various crop                  water content of 0–200 cm was determined and irrigated to 85%
species. Despite its success in evaluating N status at leaf or               field capacity before sowing (Sun et al., 2019). After sowing,
canopy levels (Yu et al., 2013; Ely et al., 2019; Hasituya et al.,           irrigations were applied at two critical crop developmental stages:
2020), the capability of using plant spectroscopy to characterize            upstanding (Z30) and anthesis (Z61), which are determined by

Frontiers in Plant Science | www.frontiersin.org                         2                                       April 2021 | Volume 12 | Article 657578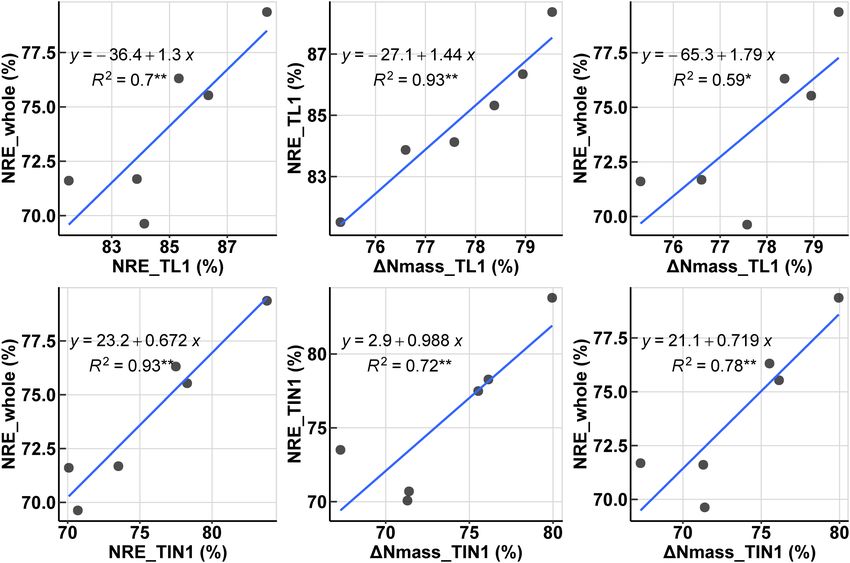
Li et al.                                                                                                                      Spectroscopic Estimation of N Remobilization

using the Zadoks scale (Zadoks et al., 1974). Three irrigation                            component at anthesis which is not present in the vegetative parts
regimes were as follows: W0, no irrigation after sowing; W1,                              at maturity (Gaju et al., 2014):
irrigation (75 mm) at upstanding; and W2 (75 mm × 2),
irrigation at stages of upstanding and anthesis. Each treatment                                      NAA (kg N ha−1 ) = Nmass × DM                                         (1)
includes three replicates, with nine experimental plots in total.                                    NRA (kg N ha       −1
                                                                                                                             ) = NAAAnthesis − NAAMaturity                 (2)
The plot size was 10 m × 5 m, allowing for growing 30
rows of winter wheat at a row spacing of 0.15 m, with 30,000                                                            NRA
                                                                                                     NRE (%) =                                                             (3)
seeds sown per plot.                                                                                                  NAAAnthesis

                                                                                          Where NRE is the N remobilization efficiency and NRA is the
Samples Collection                                                                        amount of N remobilized (kg N ha−1 ). NAAAnthesis is the amount
The above-ground part of wheat plants from two 1 m inner
                                                                                          of N (kg N ha−1 ) in vegetative organs at anthesis, and NAAMaturity
rows was sampled every 5 days from flowering time (anthesis,
                                                                                          is the amount of N reserved in the plant at maturity. In Eq. 1,
Z31) until maturity. After field sampling, the plants were then
                                                                                          Nmass represents N mass per unit DM (g N kg−1 ), and DM
separated into leaves, internodes (including sheaths), and chaff
                                                                                          represents dry mass (kg·ha−1 ), which was determined by the dry
(spike without grain). After separated into nine parts, these
                                                                                          weight of each sample.
samples were dried at 105◦ C for half an hour and then at
                                                                                              The N concentration change (1N mass ) between anthesis and
70◦ C until constant weight, and the DM was determined. As
                                                                                          maturity was calculated as follows:
Figure 1A shows, leaf organs include TL1 (top first leaf or flag
leaf laminae), TL2 (top second leaf), TL3 (top third leaf), and                                                               NAnthesis − NMaturity
RLs (remaining leaves), and internode organs include TIN1 (top                                                1N mass =                                                    (4)
                                                                                                                                    NAnthesis
first internode or peduncle, including leaf sheath), TIN2 (top
second internode), TIN3 (top third internode), RINs (remaining                            Where N Anthesis and N Maturity represent N mass of samples at
internodes), and chaff (including glume, palea, lemma, rachis,                            anthesis and maturity, respectively.
and awn) (Barraclough et al., 2014).                                                         The 1N mass , N accumulation, and corresponding NRE of
                                                                                          each organ were calculated separately. While the whole plant N
Measurements of N-Related Traits                                                          accumulation is calculated as the sum of all separated organs’
The N concentration (N mass ), denoted as N mass per unit DM,                             accumulated N, the whole-plant NRE was then determined.
was determined by using an automatic azotometer (Kjeltec 8400;
Foss, Denmark) according to the Kjeldahl method (Horneck and                              Spectral Reflectance Acquisition
Miller, 1998) following the manufacturer’s instructions. Post-                            A pipeline was developed to acquire spectral reflectance from a
anthesis NRE was calculated as the proportion of N in the crop                            hyperspectral imager (Supplementary Figure 2). After collecting

  FIGURE 1 | Schematic of wheat plant organs (A) and nitrogen concentration (Nmass ) variation (B) within and among these organs. The different lowercase letters
  above the boxplot show significant different mean value (p < 0.05). TL1, top first leaf; TL2, top second leaf; TL3, top third leaf; RLs, remaining leaves; TIN1, top first
  internode; TIN2, top second internode; TIN3, top third internode; RINs, remaining internodes.

Frontiers in Plant Science | www.frontiersin.org                                      3                                               April 2021 | Volume 12 | Article 657578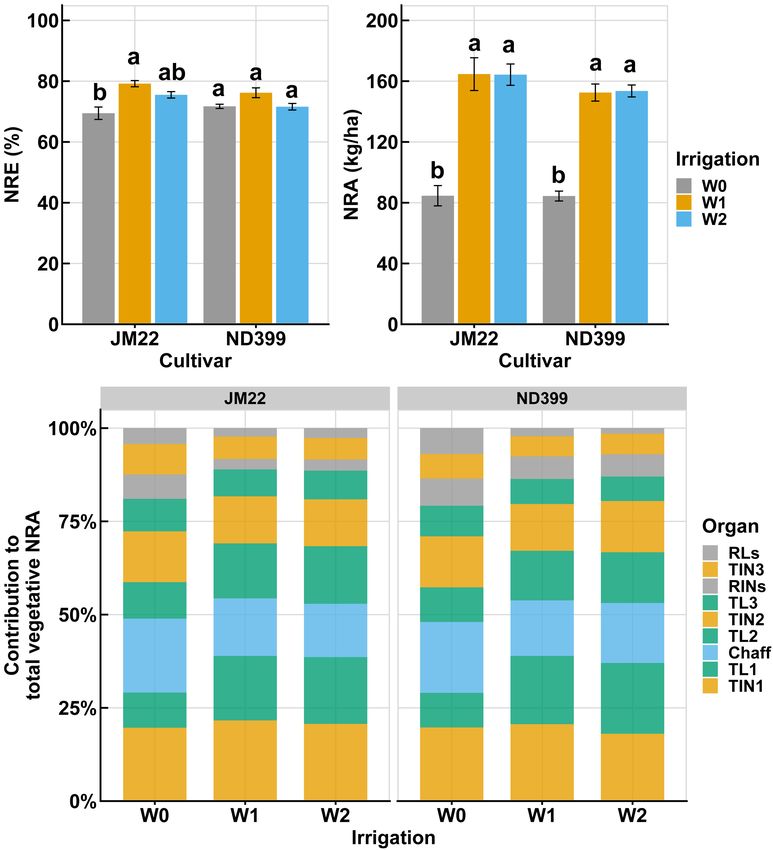
Li et al.                                                                                                Spectroscopic Estimation of N Remobilization

plants from the field, separated wheat organ samples were dried             RESULTS
and grounded to fine powders. Then these powder samples
(around 3–5 g, ∼1 cm depth for each) were placed on a plate                 N Concentration and Spectral
and photographed in a hyperspectral image acquisition system
                                                                            Reflectance of the Nine Wheat Organs
(Pan et al., 2019). The images were collected by an SCO710-
VP hyperspectral imager (SOC, San Diego, CA, United States)                 Powder
covering the VIS and NIR spectra between 375 and 1050 nm                    Chemical analysis in the laboratory showed that N concentration
at 5 nm increments for a total of 128 bands. Raw images were                (N mass ) varied within and among different organs across all
calibrated by the gray reference panel with known reflectance.              sampling time points (Figure 1B). N mass ranged from 2.68 to
Spectral reflectance of each sample was acquired following the              48.5 g/kg, showing a maximum difference of 45.82 g/kg (18-
procedures described in our previous work (Hu et al., 2020),                fold difference). As for different organs, the flag leaf or top
by using Spectral Radiance Analysis Software (Surface Optics                first leaf (TL1) showed a larger range (8.72–48.5 g/kg) and a
Corporation, United States).                                                significantly higher N mass than the other organs. N mass was
                                                                            observed with significant difference between leaf organs, while
                                                                            within internodes only TIN1 was significantly higher than the
PLSR Predictive Model to Estimate                                           other internodes. Leaves showed a higher average value and wider
Nmass From Spectra                                                          range than internodes and chaff. Besides, in leaves or internodes,
Partial least squares regression (PLSR), which was proved to be an          N mass showed a vertical distribution pattern, where the top ones
effective technique for building predictive models with spectral            had a higher average value and wider range than the basal ones.
data (Serbin et al., 2012; Ely et al., 2019), was applied to develop            The spectral reflectance varied substantially within and among
N mass spectra relationships. The predictive N mass spectra model           these organs’ powder (Figure 2A and Supplementary Figure 3).
was built based on all the raw wavelength spectra for individual            Across all wavelengths, an obvious peak was observed in the VIS
organs and across organs and cultivars. PLSR model was                      region, while a large continuous variation in reflectance from 780
employed to predict N mass from reflectance data with the “pls”             to 950 nm was detected in the NIR. Among organs, the highest
package (Mevik et al., 2011) under the R software environment.              reflectance was found for the chaff and top second internodes
During the procedure of model training and parameter fitting,               (TIN2), respectively, in the VIS and NIR regions. In contrast, the
10 times repeated five-fold cross-validation method (Ali et al.,            lowest was found for the flag leaves (TL1) in the VIS, as well as
2017; Malmir et al., 2019) was conducted in the “caret” package             for the RLs in the NIR. The RINs had higher reflectance in the red
(Kuhn, 2015; Heckmann et al., 2017). The optimal number of                  (620–650 nm) and red-edge regions than other organs. It is worth
latent variables (also called model components) was determined              noting that, in the green (505–570 nm) region, the young or green
based on the minimum predicted residual error sum of square                 organs showed an obvious peak, while the aging organs (RLs and
(PRESS) statistic of the training model. Models were built on 75%           RINs) did not (Supplementary Figure 3). In order to understand
of randomly selected experimental data for calibration and were             the diversity and general properties of all samples’ spectral
used to predict the remaining (validation dataset of) 25%. A 10             reflectance, principal component analysis (PCA) was applied
times fivefold cross-validation was used to train the model. The            and results showed that the first three principal components
accuracy of each model was evaluated based on the coefficients              explained 98% of the variance in this set of raw spectra. PCA plots
of determination (R2 ) and root mean square of error (RMSE)                 from spectral reflectance showed that organs could be divided
for predicted versus measured N in calibration and validation               into two subgroups, leaf and non-leaf organs, as indicated by the
dataset. Bias was determined by the difference between the                  vertical dashed line in the figure (Figure 2B). This is consistent
observed mean values and the predicted mean values for the                  with the spectra variation in the VIS region, where the four leaf
validation dataset samples. Regression bias was calculated from             organs had lower reflectance than the non-leaf organs.
the regression intercept. Variable importance of projection (VIP)
values (Wold, 1995) of each PLSR model was evaluated to assess              N Concentration Prediction From
the relative contributions of different wavelengths over the full           Spectral Reflectance at Organ Level
spectrum (Yendrek et al., 2017). VIP scores were used to identify           The N mass prediction model was built with full range wavelength
the relative significant reflectance spectrum for each organ N mass -       spectra for individual organs and across organs (mixed organs
spectra model. In addition, wavelengths of high VIP values (>0.8)           together). Except for the RINs, all organ-specific models were
were selected to recalibrate the N mass -spectra model and compare          able to predict N mass (Figure 3 and Table 1). For the calibration,
to the all-wavelength model.                                                R2 values ranged from 0.47 to 0.97 with the calibration RMSEs
                                                                            varying from 0.67 to 2.80 g/kg. Surprisingly, the validation
Statistical Analysis                                                        accuracy was found to be comparable to the calibration with R2
The actual N mass of different time points was pooled together for          values ranged from 0.26 to 0.95 g/kg. The best organ-specific
all statistical analysis. Tukey HSD test was performed to compare           models were found for TL1, TL2, TL3, chaff, and across organs
differences between multiple groups. Linear regression analysis             (R2 > 0.88, Table 1). The moderate prediction models were
was conducted to study the relationship between whole-plant                 found for RLs (R2 = 0.69, RMSE = 3.00 g/kg), TIN1 (R2 = 0.77,
NRE and organ NRE. The relationships between NRE (whole                     RMSE = 2.13 g/kg), TIN2 (R2 = 0.76, RMSE = 0.97 g/kg),
plant or separate organ) and 1N mass were also investigated.                and TIN3 (R2 = 0.69, RMSE = 0.71 g/kg) (Table 1). In

Frontiers in Plant Science | www.frontiersin.org                        4                                      April 2021 | Volume 12 | Article 657578
Li et al. Spectroscopic Estimation of N Remobilization
A B
1.2
10
1.0
Organ Organ
TL1 5 TL1
PC2 (23.5%)
0.8
Reflectance
TL2 TL2
TL3 TL3
RLs 0 RLs
0.6 TIN1 TIN1
TIN2 TIN2
TIN3 TIN3
0.4 RINs -5 RINs
Chaff Chaff
0.2 -10
0.0
400 500 600 700 800 900 1000 -20 -10 0 10 20
Wavelength [nm] PC1 (72.2%)
FIGURE 2 | Spectra diversity within and among wheat organs. (A) Mean spectral reflectance for each organ is shown. (B) PCA plots from spectral reflectance
categorized by organ group. In PCA plots, the first two PC which explained 95.7% variation, different colors and shapes correspond to each organ category, data
points of individual are represented by transparent color points, and confidence ellipse and mean point of each group are shown by solid colors.
contrast, the model failed to predict N mass in RINs (R2 = 0.26, chaff (Table 2). For organs of TL1, TL2, and TIN3, the organ-
RMSE = 0.66 g/kg). When using the selected wavelengths specific NRE shared high collinearity with 1N mass , and the
to model the calibration, it did not perform better than all best correlation was observed for TIN3, with an R2 of 0.97.
wavelengths model (Supplementary Table 4). Furthermore, organ-specific NRE of TL1 and TIN1 could explain
70 and 93% variation of the whole-plant NRE at significant level
(P < 0.05) (Figure 5), while organ-specific NRE of RLs and
N Remobilization Varies Between RINs could hardly explain any variation of whole-plant NRE.
Irrigation Regimes In addition, the observed 1N mass of TIN1 could explain 78%
During the anthesis and early grain developmental stages variation of whole-plant NRE. Based on these results, it was
of winter wheat growing season, wheat experienced a non- decided to use organ-specific N concentration (e.g., TIN1) at
precipitation period of 38 continuous days (Supplementary anthesis and maturity to evaluate post-anthesis N remobilization.
Figure 1b). Only a few rainfall days were recorded in the
vegetative growth stages. The applied irrigation at these two
critical growth stages resulted in a large difference between DISCUSSION
treatments. NRE of the two cultivars, JM22 and ND399, showed
a small variation and shared a similar trend. Results showed NRE Assessment Through Spectral
that a low amount of irrigation (W0/W1) did not reduce NRE, Reflectance Estimated Nmass
compared to the higher irrigation (Figure 4A). NRA did not Winter wheat production has been improved with high-input
differ between W1 and W2, while they were much higher than cropping systems over the past decades, so does the adaptive
W0, with a nearly doubled NRA value of W0 (Figure 4B). capacity of cultivars to less optimal water availability conditions
Figure 4C shows the contribution of nine organs to total (Voss-Fels et al., 2019). However, our understanding on the
NRA under three irrigation treatments. It is worth noting that NRE adaptivity to drought is still limited due to the lack of
NRA contribution from the main leaves (e.g., TL1 and TL2) efficient, repeatable approaches for evaluating the NRE. In this
decreased under W0 treatment when compared with W1 and W2 study, NRE variations under contrast irrigation regimes were
(Figure 4C). On the contrary, NRA contribution in RLs, RINs, evaluated by using hyperspectral-based N measures. Results
and chaff showed increases under W0 treatment. In other organs, revealed that under low precipitation, mild/moderate irrigation
however, irrigation did not yield changes in NRA. Among these (W1) improved NRE a bit compared to the higher irrigation
organs, the first two internodes, the first two leaves, and chaff are (W2), while whether W0 leads to a low NRE was dependent
the major contribution organs, which contribute up to 80% to the on the cultivar (Figure 4A). These results suggest that limited
total NRA (Figure 4C). irrigation, which is beneficial to save water resources (Yang and
Zhang, 2006; Li et al., 2019), is a cost-efficient approach for
improving N use efficiency. On the other hand, grain yield was
Relationships Between N generally found to be decreased when mild irrigation was applied
Remobilization-Related Traits (Zaveri and Lobell, 2019), which is consist with our results that
The organ-specific NRE was all significantly correlated with low yield was received from low irrigations (Supplementary
its corresponding post-anthesis 1N mass, for all organs except Table 2). Balancing the grain yield and NRE improvement
Frontiers in Plant Science | www.frontiersin.org 5 April 2021 | Volume 12 | Article 657578Li et al. Spectroscopic Estimation of N Remobilization
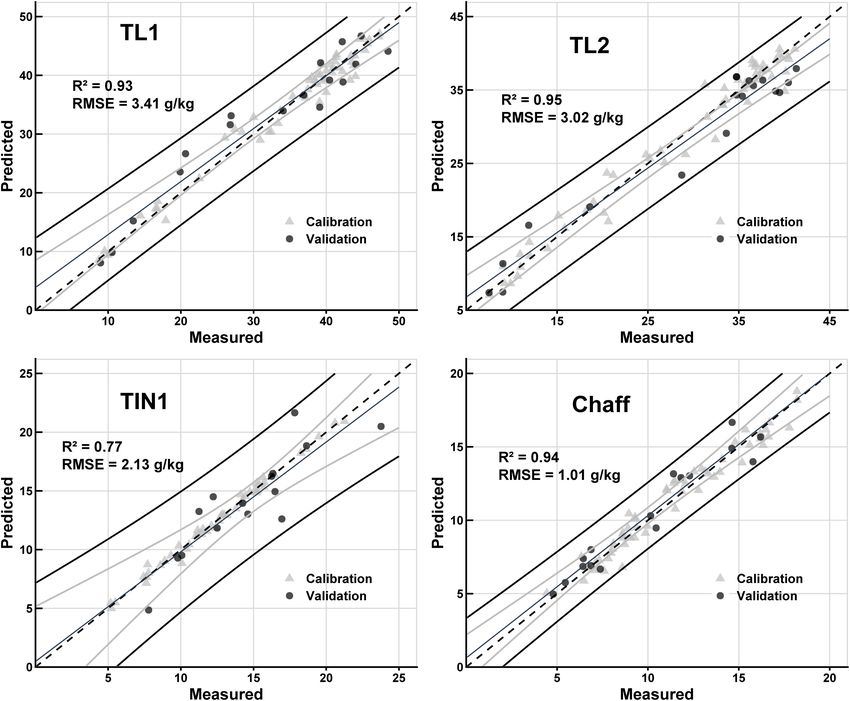
FIGURE 3 | Results of PLSR predictive models for nitrogen concentration (Nmass ). Comparison between measured Nmass and predicted Nmass for organs of TL1,
TL2, TIN1, and Chaff. In the figures, calibration (gray triangle) and validation (solid circle) data points are illustrated. The dashed line shows 1:1 line, the fine black line
shows regression line, the black lines show 95% prediction interval, and gray lines show 95% confidence interval of the validation dataset. Statistic parameters (R2
and RMSE) for the validation datasets are shown in the plots.
TABLE 1 | Statistics of PLSR models for Nmass of each organ and across organs.
Dataset Modelcomponents Calibration Validation
n R2 RMSE (g/kg) n R2 RMSE (g/kg) RPD Bias (g/kg) Regression bias (g/kg)
TL1 8 17 0.93 2.25 57 0.93 3.41 3.78 −0.76 3.86
TL2 10 18 0.96 2.48 57 0.95 3.02 4.01 1.15 2.38
TL3 3 17 0.94 2.80 55 0.94 2.51 4.11 −0.51 1.67
RLs 3 18 0.67 2.63 59 0.69 3.00 1.60 1.29 5.79
Organ TIN1 19 15 0.89 1.35 49 0.77 2.13 1.94 0.48 0.47
TIN2 13 14 0.78 0.87 49 0.76 0.97 2.02 0.25 1.87
TIN3 12 15 0.68 0.67 52 0.69 0.71 1.67 −0.17 0.84
RINs 12 15 0.47 0.71 55 0.26 0.66 0.94 0.27 2.34
Chaff 10 16 0.95 0.92 55 0.94 1.01 3.82 −0.32 0.62
Across organs 43 159 0.95 2.79 474 0.95 2.80 4.36 0.05 0.14
Models were built on 75% of experimental data for calibration and used to predict the remaining (validation dataset of) 25%. Model Components is the number of
components used in the predictive partial least square regression (PLSR) model. n is the number of samples used for modeling. RPD is the ratio of prediction to deviation.
Bias is the difference between the mean observe value and the mean predicted value for the validation dataset samples. Regression bias is the regression intercept.
Frontiers in Plant Science | www.frontiersin.org 6 April 2021 | Volume 12 | Article 657578Li et al. Spectroscopic Estimation of N Remobilization FIGURE 4 | Nitrogen remobilization varies between three irrigation treatments. (A,B) Nitrogen remobilization efficiency (NRE) and nitrogen remobilization amount (NRA) of vegetative organs in winter wheat cultivar JM22 and ND399. Irrigation treatments are shown with three different colors. (C) Contribution of separated organs to total NRA. when applying water-saving management is always a trade-off. measurement is a time-consuming and costly process which Although several studies reported that drying condition could involves measurement of N mass and dry matter simultaneously benefit grain yield and nutrient use efficiency simultaneously at the two critical stages (anthesis and maturity). Additionally, (Wang et al., 2016; He G. et al., 2020), it is still challenging to the whole-plant NRE could be estimated by acquiring spectral determine the extent to which the irrigation should be optimized data of TIN1 powder samples at anthesis and maturity, (Nguyen and Kant, 2018; Prey and Schmidhalter, 2019). suggesting a promising application in selecting N-efficient Our results not only confirmed the power of hyperspectral cultivars (Nguyen and Kant, 2018). For NRE correlations sensors in precisely estimating N concentration (Table 1) but among organs, considering post NRE was determined by the also demonstrated the potential of assessing NRE variations contribution of organs. However, cultivars and environmental through spectral reflectance (Table 2 and Figure 5). By variations may have an influence on the relationships between predicting N concentration, N concentration change (1N mass ) NRE and 1N mass , and also affect the use of specific organ between the anthesis and post-anthesis (Barbottin et al., 2005; data in assessing the whole-plant NRE. Further investigations Kong et al., 2016) was able to be further estimated. The are needed to improve the understanding of correlations observed correlation between the actually measured NRE between NRE and 1N mass . Our study only provides a and 1N mass (Table 2) suggested the possibility of evaluating proof of concept for evaluating N remobilization under N remobilization directly through spectral measurements. controlled light conditions following simple sample preparations Our results have added to the growing evidence that plant (spectra acquired from organ powders). Nevertheless, it is still spectroscopy could facilitate the study of N remobilization challenging to perform organ-specific HSI measurements in in response to irrigation (or fertilization) management that the field. Future improvement of the proposed method should affects N remobilization, especially in terms of the timing and be investigated by measuring individual plants and organs duration at organ level (Nehe et al., 2020). Notably, NRE directly in the field. Frontiers in Plant Science | www.frontiersin.org 7 April 2021 | Volume 12 | Article 657578
Li et al.                                                                                                                  Spectroscopic Estimation of N Remobilization

TABLE 2 | The coefficients of determination (R2 ) between whole plant and organ             reflectance, in which leaf and non-leaf organs are statistically
NRE, between organ NRE and organ 1Nmass , and between whole-plant NRE and                   different as tested by a permutational multivariate analysis
organ 1Nmass among wheat organs.
                                                                                            of variance (Anderson, 2017). These differences between leaf
                  NRE_whole                NRE_organ                   NRE_whole            and non-leaf destructive organs might be attributed to their
                  ∼ NRE_organ                 ∼ 1Nmass                 ∼ 1Nmass             divergent biochemical composition. PCA results suggest that,
                                                                                            even within the same type of organ (e.g., leaf and internode
Organ        R2         p-value          R2        p-value        R2        p-value         groups), large variations exist. Here, N concentrations of
TL1         0.7           0.039         0.93       0.0016        0.59         0.073
                                                                                            different vegetative organs were investigated and results suggest
TL2         0.44          0.15          0.79       0.017         0.08         0.58
                                                                                            considerable variations distributed vertically among these organs
TL3         0.08          0.59          0.93       0.0017          0          0.95
                                                                                            (Figure 1B). These findings are similar to previous N partitioning
RLs           0           0.96          0.68       0.044         0.01         0.83
                                                                                            research in wheat (Barraclough et al., 2014; Gaju et al., 2014).
TIN1        0.93          0.002         0.72       0.034         0.78         0.02
                                                                                            Collectively, our results confirmed the usefulness of considering
TIN2        0.52          0.11          0.84       0.0104        0.64         0.058
                                                                                            organ-specific models.
TIN3        0.67          0.046         0.97       0.0004        0.66         0.051
                                                                                                In this study, similarly high predictive power (R2 ∼ 0.90)
RINs        0.02          0.79          0.78       0.019         0.04         0.71
                                                                                            (Table 1) was achieved for leaf organs compared to previous
Chaff       0.5           0.12          0.51       0.11          0.05         0.69
                                                                                            N mass estimations at leaf level (Serbin et al., 2012; Yendrek et al.,
                                                                                            2017; Coast et al., 2019; Ely et al., 2019). Surprisingly, prediction
The values in bold indicate coefficients with better performance at significant level
                                                                                            for the chaff organ was comparable (R2 = 0.94) to the top leaf
(p < 0.05).
                                                                                            organs, which might be related to the specific role of chaff in
                                                                                            maintaining a high N accumulation by acting as a temporary
Organ-Level Predictive Models                                                               sink and source for N (Kong et al., 2016). Also, senescent
Predictive models calibrated across organs did not always succeed                           leaves and internodes achieved relatively low predictive power
in predicting individual organs (data not shown). Similar results                           (Table 1), which was similar to vertical canopy N predictions
were also reported in models using leaf spectral reflectance in                             in rice (He J. et al., 2020). Small variations in spectra and N
diverse species (Heckmann et al., 2017; Yendrek et al., 2017).                              concentration may account for the low prediction power in
This difference was validated by performing PCA for the spectral                            these senescence organs. The relatively low N concentration

  FIGURE 5 | Relationships of N remobilization-related traits. (A,D) Relationships between NRE of separated organs and the whole plant. (B,E) Relationships between
  nitrogen concentration change (1Nmass ) and organ NRE. (C,F) Relationships between organ 1Nmass and whole-plant NRE. (A–C) are for TL1 and (D–F) are for TIN1.

Frontiers in Plant Science | www.frontiersin.org                                        8                                        April 2021 | Volume 12 | Article 657578
Li et al. Spectroscopic Estimation of N Remobilization
might reduce the possibility of being detected by spectra, which varied among irrigation regimes after sowing, where the mild
is confirmed by a low coefficient of variation (CV) observed irrigation (W1) achieved the best NRE, but the NRE reduced
in the lower prediction models (Supplementary Table 5). In if no irrigation was applied. NRE in individual organs was
this situation, VIP values at some dominating wavelength correlated highly with the whole-plant NRE. Spectra-based
were decreased (Supplementary Figure 4), resulting in a low models successfully predicted the N concentration in each organ.
contribution to the prediction (Yendrek et al., 2017). Regarding The N concentration change in a single organ (e.g., TIN1)
to the effect of organ on wavelength sore, one possible reason between anthesis and maturity could explain 78% of the variation
might be attributed from the biochemical composition between in the whole plant NRE. This study demonstrates the use of
organs which more chlorophylls content is reserved in leaf HSI in estimating N concentration and to aid the assessment of
or young organs dominating the reflection of N variations NRE variations from the organ to whole-plant levels, which holds
(Meacham-Hensold et al., 2020). For a robust PLSR model for great promise for guiding precision irrigation and N management
predicting N in these organs having small variations, it might for optimized NRE.
be possible by collecting a diverse range of N mass data across
more growth conditions and developmental stages or diverse
genetic resources. DATA AVAILABILITY STATEMENT
Hyperspectral Imaging as a Rapid and The original contributions presented in the study are included
Cost-Effective Approach to Acquire in the article/Supplementary Material. Further inquiries can be
Spectral Reflectance directed to the corresponding author/s.
This study used HSI to acquire reflectance data for estimating
N concentration and assessing NRE variations of dried samples.
As a spectroscopic technology, the biggest advantage is that the AUTHOR CONTRIBUTIONS
method is cost-efficient and environmentally friendly (Gredilla
et al., 2016), and thus is suitable for repeated use. Due to WL, XZ, ZW, and YZ conceived and designed the experiments.
its flexibility and convenience, spectral reflectance for a large WL, XZ, ZZ, YaL, and NH performed the experiments. WL, XZ,
number of samples was able to be acquired. For example, in YiL, CY, and XY analyzed the data. WL, XZ, KY, and YZ wrote the
our experiment, 18 samples were photographed (Supplementary manuscript. All authors read and approved the final manuscript.
Figure 2) in one image, making it possible for us to acquire
more than 1000 samples within 10 h. To reduce the spatial
complexity of analyzing the spectra while still taking the FUNDING
advantage of image data, regions of interest are typically selected
to acquire average spectra (Malmir et al., 2019). Despite the This work was supported by the National Key Research and
benefits of HSI, this study only focused on the uses of organ Development Program of China (Grant Nos. 2016YFD0300401,
powder samples and the average spectra of each sample, without 2016YFD0300105, and 2017YFD0201705), the National Natural
discriminating spatial variations in each organ. The simplified Science Foundation of China (31871563), the Modern Agro-
approach for evaluating the whole-plant NRE through organ Industry Technology Research System (CARS-3), and the CAU
part (TIN1) spectra will facilitate balancing the irrigation and Basic Scientific Research Fund (2020RC037).
N management and screening high NRE cultivars. In our study,
NRE of JM22 is superior to that in ND399 under sufficient
water treatments (Supplementary Figure 5, W1 and W2).
ACKNOWLEDGMENTS
Hence, it is possible to screen high NRE cultivars under specific
irrigation conditions. This study provides a proof of concept We appreciate the generous help from Li Yang and Tianliang
for evaluating N remobilization of wheat organs and whole Zhang for providing the hyperspectral imager and training to us.
plant through hyperspectral reflectance data. It is anticipated We thank the staff of the Wuqiao Experimental Station of CAU
that HSI will be a promising tool for analyzing NRE spatial for their help in field management.
variation and its dynamics to uncover the underlying mechanism
of N remobilization.
SUPPLEMENTARY MATERIAL
CONCLUSION
The Supplementary Material for this article can be found
In this study, the N remobilization under three irrigation online at: https://www.frontiersin.org/articles/10.3389/fpls.2021.
regimes was investigated using HSI. Results showed that NRE 657578/full#supplementary-material
REFERENCES review. J. Plant Nutr. 40, 928–953. doi: 10.1080/01904167.2016.114
3954
Ali, M. M., Al-Ani, A., Eamus, D., and Tan, D. K. Y. (2017). Anderson, M. J. (2017). “Permutational multivariate analysis of variance
Leaf nitrogen determination using non-destructive techniques–a (PERMANOVA),” in Wiley StatsRef: Statistics Reference Online, eds N.
Frontiers in Plant Science | www.frontiersin.org 9 April 2021 | Volume 12 | Article 657578Li et al. Spectroscopic Estimation of N Remobilization Balakrishnan, T. Colton, B. Everitt, W. Piegorsch, F. Ruggeri, and J. L. Teugels He, J., Zhang, X., Guo, W., Pan, Y., Yao, X., Cheng, T., et al. (2020). Estimation of (Hoboken, NJ: John Wiley & Sons), 1–15. vertical leaf nitrogen distribution within a rice canopy based on hyperspectral Asner, G., and Martin, R. (2008). Spectral and chemical analysis of tropical forests: data. [Original Research]. Front. Plant Sci. 10:1802. doi: 10.3389/fpls.2019. scaling from leaf to canopy levels. Remote Sens. Environ. 112, 3958–3970. doi: 01802 10.1016/j.rse.2008.07.003 Heckmann, D., Schluter, U., and Weber, A. P. M. (2017). Machine learning Bahrani, A., Abad, H. H. S., and Aynehband, A. (2011). Nitrogen remobilization techniques for predicting crop photosynthetic capacity from leaf reflectance in wheat as influenced by nitrogen application and post-anthesis water deficit spectra. Mol. Plant 10, 878–890. doi: 10.1016/j.molp.2017.04.009 during grain filling. [Article]. Afr. J. Biotechnol. 10, 10585–10594. doi: 10.5897/ Horneck, D. A., and Miller, R. O. (1998). “Determination of total nitrogen in plant ajb11.013 tissue,” in Handbook of Reference Methods for Plant Analysis, Vol. 2, ed. Y. Kalra Barbottin, A., Lecomte, C., Bouchard, C., and Jeuffroy, M.-H. (2005). Nitrogen (Boca Raton, FL: CRC Press), 75–83. remobilization during grain filling in wheat: genotypic and environmental Hu, N., Li, W., Du, C., Zhang, Z., Gao, Y., Sun, Z., et al. (2020). Predicting effects. Crop Sci. 45, 1141–1150. doi: 10.2135/cropsci2003.0361 micronutrients of wheat using hyperspectral imaging. Food Chem. 343:128473. Barraclough, P. B., Lopez-Bellido, R., and Hawkesford, M. J. (2014). Genotypic doi: 10.1016/j.foodchem.2020.128473 variation in the uptake, partitioning and remobilisation of nitrogen during Kichey, T., Hirel, B., Heumez, E., Dubois, F., and Le Gouis, J. (2007). In winter grain-filling in wheat. Field Crops Res. 156, 242–248. doi: 10.1016/j.fcr.2013. wheat (Triticum aestivum L.), post-anthesis nitrogen uptake and remobilisation 10.004 to the grain correlates with agronomic traits and nitrogen physiological Bertheloot, J., Martre, P., and Andrieu, B. (2008). Dynamics of light and nitrogen markers. Field Crops Res. 102, 22–32. doi: 10.1016/j.fcr.2007.01.002 distribution during grain filling within wheat canopy. Plant Physiol. 148, 1707– Kong, L., Xie, Y., Hu, L., Feng, B., and Li, S. (2016). Remobilization of vegetative 1720. doi: 10.1104/pp.108.124156 nitrogen to developing grain in wheat (Triticum aestivum L.). Field Crops Res. Bidinger, F., Musgrave, R., and Fischer, R. (1977). Contribution of stored pre- 196, 134–144. doi: 10.1016/j.fcr.2016.06.015 anthesis assimilate to grain yield in wheat and barley. Nature 270, 431–433. Kuhn, M. (2015). Caret: Classification and Regression Training. Astrophysics Source Caporaso, N., Whitworth, M. B., and Fisk, I. D. (2018a). Near-infrared Code Library. spectroscopy and hyperspectral imaging for non-destructive quality assessment Li, F., Miao, Y., Hennig, S. D., Gnyp, M. L., Chen, X., Jia, L., et al. (2010). Evaluating of cereal grains. Appl. Spectr. Rev. 53, 667–687. doi: 10.1080/05704928.2018. hyperspectral vegetation indices for estimating nitrogen concentration of 1425214 winter wheat at different growth stages. Precis. Agric. 11, 335–357. Caporaso, N., Whitworth, M. B., and Fisk, I. D. (2018b). Protein content prediction Li, J., Wang, Y., Zhang, M., Liu, Y., Xu, X., Lin, G., et al. (2019). Optimized micro- in single wheat kernels using hyperspectral imaging. Food Chem. 240, 32–42. sprinkling irrigation scheduling improves grain yield by increasing the uptake doi: 10.1016/j.foodchem.2017.07.048 and utilization of water and nitrogen during grain filling in winter wheat. Agric. Coast, O., Shah, S., Ivakov, A., Gaju, O., Wilson, P. B., Posch, B. C., et al. (2019). Water Manag. 211, 59–69. doi: 10.1016/j.agwat.2018.09.047 Predicting dark respiration rates of wheat leaves from hyperspectral reflectance. Malmir, M., Tahmasbian, I., Xu, Z., Farrar, M. B., and Bai, S. H. (2019). Prediction Plant Cell Environ. 42, 2133–2150. doi: 10.1111/pce.13544 of macronutrients in plant leaves using chemometric analysis and wavelength Ely, K. S., Burnett, A. C., Lieberman-Cribbin, W., Serbin, S. P., and Rogers, A. selection. J. Soils Sediments 20, 249–259. doi: 10.1007/s11368-019-02418-z (2019). Spectroscopy can predict key leaf traits associated with source-sink Meacham-Hensold, K., Fu, P., Wu, J., Serbin, S., Montes, C. M., Ainsworth, E., et al. balance and carbon-nitrogen status. J. Exp. Bot. 70, 1789–1799. doi: 10.1093/ (2020). Plot-level rapid screening for photosynthetic parameters using proximal jxb/erz061 hyperspectral imaging. J. Exp. Bot. 71, 2312–2328. doi: 10.1093/jxb/eraa068 FAO (2019). Crop Prospects and Food Situation [Online]. Available online at: http: Mevik, B.-H., Wehrens, R., and Liland, K. H. (2011). Pls: Partial Least Squares and //www.fao.org/giews/reports/crop-prospects/en/ Principal Component Regression. R package version, 2. Fu, P., Meacham-Hensold, K., Guan, K., Wu, J., and Bernacchi, C. (2020). Nehe, A. S., Misra, S., Murchie, E. H., Chinnathambi, K., Singh Tyagi, B., and Estimating photosynthetic traits from reflectance spectra: a synthesis of spectral Foulkes, M. J. (2020). Nitrogen partitioning and remobilization in relation to indices, numerical inversion, and partial least square regression. Plant Cell leaf senescence, grain yield and protein concentration in Indian wheat cultivars. Environ. 43, 1241–1258. doi: 10.1111/pce.13718 Field Crops Res. 251:107778. doi: 10.1016/j.fcr.2020.107778 Gaju, O., Allard, V., Martre, P., Le Gouis, J., Moreau, D., Bogard, M., et al. (2014). Nguyen, G. N., and Kant, S. (2018). Improving nitrogen use efficiency in plants: Nitrogen partitioning and remobilization in relation to leaf senescence, grain effective phenotyping in conjunction with agronomic and genetic approaches. yield and grain nitrogen concentration in wheat cultivars. Field Crops Res. 155, Funct. Plant Biol. 45, 606–619. doi: 10.1071/FP17266 213–223. doi: 10.1016/j.fcr.2013.09.003 Nguyen, G. N., Maharjan, P., Maphosa, L., Vakani, J., Thoday-Kennedy, Galvez-Sola, L., Garcia-Sanchez, F., Perez-Perez, J. G., Gimeno, V., Navarro, J. M., E., and Kant, S. (2019). A robust automated image-based phenotyping Moral, R., et al. (2015). Rapid estimation of nutritional elements on citrus method for rapid vegetative screening of wheat germplasm for nitrogen use leaves by near infrared reflectance spectroscopy. Front. Plant Sci. 6:571. doi: efficiency. [Original Research]. Front. Plant Sci. 10:1372. doi: 10.3389/fpls.2019. 10.3389/fpls.2015.00571 01372 Gao, L., and Smith, R. T. (2015). Optical hyperspectral imaging in microscopy Pan, X., Sun, L., Li, Y., Che, W., Ji, Y., Li, J., et al. (2019). Non-destructive and spectroscopy - a review of data acquisition. J. Biophotonics 8, 441–456. classification of apple bruising time based on visible and near-infrared doi: 10.1002/jbio.201400051 hyperspectral imaging. J. Sci. Food Agric. 99, 1709–1718. doi: 10.1002/jsfa.9360 Gredilla, A., Fdez-Ortiz de Vallejuelo, S., Elejoste, N., de Diego, A., and Madariaga, Pask, A. J. D., Sylvester-Bradley, R., Jamieson, P. D., and Foulkes, M. J. (2012). J. M. (2016). Non-destructive spectroscopy combined with chemometrics as Quantifying how winter wheat crops accumulate and use nitrogen reserves a tool for green chemical analysis of environmental samples: a review. TRAC during growth. Field Crops Res. 126, 104–118. doi: 10.1016/j.fcr.2011.09.021 Trends Analyt. Chem. 76, 30–39. doi: 10.1016/j.trac.2015.11.011 Prey, L., and Schmidhalter, U. (2019). Temporal and spectral optimization of Hasituya, Li, F., Elsayed, S., Hu, Y., and Schmidhalter, U. (2020). Passive reflectance vegetation indices for estimating grain nitrogen uptake and late-seasonal sensing using optimized two- and three-band spectral indices for quantifying nitrogen traits in wheat. Sensors 19:4640. doi: 10.3390/s19214640 the total nitrogen yield of maize. Comput. Electron. Agric. 173:105403. doi: Serbin, S. P., Dillaway, D. N., Kruger, E. L., and Townsend, P. A. (2012). Leaf optical 10.1016/j.compag.2020.105403 properties reflect variation in photosynthetic metabolism and its sensitivity to Have, M., Marmagne, A., Chardon, F., and Masclaux-Daubresse, C. (2017). temperature. J. Exp. Bot. 63, 489–502. doi: 10.1093/jxb/err294 Nitrogen remobilization during leaf senescence: lessons from Arabidopsis to Shewry, P. R. (2009). Wheat. J Exp Bot 60, 1537–1553. doi: 10.1093/jxb/erp058 crops. J. Exp. Bot. 68, 2513–2529. doi: 10.1093/jxb/erw365 Simonne, E. H., Mills, H. A., Jones, J. B., Smittle, D. A., and Hussey, C. G. (1994). Hawkesford, M. J. (2017). Genetic variation in traits for nitrogen use efficiency in A comparison of analytical methods for nitrogen analysis in plant tissues. wheat. J. Exp. Bot. 68, 2627–2632. doi: 10.1093/jxb/erx079 Commun. Soil Sci. Plant Anal. 25, 943–954. He, G., Wang, Z., and Cui, Z. (2020). Managing irrigation water for sustainable rice Sun, H.-Y., Liu, C.-M., Zhang, X.-Y., Shen, Y.-J., and Zhang, Y.-Q. (2006). Effects production in China. J. Clean. Prod. 245:118928. doi: 10.1016/j.jclepro.2019. of irrigation on water balance, yield and WUE of winter wheat in the North 118928 China Plain. Agric. Water Manag. 85, 211–218. Frontiers in Plant Science | www.frontiersin.org 10 April 2021 | Volume 12 | Article 657578
Li et al.                                                                                                                            Spectroscopic Estimation of N Remobilization

Sun, Z., Zhang, Y., Zhang, Z., Gao, Y., Yang, Y., Han, M., et al. (2019). Significance         Yang, J., and Zhang, J. (2006). Grain filling of cereals under soil drying. New phytol.
   of disposable presowing irrigation in wheat in increasing water use efficiency                 169, 223–236.
   and maintaining high yield under winter wheat-summer maize rotation in the                  Yendrek, C. R., Tomaz, T., Montes, C. M., Cao, Y., Morse, A. M., Brown, P. J.,
   North China Plain. Agric. Water Manag. 225:105766. doi: 10.1016/j.agwat.2019.                  et al. (2017). High-throughput phenotyping of maize leaf physiological and
   105766                                                                                         biochemical traits using hyperspectral reflectance. Plant Physiol. 173, 614–626.
Vigneau, N., Ecarnot, M., Rabatel, G., and Roumet, P. (2011). Potential of field                  doi: 10.1104/pp.16.01447
   hyperspectral imaging as a non destructive method to assess leaf nitrogen                   Yu, K., Li, F., Gnyp, M. L., Miao, Y., Bareth, G., and Chen, X. (2013). Remotely
   content in Wheat. Field Crops Res. 122, 25–31. doi: 10.1016/j.fcr.2011.02.003                  detecting canopy nitrogen concentration and uptake of paddy rice in the
Vilmus, I., Ecarnot, M., Verzelen, N., and Roumet, P. (2014). Monitoring nitrogen                 Northeast China Plain. ISPRS J. Photogramm. Remote Sens. 78, 102–115. doi:
   leaf resorption kinetics by near-infrared spectroscopy during grain filling in                 10.1016/j.isprsjprs.2013.01.008
   durum wheat in different nitrogen availability conditions. Crop Sci. 54, 284–296.           Zadoks, J. C., Chang, T. T., and Konzak, C. F. (1974). A decimal code for the growth
   doi: 10.2135/cropsci2013.02.0099                                                               stages of cereals. Weed Res. 14, 415–421.
Voss-Fels, K. P., Stahl, A., Wittkop, B., Lichthardt, C., Nagler, S., Rose, T., et al.         Zaveri, E., and Lobell, D. B. (2019). The role of irrigation in changing wheat yields
   (2019). Breeding improves wheat productivity under contrasting agrochemical                    and heat sensitivity in India. Nat. Commun. 10:4144. doi: 10.1038/s41467-019-
   input levels. Nat. Plants 5, 706–714. doi: 10.1038/s41477-019-0445-5                           12183-9
Wang, Z., Zhang, W., Beebout, S. S., Zhang, H., Liu, L., Yang, J., et al. (2016).
   Grain yield, water and nitrogen use efficiencies of rice as influenced by irrigation        Conflict of Interest: The authors declare that the research was conducted in the
   regimes and their interaction with nitrogen rates. Field Crops Res. 193, 54–69.             absence of any commercial or financial relationships that could be construed as a
   doi: 10.1016/j.fcr.2016.03.006                                                              potential conflict of interest.
White, A. C., Rogers, A., Rees, M., and Osborne, C. P. (2016). How can we make
   plants grow faster? A source-sink perspective on growth rate. J. Exp. Bot. 67,              Copyright © 2021 Li, Zhou, Yu, Zhang, Liu, Hu, Liu, Yao, Yang, Wang and Zhang.
   31–45. doi: 10.1093/jxb/erv447                                                              This is an open-access article distributed under the terms of the Creative Commons
Wold, S. (1995). PLS for multivariate linear modeling. Chemometric methods in                  Attribution License (CC BY). The use, distribution or reproduction in other forums
   molecular design 195–218.                                                                   is permitted, provided the original author(s) and the copyright owner(s) are credited
Xu, Z.-Z., Yu, Z.-W., and Wang, D. (2006). Nitrogen translocation in wheat plants              and that the original publication in this journal is cited, in accordance with accepted
   under soil water deficit. Plant Soil 280, 291–303. doi: 10.1007/s11104-005-                 academic practice. No use, distribution or reproduction is permitted which does not
   3276-2                                                                                      comply with these terms.

Frontiers in Plant Science | www.frontiersin.org                                          11                                                April 2021 | Volume 12 | Article 657578
You can also read