Comparative Transcriptomics of Root Development in Wild and Cultivated Carrots - MDPI
←
→
Page content transcription
If your browser does not render page correctly, please read the page content below
G C A T
T A C G
G C A T
           genes
Article
Comparative Transcriptomics of Root Development
in Wild and Cultivated Carrots
Gabriela Machaj 1 , Hamed Bostan 2             ID
                                                    , Alicja Macko-Podgórni 1   ID
                                                                                     , Massimo Iorizzo 2
and Dariusz Grzebelus 1, * ID
 1   Institute of Plant Biology and Biotechnology, Faculty of Biotechnology and Horticulture,
     University of Agriculture in Krakow, 31425 Krakow, Poland; gmachaj@ogr.ur.krakow.pl (G.M.);
     a.macko@urk.edu.pl (A.M.-P.)
 2   Plants for Human Health Institute, Department of Horticultural Science, North Carolina State
     University, Kannapolis, NC 28081, USA; hbostan@ncsu.edu (H.B.); miorizz@ncsu.edu (M.I.)
 *   Correspondence: d.grzebelus@urk.edu.pl; Tel.: +48-12-662-5191

 Received: 6 July 2018; Accepted: 21 August 2018; Published: 24 August 2018

 Abstract: The carrot is the most popular root vegetable worldwide. The genetic makeup underlying
 the development of the edible storage root are fragmentary. Here, we report the first comparative
 transcriptome analysis between wild and cultivated carrot roots at multiple developmental stages.
 Overall, 3285, 4637, and 570 genes were differentially expressed in the cultivated carrot in comparisons
 made for young plants versus developing roots, young plants versus mature roots, and developing
 roots versus mature roots, respectively. Of those, 1916, 2645, and 475, respectively, were retained
 after filtering out genes showing similar profiles of expression in the wild carrot. They were
 assumed to be of special interest with respect to the development of the storage root. Among them,
 transcription factors and genes encoding proteins involved in post-translational modifications
 (signal transduction and ubiquitination) were mostly upregulated, while those involved in redox
 signaling were mostly downregulated. Also, genes encoding proteins regulating cell cycle, involved in
 cell divisions, development of vascular tissue, water transport, and sugar metabolism were enriched
 in the upregulated clusters. Genes encoding components of photosystem I and II, together with genes
 involved in carotenoid biosynthesis, were upregulated in the cultivated roots, as opposed to the wild
 roots; however, they were largely downregulated in the mature storage root, as compared with
 the young and developing root. The experiment produced robust resources for future investigations
 on the regulation of storage root formation in carrot and Apiaceae.

 Keywords: Daucus carota L.; DEGs; domestication; gene expression regulation; storage root; transcriptome

1. Introduction
      The carrot (Daucus carota subsp. sativus L.) is one of the most important vegetable crops in the world
with a current annual yield of more than 40 million tons produced on ca. 1.2 million hectares [1].
The orange-rooted carrot owes its popularity to its high nutritional, palatable roots, which are the main
source of beta-carotene (provitamin A) in the human diet [2]. The cultivated carrot (2n = 2x = 18, haploid
genome size of 473 Mb) was derived from the wild carrot (Daucus carota L. subsp. carota) ca. 1100 years
ago in Central Asia [3]. The first domesticated carrots were purple and yellow [4]. Carrots producing
orange roots likely appeared in the Netherlands in the 16th century [5] and spread to other countries,
becoming predominant in the commercial production. Essential differences between the cultivated
carrot and its wild progenitor, including the ability to form fleshy roots, minimal lateral root branching,
strictly biennial growth habit, and elevated sugar content in the roots, define the carrot domestication

Genes 2018, 9, 431; doi:10.3390/genes9090431                                               www.mdpi.com/journal/genes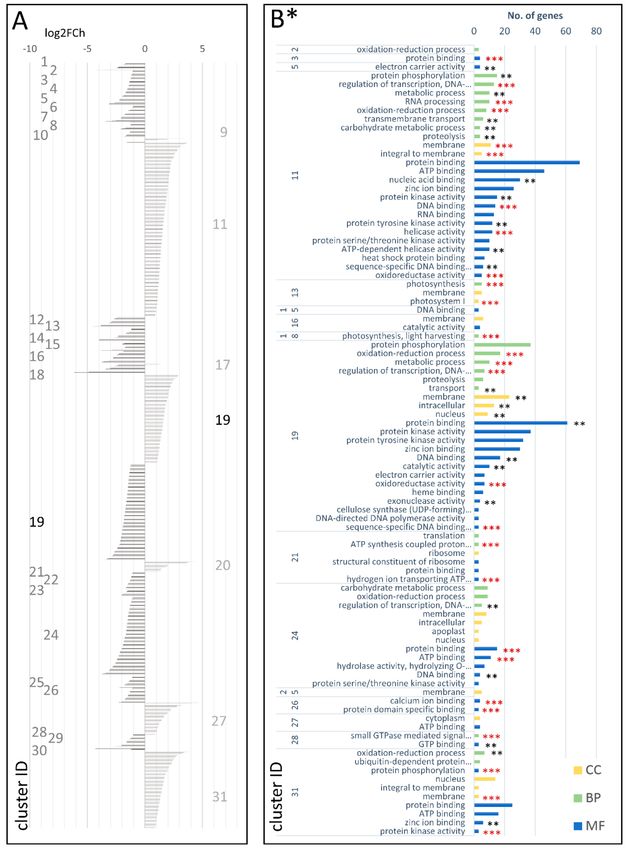
Genes 2018, 9, 431                                                                                      2 of 20

syndrome [6]. Wild carrot roots, as opposed to those produced by cultivated varieties, are white, woody,
and branched, whereas domesticated carrots have pigmented, smooth, fleshy roots with nice flavor [7].
     A previous study suggested hormonal control of storage root development [8]. Rong et al. (2014)
reported on genes probably associated with the storage root formation (e.g., those encoding water
channel proteins) and emphasized that changes in gene expression might be essential for carrot
domestication [7]. The recent release of a high-quality carrot genome assembly [9] allows for more
systematic research to identify the genetic factors responsible for the transition from the thin and
woody root of the wild carrot to the fleshy storage root of the cultivated carrot.
     Here, we report on the first high coverage comparative transcriptome analysis of wild and
cultivated carrot accessions in the course of root development. We analyzed transcriptomes of
a cultivated breeding line 2874B producing orange roots and a wild D. carota subsp. commutatus in three
biological replicates in three time points. We identified and compared differentially expressed genes
(DEGs) during root development in cultivated and wild carrots. Our comprehensive transcriptomic
analyses provide insight into the genetic complexity and expand our knowledge about the genetic
basis of storage root development.

2. Materials and Methods

2.1. Plant Materials
      An orange-rooted cultivated breeding line 2874B and a wild accession of D. carota subsp. commutatus
(JKI-W232/07) were grown in pots in the greenhouse. Samples for RNA extraction were collected at three
timepoints (i.e., T1—55 days after sowing (young plants with two true leaves); T2—110 days after sowing
(developing roots); and T3—165 days after sowing (mature roots)). At each timepoint, three randomly
selected plants per accession were harvested, resulting in three biological replicates per timepoint and the
total of 18 samples used for transcriptome sequencing (Figure 1, Table S1 in the Supplementary Materials).

      Figure 1. A diagram illustrating the applied experimental strategy and Venn diagrams showing
      numbers of differentially expressed genes (DEGs) identified in comparisons between wild (w) and
      cultivated (c) carrots in each of the three timepoints. ↑—upregulated genes; ↓—downregulated genes;
      *—genes with discordant expression patterns between wild and cultivated carrots.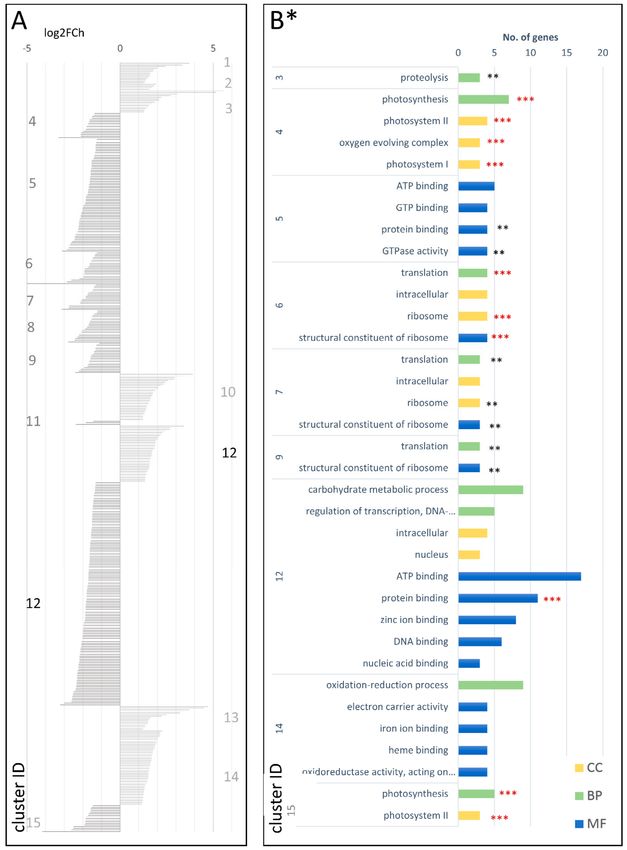
Genes 2018, 9, 431                                                                                      3 of 20

2.2. RNA Extraction and RNAseq
     Total RNA was extracted from fresh plantlets (T1) and roots (T2, T3) using NucleoSpin RNA
(Macherey-Nagel, Düren, Germany) combined with TRIzol Reagent (Thermo Fisher Scientific,
Waltham, MA, USA; Invitrogen, Carlsbad, CA, USA) and Fruit-mate for RNA Purification reagent
(Clontech; Takara, Otsu, Japan) as described by the manufacturers. DNA contaminations were
removed with the Turbo DNA-free kit (Thermo Fisher Scientific; Ambion; Austin, TX, USA) following
the manufacturer’s protocol. The quality and quantity of RNA was determined using NanoDrop
2000c (Thermo Fisher Scientific) and gel electrophoresis. mRNA was obtained from RNA samples
using NEBNext® Poly(A) mRNA Magnetic Isolation Module (NEB; Herts, UK). After quality control
(Agilent 2100 Bioanalyzer; Agilent Technologies, Palo Alto, CA, USA) and library preparation
(NEBNext® Ultra™ Directional RNA Library Prep Kit for Illumina, NEB), cDNA was sequenced
in PE100 (paired ends mode, 100 bp) using HighSeq 4000 (Illumina; San Diego, CA, USA) next
generation sequencing platform.

2.3. RNAseq Data Analysis
      The raw sequences were subjected to adaptor removal and quality control using Trimmomatic [10]
using the following parameters: Leading: 20; Tailing: 20; SlideWindow: 5:20; MinLen: 50; TRueSeq3-PE;
and fa.2:30:10. Bowtie 2 [11] was used to map the high-quality reads to the carrot rRNA sequences
extracted from the reference genome annotation files [9] (NCBI accession LNRQ01000000) (parameters fast
end-to-end mode; D: 10; R: 2; N: 0; L: 22; and i: S,0,2.50). Reads matching the rRNA sequences
were discarded from further analysis. Reads were then mapped to the carrot DH1 reference
genome [9] (NCBI accession LNRQ01000000) using a 2-pass alignment approach with STAR [12] with
the following parameters: outSAMmapqUnique: 50; outFilterMultimapNmax: 20; alignSJoverhangMin:
8; alignSJDBoverhangMin: 1; outFilterMismatchNmax: 999; outFilterMismatchNoverLmax: 0.04;
alignIntronMin: 20; alignIntronMax: 1,000,000; and alignMatesGapMax: 1,000,000. De novo isoforms
and transcripts were identified with StringTie [13] using the following parameters: min-length: 200;
junction-coverage: 10; and min-coverage: 10. The reference annotation was merged with new
isoform data using Cuffmerge [14]. Candidate coding regions within transcripts were identified with
TransDecoder [15].
      Kallisto [16] was used to estimate expression levels in each sample separately. Read counts were
expressed in TPM (transcripts per million) units. Differentially expressed genes were identified using three
R packages: DESeq2 [17], EBSeq [18], and edgeR [19]. DEGs (minimum read count = 10) were called when
false discovery rate (FDR) ≤0.05 was reported for all three algorithms (Figures S1–S3 in the Supplementary
Materials). First, we compared expression patterns in T1 versus T2, T1 versus T3, and T2 versus T3,
separately for the cultivated (c) and the wild (w) accessions (Figure 1). Genes with expression changes
validated as significant by all three DEG detection methods were retained, resulting in the six datasets
(c.1.2; c.1.3; c.2.3; w.1.2; w.1.3; and w.2.3) from these pairwise comparisons (Figure 1). Finally, to identify
genes essential for the storage root development, we compared results obtained for the cultivated and
the wild accessions in the following manner: c.1.2 versus w.1.2 (c/w.1.2); c.1.3 versus w.1.3 (c/w.1.3);
and c.2.3 versus w.2.3 (c/w.2.3). Further, genes differentially expressed in cultivated and wild carrots were
retained, resulting in six datasets (cDEG.1.2; cDEG.1.3; cDEG.2.3, wDEG.1.2; wDEG.1.3; and wDEG.2.3)
comprising DEGs likely engaged in the root development (Figure 1). In addition, we identified DEGs
differentiating the wild and the cultivated accessions in each timepoint (i.e., T1, T2, and T3), resulting in
three additional datasets wcDEG.1, wcDEG.2, and wcDEG.3. The detailed explanation of the numerical
code system used for reporting the data is presented in Table 1. DEGs from each comparison were used
to perform co-expression clustering and gene ontology (GO) enrichment/association analysis. To identify
the genes with similar pattern of expression in each comparison, k-means clustering [20,21] was carried
out using k as the number of clusters defined for each set depending on the sample size (Tables S11–S19 in
the Supplementary Materials) using the GO annotation of carrot genes v2.0 [9]. GO enrichment analysis
was conducted on each cluster of each comparison independently using Fisher exact test considering FDR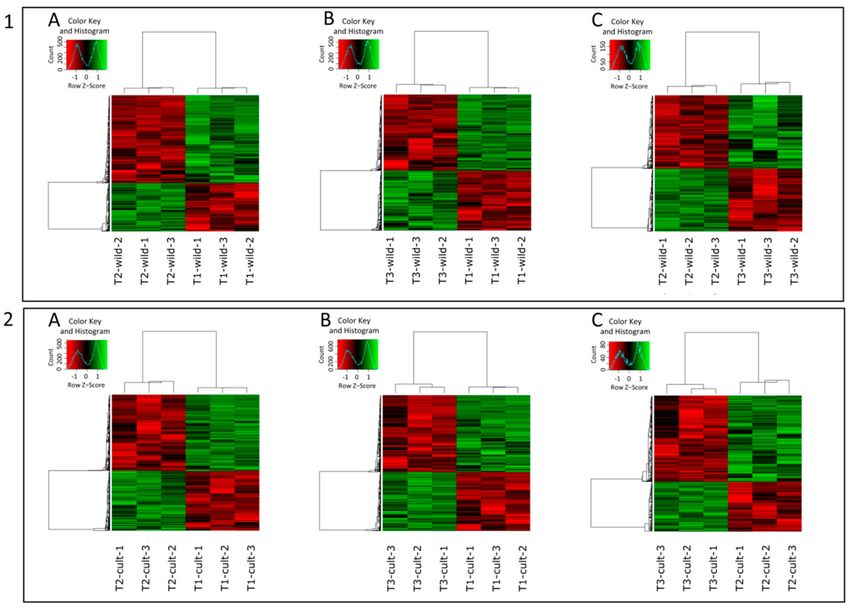
Genes 2018, 9, 431                                                                                                                   4 of 20

≤0.05 (Tables S20 and S21 in the Supplementary Materials). All reported gene functional annotations are
reported according to Iorizzo et al. (2016) [9].

      Table 1. Description of the method used to label the reported comparisons and DEG clusters.
      GO—gene ontology.

          Type of Comparison                              Time Points                                Cluster Number              Codes Used
  Code             Description             Code                Description                    Code         Description           in the Text

           ‘c’ refers to DEGs observed     1.2.                                                                                  cDEG.1.2.XX
  cDEG.     in the cultivated roots but    1.3.                                                                                  cDEG.1.3.XX
                                                   Digits refer to the timepoints (T1 vs.            Consecutive numbering
                not in the wild roots      2.3.                                                                                  cDEG.2.3.XX
                                                   T2, T1 vs. T3 or T2 vs. T3) used for                 resulting from GO
           ‘w’ refers to DEGs observed     1.2.                 comparison                           enrichment analysis; ‘XX’   wDEG.1.2.XX
 wDEG.      in the wild roots but not in   1.3.                                               XX                                 wDEG.1.3.XX
                                                                                                     stands for the one or two
                the cultivated roots       2.3.                                                       digits representing the    wDEG.2.3.XX
                                            1     Digit refers to the timepoint (T1, T2, or                   clusters           wcDEG.1.XX
              ‘wc’ refers to DEGs
 wcDEG.                                     2     T3) for which the wild and cultivated                                          wcDEG.2.XX
              observed for wild vs.
                                            3        transcriptomes were compared                                                wcDEG.3.XX
             cultivated comparison

3. Results and Discussion

3.1. RNAseq Summary and Identification of Novel Transcripts
     We obtained ca. 18,400,000 read pairs per sample, more than 90% (71.9–97.7%, mean = 93%; Table S2
in the Supplementary Materials) were uniquely mapped to the reference carrot genome (LNRQ01000000)
and used to identify DEGs and novel transcripts. We identified 9978 novel transcripts, comprising
7765 novel isoforms of annotated genes, 567 novel intergenic transcripts, 510 and 773 exon-overlapping
transcripts (sense and antisense, respectively), and 339 novel transcripts in intronic regions (Table S3 in
the Supplementary Materials).

3.2. Differential Expression
     DEGs were identified in all possible timepoint pairwise comparisons, separately for the wild
(w.1.2, w.1.3, and w.2.3) and the cultivated (c.1.2, c.1.3, and c.2.3) carrot accessions (Figure 2).
     In the wild carrot, a total of 5930 genes were differentially expressed in at least one comparison
(Figure 2(1)). Among them, 157 genes were differentially expressed in all three comparisons (Figure 3A).
3525 DEGs were identified in w.1.2 (Figure 2(1A) and Figure 3A; Table S4 in the Supplemental Materials)
with 2272 and 1253 being down- and upregulated, respectively. In w.1.3, 3667 DEGs were identified,
with 2052 and 1615 down- and upregulated, respectively (Figure 2(1B) and Figure 3A; Table S5 in
the Supplemental Materials). w.2.3 resulted in 1368 DEGs, of which 737 and 631 were down- and
upregulated, respectively, in the mature root of the wild accession (Figure 2(1C) and Figure 3A; Table
S6 in the Supplemental Materials).
     5776 genes were differentially expressed in the cultivated carrot (Figure 2(2)), of which 114 were
differentially expressed in all three comparisons (Figure 3B). In c.1.2, 1442 and 1843 DEGs were up-
and downregulated, respectively (Figure 2(2A) and Figure 3B; Table S7 in the Supplemental Materials).
In c.1.3, 4637 DEGs were identified, of which 2013 were upregulated and 2626 were downregulated
(Figure 2(2B) and Figure 3B; Table S8 in the Supplemental Materials). In c.2.3, 570 genes were
differentially expressed, comprising 208 and 362 up- and downregulated, respectively (Figure 2(2C)
and Figure 3B; Table S9 in the Supplemental Materials).
     We then partitioned the sets of DEGs into three categories: (1) those regulated in a similar fashion
during the development of wild and cultivated roots (c/w.1.2; c/w.1.3; and c/w.2.3, with 1360; 1992;
and 95 genes, respectively); (2) those specific to the cultivated carrot (cDEG.1.2; cDEG.1.3; and cDEG.2.3,
comprising 1916; 2645; and 475 genes, respectively) and (3) those specific to the wild carrot (wDEG.1.2;
wDEG.1.3; and wDEG.2.3, comprising 2165; 1675; and 1272 genes, respectively) (Figure 1). The data on
the expression level and profile cluster, GO association, and enrichment for each of the above DEG sets in
each comparison are provided in the Supplementary Materials (Tables S11–S21). A very small fraction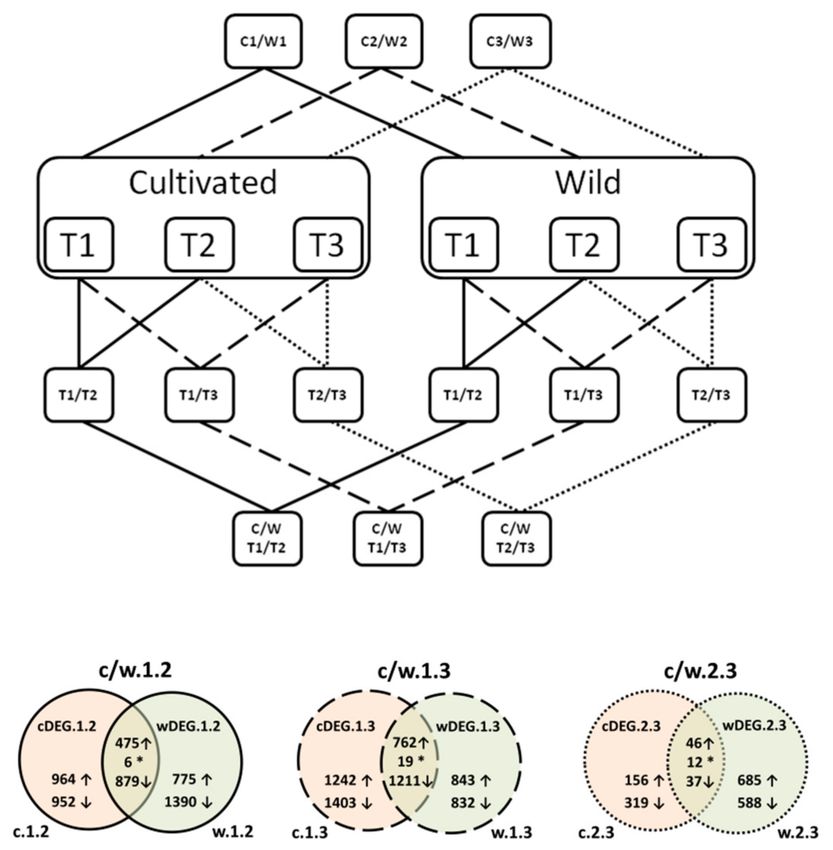
Genes 2018, 9, 431                                                                                         5 of 20

of genes (6, 19, and 12 genes for c/w.1.2; c/w.1.3; and c/w.2.3, respectively) differentially regulated in
both wild and cultivated carrots, but showing discordant expression patterns, was revealed (Figure 1,
Supplementary Tables S10–S13). However, in order to investigate genome-wide relationships and identify
groups of genes involved in the formation of the carrot storage root, in the following section, we focused
on the DEG sets specific to the root of the cultivated carrot (category 2 listed above).

      Figure 2. Heatmaps representing DEGs in wild (1) and cultivated (2) carrots for time points: T1 vs. T2
      (A), T1 vs. T3 (B), and T2 vs. T3 (C). Row z-score represents normalized expression of DEGs.

      Figure 3. Venn diagrams showing number of DEGs in wild (A) and cultivated (B) carrots for each
      comparison (T1 vs. T2, T1 vs. T3, and T2 vs. T3).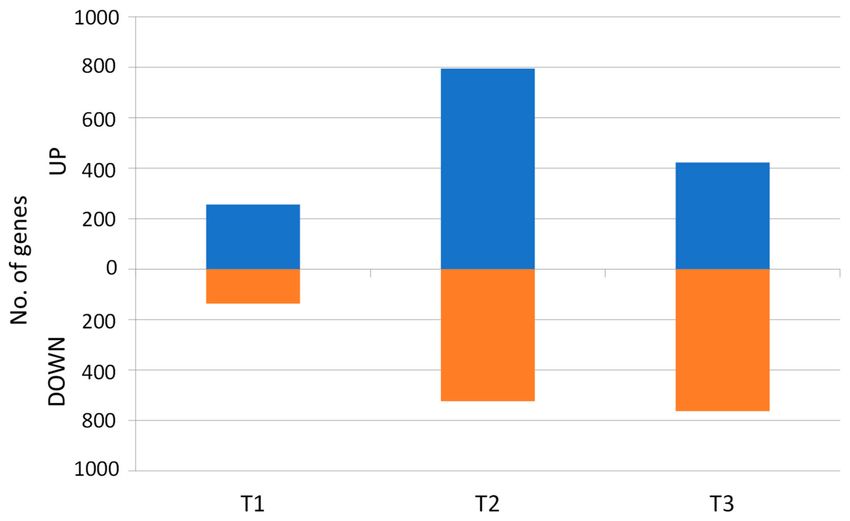
Genes 2018, 9, 431 6 of 20
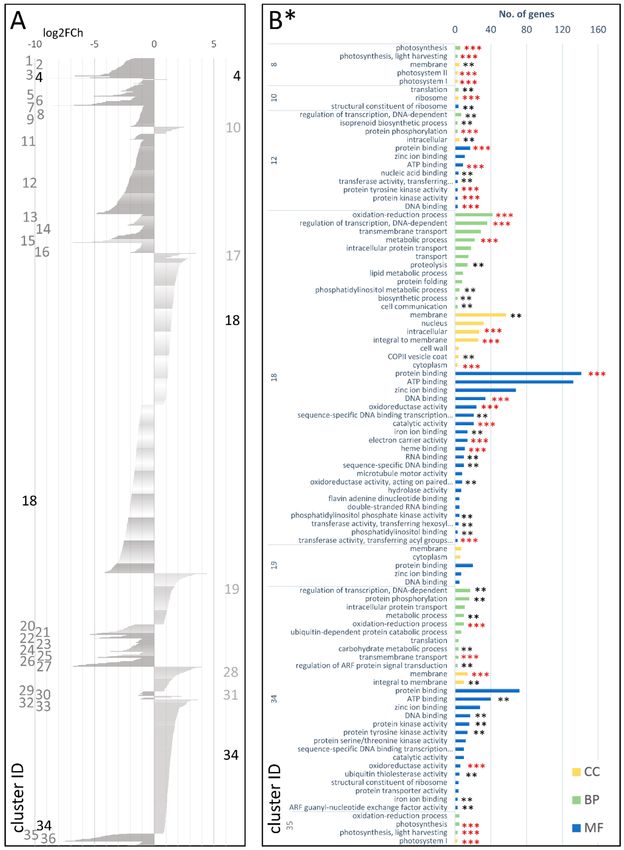
3.2.1. cDEG.1.2: Genes Differentially Expressed in the Developing Storage Root (T2), as Compared
with the Young Plant (T1)
DEGs attributed to the cDEG.1.2 dataset were grouped into 31 co-expressed gene clusters (Figure 4A,
Table S14 of the Supplementary Materials). Of those, six and 24 clusters comprised only up- and
downregulated DEGs, respectively, while the largest cluster, cDEG.1.2.19, included 222 up- and
246 downregulated DEGs. GO-enriched categories with regard to biological processes (BP) comprised
protein phosphorylation, oxidation-reduction process, and regulation of transcription. Protein and ATP
binding were the most enriched molecular functions (MF), while membrane and nucleus were the most
enriched cellular components (CC) (Figure 4B; Table S20 in the Supplementary Materials).
A more detailed functional analysis of genes comprising the up-regulated clusters pointed
at their possible significance in the process of storage root development. For example,
cluster cDEG.1.2.11 grouping 433 DEGs (log2FCh = 0.88–3.70) included genes involved in
transcription regulation, prevention of vegetative-to-reproductive phase switch (flowering time
negative regulation), root development, mitotic cell division, mRNA splicing, and translation.
In cDEG.1.2.20, 29 DEGs (log2FCh = 1.13–2.27) were attributed to multicellular organism development,
transcription, and light-dependent circadian clock regulation, while cDEG.1.2.27 included 80 DEGs
(log2FCh = 0.89–4.67) related to cell division/proliferation, plant growth and development, circadian
clock, cell wall biogenesis, and transcription regulation. In cluster cDEG.1.2.31, 192 DEGs
(log2FCh = 0.89–3.95) were involved in root development, cell division, vascular strand development,
limitation of programmed cell death, hormonal response, sugar transport, and transcription regulation.
DEGs grouped in the 24 clusters downregulated in the cultivated but not in the wild
developing root, as compared with the young plant stage, were enriched in genes associated with
oxidation-reduction process, carbohydrate metabolic process, regulation of transcription, nucleosome
assembly, ATP synthesis coupled proton transport, and photosynthesis. In terms of molecular function,
they were attributed to ATP binding, DNA binding, hydrolase activity, hydrolyzing O-glycosyl
compounds, hydrogen ion transporting ATP synthase activity, and protein domain specific binding
(Figure 4B; Table S20 in the Supplementary Materials).Genes 2018, 9, 431 7 of 20
Figure 4. Clusters of DEGs in the cultivated carrot (young plant vs. developing root; cDEG.1.2)
showing log2FoldChange values (A) and GO enrichment results (B). CC—cellular component;
BP—biological process MF—molecular function; *—number of genes in set >2; **—adjusted p-value <
0.01; and ***—adjusted p-value < 0.001.
3.2.2. cDEG.1.3—Genes Differentially Expressed in the Mature Storage Root (T3), as Compared with
the Young Plant (T1)
In total, 2654 DEGs were identified in the cDEG.1.3 set, of which 1242 and 1403 were up- and
downregulated in the mature carrot storage root, respectively. They were grouped into 36 co-expressedGenes 2018, 9, 431 8 of 20
clusters (Figure 5A; Table S15 in the Supplementary Materials), of which six were upregulated and
29 downregulated and one large cluster (cDEG.1.3.18) comprised both up- and down-regulated genes
(492 and 568, respectively). The up-regulated clusters in cDEG.1.3 were enriched in genes involved
in regulation of transcription, oxidation-reduction process protein phosphorylation, transmembrane
transport, and carbohydrate metabolism (biological processes, BPs) and protein/ATP/zinc ion/DNA
binding (molecular functions, MFs) and were mostly localized in the membrane or the nucleus
(cellular components, CCs) (Figure 5B; Table S20 in the Supplementary Materials). More detailed functions
could have been attributed to upregulated DEGs grouped in individual clusters (e.g., cell wall biogenesis,
plant/root development, and translation (cDEG.1.3.10; log2FCh = 0.91–2.84); plant development, cell
proliferation, and hormonal regulation (cDEG.1.3.17; log2FCh = 0.96–4.32); transcription, cell wall
biogenesis, hormonal signaling, and lateral root formation (cDEG.1.3.19; log2FCh = 0.79–4.40); regulation
of transcription, plant development, hormonal signaling, cell wall organization, and xylogenesis
in roots (cDEG.1.3.28; log2FCh = 0.79–4.40); cell wall biogenesis and water transport (cDEG.1.3.31;
log2FCh = 1.42–3.11); regulation of transcription, plant development, cell growth, cell wall biogenesis,
maintenance of the vegetative phase, mRNA splicing, translation, ubiquitin-dependent protein catabolic
process, protein transport, and vesicle-mediated transport (cDEG.1.3.34; log2FCh = 0.77–3.63)).
The 29 downregulated clusters in cDEG.1.3 comprised genes associated with photosynthesis
and light harvesting, nucleosome assembly, regulation of transcription, oxidation-reduction process,
and isoprenoid biosynthesis. Many genes from these clusters were components of membrane,
nucleosome, oxygen evolving complex, and photosystems I and II (Figure 5B; Table S20 in
the Supplementary Materials).Genes 2018, 9, 431 9 of 20
Figure 5. Clusters of DEGs in the cultivated carrot (young plant v. mature root; cDEG.1.3) showing
log2FoldChange values (A) and GO enrichment results (B). Several clusters and enrichment terms
in (B) were omitted for the clarity of presentation. CC—cellular component; BP—biological process
MF—molecular function; *—number of genes in set >2; **—adjusted p-value < 0.01; and ***—adjusted
p-value < 0.001.Genes 2018, 9, 431 10 of 20
3.2.3. cDEG.2.3—Genes Differentially Expressed in the Mature Storage Root (T3), as Compared with
the Developing Storage Root (T2)
A much less numerous set of DEGs was identified in cDEG.2.3, including the total of 475 genes,
of which 156 and 319 were up- and downregulated, respectively. They were grouped into
15 co-expressed clusters (Figure 6A; Table S16 in the Supplementary Materials) comprising six and
eight clusters up- and downregulated in the mature root, respectively. One cluster (cDEG.2.3.12)
comprised 35 upregulated and 138 downregulated DEGs. With respect to the biological processes,
the upregulated genes were enriched in those involved in DNA-dependent regulation of transcription,
oligopeptide transport, and protein phosphorylation, while the most common biological functions
were protein binding, ATP binding, and transport. Nuclear and intracellular localizations prevailed.
The downregulated gene clusters comprised DEGs related to oxidation-reduction process, translation,
and photosynthesis (BP), ATP binding (MF), and membrane, ribosomes, and photosystems I and II
(CC) (Figure 6B; Table S20 in the Supplementary Materials).
A more detailed analysis of individual clusters showed that cDEG.2.3.2 contained four
upregulated genes (log2FCh = 1.57–1.92) associated with water uptake and transport and that
cDEG.2.3.1 grouped 13 upregulated genes (log2FCh = 1.28–3.71) likely involved in root/lateral
root development and water transport. In the clusters cDEG.2.3.3 (14; log2FCh = 1.28–5.56)
and cDEG.2.3.13 (15; log2FCh = 1.21–4.72), upregulated DEGs were associated with cell wall
formation/modification, phloem/xylem histogenesis, and cell differentiation. Genes from cluster
cDEG.2.3.10 (29; log2FCh = 1.20–3.90) could have been attributed to sugar/carbohydrate metabolism
and transport, flavonoid biosynthesis, and transcriptional regulation of plant development.
Also, the cluster cDEG.2.3.14 comprised upregulated genes (log2FCh = 1.18–2.27) probably related
to cell wall organization/biosynthesis, regulation of transcription, and carbohydrate metabolism.
Probable functions of upregulated genes in the cluster cDEG.2.3.12 (log2FCh = 1.33–3.42) may be
related to polysaccharide/sugar metabolism, hormonal regulation (e.g., auxin, abscisic acid (ABA)),
root and vascular tissue development, and plant and cell growth.
The downregulated genes in the cDEG2.3 set were primarily involved in chlorophyll biosynthesis,
photosynthesis (photosystem I and II), and chloroplast formation, but also with sugar transport and sucrose
and starch metabolism (Figure 5B; Table S20 in the Supplementary Materials). Interestingly, two key genes
involved in carotenoid biosynthesis (i.e., PSY2 (phytoene synthase 2) and LCYE (lycopene epsilon cyclase))
were found to be significantly downregulated in clusters cDEG2.3.8 and cDEG2.3.5, respectively.Genes 2018, 9, 431 11 of 20
Figure 6. Clusters of DEGs in cultivated carrot (developing root vs. mature root; cDEG.2.3) showing
log2FoldChange values (A) and GO enrichment results (B). CC—cellular component; BP—biological
process; MF—molecular function; *—number of genes in set >2; **—adjusted p-value < 0.01;
and ***—adjusted p-value < 0.001.
3.2.4. DEGs between Wild in Cultivated D. carota at the Three Timepoints (wcDEG.1, wcDEG.2,
and wcDEG.3)
In addition to the investigation on developmentally differentially regulated genes, we performed
analysis aiming at the identification of DEGs in the two accessions directly differentiating the wild andGenes 2018, 9, 431 12 of 20
the cultivated plants at each timepoint (Tables S22–S26 in the Supplementary Materials). In T1, 393 DEGs
were identified, of which 256 and 137 were up- and downregulated, respectively. They were grouped
into 14 clusters, of which 10 were upregulated in the cultivated, two were downregulated, and two
comprised up- and downregulated genes (Table S22 in the Supplementary Materials). In T2, 1319 genes
were differentially expressed; they were grouped into 26 clusters, of which 19 were upregulated and
six were downregulated in the cultivated carrot. The one remaining cluster comprised both up- and
downregulated genes (Table S23 in the Supplementary Materials). In T3, 986 DEGs were revealed,
and 22 clusters were distinguished, of which only seven were upregulated in the mature storage roots,
while 14 clusters included downregulated genes and one grouped both up- and downregulated DEGs
(Table S24 in the Supplementary Materials). In summary, a general shift in gene expression could have
been observed, from higher expression levels in the young plants and developing roots of the cultivated
carrot to lower expression in the mature storage root, relative to the wild carrot (Figure 7).
Figure 7. DEGs up- and downregulated (blue and orange bars, respectively) in the cultivated carrot at
three timepoints, as related to the wild carrot.
GO analysis revealed that DEGs resulting from the comparison between the wild and
the cultivated accession could have been attributed to diverse biological process categories. We focused
on GO categories that were enriched for the developmentally regulated DEGs. Genes involved in
processes related to photosynthesis were systematically upregulated in the cultivated carrot at all
timepoints (clusters wcDEG.1.3, wcDEG.1.6, wcDEG.1.12, wcDEG.2.1, wcDEG.2.12, wcDEG.2.19,
wcDEG.2.20, wcDEG.2.21, wcDEG.2.26, wcDEG.3.7, and wcDEG.3.9). In contrast, DEGs involved in
the regulation of transcription and protein phosphorylation were grouped into up- and downregulated
clusters, mostly at T2 and T3 (e.g., wcDEG.3.3 and wcDEG.3.19 vs. wcDEG.2.10 and wcDEG.3.6,
respectively), similar to those involved in the sucrose and carbohydrate metabolism (wcDEG.2.8 vs.
wcDEG.2.6), while DEGs involved in the cell wall formation were upregulated in the cultivated carrot
only at T1 (S22–S26 in the Supplementary Materials). This shows that the analysis performed on
the developmentally regulated DEGs (cDEGs) provided more insight into the process of storage root
formation than the direct comparison of transcriptomes of the two accessions (wcDEGs).
3.3. Genetic Determinants of the Carrot Storage Root Development
RNAseq has been previously used to elucidate expression changes underlying the development of
storage organs (e.g., sweet potato [22]; radish [23]). Previous reports on carrot root transcriptomes [7,24]
provided preliminary insight into mechanisms governing the storage root formation, while here we
presented the first genome based, comparative transcriptome analysis of root development in wildGenes 2018, 9, 431 13 of 20
and cultivated carrots. Using a replicated sampling at three developmental stages, we were able
to recognize DEGs during root growth in both wild and edible carrots. Most importantly, utilizing
wild carrot transcriptomes as a reference, we identified subsets of genes (cDEGs) likely essential for
the development of fleshy roots in the cultivated carrots at different stages of root growth.
In the following subsections, using evidence from the analysis of the cDEG datasets, we show
that storage root development requires a complex array of regulatory processes, including
transcriptional regulation, post-translational protein modifications (phosphorylation, ubiquitination),
redox, and hormonal signaling. They likely regulate a range of developmental processes (e.g., cell
division and proliferation, developmental phase control, cell wall development, vascular tissue
biogenesis, carbohydrate metabolisms, water uptake and transport).
3.3.1. Regulation of the Carrot Storage Root Development
3.3.1.1. Transcription Factors
In cultivated carrot roots we identified a number of differentially expressed transcription
factors (TFs) of several families (i.e., bZIP, ERF, GATA, NF-Y, WRKY, bHLH, GTE, MYB1R1, TCP,
and trihelix TFs being the most abundant (Table 2; Tables S14–S16 in the Supplementary Materials)).
Interestingly, they were mostly upregulated at later stages of the root development in comparison
with their expression in young plants. They were clustered primarily in cDEG.1.2.11, cDEG.1.2.19,
and cDEG.1.2.27 (young plant vs. immature root); cDEG.1.3.19 and cDEG.1.3.34 (young plant vs.
mature root); and cDEG.2.3.5 and cDEG.2.3.14 (immature vs. mature root). Several representatives
of the abovementioned TF families have been reported as being involved in the regulation of root
development (NF-Y [25,26]), organ shape (trihelix TF [27]), and root epidermal cell fate specification
(EGL1 and bHLH [28]).
Moreover, we identified nine DEGs representing the AT-hook motif containing nuclear localized
(AHL) family. AHLs act as transcription regulators due to their capability of binding AT-rich DNA
fragments and have been reported as regulators of hypocotyl growth [29], defense response [30],
and flowering [31]. Notably, AHL28-like (LOC108210904) showed a very high change in its level
of expression (log2FCh = 3.3 and 1.689) in two comparisons (cDEG.1.3 and cDEG.2.3, respectively).
Also, AHL5-like (LOC108209748) was found among differentially expressed AHLs. Previously, it has
been proposed as a candidate domestication gene in carrot (DcAHLc1), likely involved in the storage root
development [6], as it was associated with a region under strong selection in the cultivated carrot [32].
Here, DcAHLc1 gene was significantly downregulated (FDR ≤ 0.001 and 0.01) in both cultivated (T1 vs. T3:
log2FCh = −1.830) and wild (T1 vs. T3: log2FCh = −1.922; T2 vs. T3: log2FCh = −1.443) carrots. Possibly,
the fact that DcAHLc1 is regulated in a similar fashion during root growth both in cultivated and
wild carrots supports the view proposed by Macko-Podgórni et al. (2017) that structural differences of
the DcAHLc1 variant present in cultivated carrots determine the effect of the gene on the development of
storage roots [6].Genes 2018, 9, 431 14 of 20
Table 2. Transcription factors differentially expressed in the cultivated carrot.
Comparison Cluster ID Gene ID Functional Annotation log2FoldChange
cDEG.1.2 11 LOC108218660 transcription factor GTE4-like 2.218323
cDEG.1.2 11 LOC108218615 transcription factor TCP8-like 2.115051
cDEG.1.2 11 LOC108227595 transcription factor GTE8-like 2.110012
cDEG.1.2 11 LOC108204589 trihelix transcription factor GT-2-like 1.567139
cDEG.1.2 11 LOC108208638 trihelix transcription factor ASIL1-like 1.502276
cDEG.1.2 11 LOC108205163 transcription factor EGL1-like 1.268485
cDEG.1.2 19 LOC108196018 transcription factor GTE7-like 1.534413
cDEG.1.2 19 LOC108215981 transcription factor IIIB 90 kDa subunit-like 1.434734
cDEG.1.2 19 LOC108219662 GATA transcription factor 11-like 1.210731
cDEG.1.2 19 LOC108205675 transcription factor TCP8-like 1.074681
cDEG.1.2 20 LOC108196925 transcription factor MYB1R1-like 1.705882
cDEG.1.2 27 LOC108219074 trihelix transcription factor PTL 2.193835
cDEG.1.2 27 LOC108209692 ethylene-responsive transcription factor ERF118-like 2.100109
cDEG.1.2 27 LOC108209999 transcription factor MYB1R1-like 1.675776
cDEG.1.2 27 LOC108200607 GATA transcription factor 16 1.372083
cDEG.1.2 27 LOC108219053 ethylene-responsive transcription factor RAP2-13 1.068196
cDEG.1.2 31 LOC108223963 bZIP transcription factor 60-like 1.437431
cDEG.1.2 31 LOC108219044 transcription factor TCP20 1.274651
cDEG.1.2 31 LOC108218833 bZIP transcription factor 17-like 1.194341
cDEG.1.3 18 LOC108204549 general transcription factor 3C polypeptide 3 2.767626
cDEG.1.3 18 LOC108208932 heat stress transcription factor C-1-like 2.14659
cDEG.1.3 18 LOC108204669 helicase-like transcription factor CHR28 1.576643
cDEG.1.3 18 LOC108219601 WRKY transcription factor 1-like 1.371966
cDEG.1.3 18 LOC108205270 GATA transcription factor 26-like 1.267808
cDEG.1.3 18 LOC108227355 transcription factor bHLH130-like 1.150305
cDEG.1.3 19 LOC108218615 transcription factor TCP8-like 3.326214
cDEG.1.3 19 LOC108218436 nuclear transcription factor Y subunit A-10 2.583937
cDEG.1.3 19 LOC108205657 WRKY transcription factor 21 2.093602
cDEG.1.3 19 LOC108213173 ethylene-responsive transcription factor RAP2-1-like 1.936345
cDEG.1.3 19 LOC108210769 WRKY transcription factor 69 1.581155
cDEG.1.3 19 LOC108215331 WRKY transcription factor 21 1.340796
cDEG.1.3 19 LOC108205942 transcription factor MYB1R1-like 1.16443
cDEG.1.3 19 LOC108213035 transcription factor bHLH68 0.964932
cDEG.1.3 19 LOC108203417 transcription factor GTE2-like 0.924269
cDEG.1.3 19 LOC108219684 trihelix transcription factor ASIL2 0.814925
cDEG.1.3 28 LOC108200607 GATA transcription factor 16 1.452332
cDEG.1.3 28 LOC108196925 transcription factor MYB1R1-like 1.179838
cDEG.1.3 34 LOC108219539 transcription factor TGA1-like 2.492909
cDEG.1.3 34 LOC108200279 WRKY transcription factor 57 1.972727
cDEG.1.3 34 LOC108227595 transcription factor GTE8-like 1.901753
cDEG.1.3 34 LOC108223963 bZIP transcription factor 60-like 1.775269
cDEG.1.3 34 LOC108206522 ethylene-responsive transcription factor 4-like 1.713784
cDEG.1.3 34 LOC108214474 transcription factor LHW-like 1.695994
cDEG.1.3 34 LOC108197784 WRKY transcription factor 28 1.669975
cDEG.1.3 34 LOC108208638 trihelix transcription factor ASIL1-like 1.472099
cDEG.1.3 34 LOC108218767 WRKY transcription factor 3 1.434899
cDEG.1.3 34 LOC108194726 trihelix transcription factor ASR3 1.425662
cDEG.1.3 34 LOC108227612 transcription factor 25 1.400666
cDEG.1.3 34 LOC108194205 ethylene-responsive transcription factor ERF008-like 1.361216
cDEG.1.3 34 LOC108197411 transcription factor bHLH113-like 1.250711
cDEG.1.3 34 LOC108205979 trihelix transcription factor GT-1 1.052866
cDEG.2.3 3 LOC108220123 ethylene-responsive transcription factor 2-like 1.291574
cDEG.2.3 5 LOC108211036 transcription factor PCL1-like −1.98882
cDEG.2.3 5 LOC108224748 nuclear transcription factor Y subunit C-1-like −1.72038
cDEG.2.3 5 LOC108218926 NAC transcription factor 29-like −1.58027
cDEG.2.3 12 LOC108220417 transcription factor MYB48-like −2.28333
cDEG.2.3 12 LOC108214397 heat stress transcription factor A-3-like −1.49692
cDEG.2.3 14 LOC108211325 ethylene-responsive transcription factor ERF010-like 2.266422
cDEG.2.3 14 LOC108197506 transcription factor bHLH147 1.218184
cDEG.2.3 14 LOC108192438 nuclear transcription factor Y subunit A-1-like 1.217534
3.3.1.2. Post-Translational Protein Modifications
Protein modifications such as (de)phosphorylation, sumoylation, and ubiquitination may affect
plant metabolism, growth, and development [33–35]. We identified DEGs during storage root growth
encoding proteins involved in post-translational modifications.
Several protein kinases were found to be differentially regulated during the development of
the carrot storage root. Upon comparison of expression profiles between the young plant andGenes 2018, 9, 431 15 of 20
the immature root, most of them were assigned to upregulated clusters cDEG.1.2.11 and cDEG.1.2.19.
Also, in the young plants versus the mature roots protein kinases were upregulated, most of them
clustering within cDEG.1.3.34. The co-expression of protein kinases and genes involved in the plant
development implies that they are important factors controlling the storage root formation.
We also identified a number of DEGs involved in protein ubiquitination. Most of them were
upregulated only in storage roots but silenced or not differentially expressed in the roots of wild carrots.
Among them, genes associated with CUL4-DDB1 ubiquitin E3-ligase complex formation were most
abundant in the cDEG datasets, while none of them were differentially expressed in the wild versus
cultivated comparisons (wcDEG datasets), indicating that they were developmentally regulated in
the roots of the cultivated carrot. They clustered within cDEG.1.2.11 and cDEG.1.2.19 and cDEG.1.3.18
and cDEG.1.3.34. Those clusters were mainly associated with root development, cell wall development,
phloem/xylem formation, and flowering time regulation. CUL4-DDB1 ubiquitin E3-ligase complex
regulates proteolysis of key proteins in transcription, replication, and DNA repair [36]. It has been
reported to be essential for plant development [37].
Sumoylation genes have been described as plant growth and drought stress regulators [38].
Differentially expressed SIZ1 genes in carrots were clustered within cDEG.1.2.11; cDEG.1.2.19;
and cDEG.1.3.18. These clusters were associated with root development and mitotic cell divisions.
3.3.1.3. Hormonal Signaling
Control of the plant development by hormones as main regulators has been widely studied.
Auxins, cytokinins, gibberellins, ethylene, abscisic acid, and brassinosteroids have been reported
as essential factors in both promotion and inhibition of plant growth in many species [39].
Differential expression of dozens of hormone-related genes during carrot storage root growth has
been previously reported by Wang et al. (2015), who showed that plant hormones regulate carrot root
growth in a stage-dependent manner [8]. We also identified several DEGs (e.g., abscisic acid receptor
PYL4-like—LOC108215964; auxin efflux carrier component 4-like—LOC108196170; auxin response
factor 18-like—LOC108223505; auxin transport protein BIG—LOC108213127; gibberellin-regulated
protein 6-like—LOC108210736; and GTP-binding protein BRASSINAZOLE INSENSITIVE PALE GREEN
2—LOC108227738) involved in hormonal signaling. These genes were differentially expressed only
in storage roots and not in wild carrot roots. While none of these genes showed drastically different
expression levels throughout the whole period of root development, two of them (LOC108223505 and
LOC108227738) were upregulated in cultivated roots, as compared with wild roots, at T2, the former one
still being up-regulated at T3 (Tables S23 and S24 in the Supplementary Materials). Possibly, alterations
of the hormonal control are important elements of the storage root growth regulation.
3.3.1.4. Redox Signaling
Redox regulation has been reported as a main factor (next to phytohormonal signaling) controlling
cell cycle, and plant growth and development [40], as well as biosynthesis of biological compounds
(e.g., carotenoids [41]). Redox regulation affects nearly every stage of plant and root development,
from breaking ABA-induced seed dormancy to the development of root meristem, lateral roots, and
root hairs [40]. Oxidoreductase activity was one of the most enriched GO terms among all DEGs
in the storage root. For example, only in cDEG.1.3.18 more than 20 genes were associated with
the oxido-reduction process. Generally, most of them were downregulated during the growth of
storage roots.
3.3.1.5. Regulation Complexity
As shown above, the regulation of the carrot storage root development involves several
interconnected mechanisms. TF activity can be regulated by plant hormones, sometimes the link
is quite straightforward (e.g., in the case of ethylene responsive transcription factors upregulated
in later stages). Also, mechanisms linking redox signaling and TF activity have been proposed [42].Genes 2018, 9, 431 16 of 20
Several DEG clusters can be pointed out, which are likely to comprise key regulatory genes, namely
cDEG.1.2.11, cDEG.1.2.19, and cDEG.1.2.27 (young plant vs. immature root) and cDEG.1.3.18,
cDEG.1.3.19, and cDEG.1.3.34 (young plant vs. mature root), which can be indicated as essential
to understand the storage root formation. They comprise most of the differentially expressed TFs and
genes involved in post-translational protein modifications together with genes directly responsible for
developmental processes.
3.3.2. DEGs Involved in the Carrot Storage Root Development
Plant growth and organ development is closely related to the regulation of the cell
cycle. Cyclins and cyclin-dependent kinases, controlled by hormones, (de)phosphorylation,
and ubiquitination followed by proteolysis are the main components of cell cycle governance [43,44].
Callose synthase is responsible for cell plate formation during cytokinesis [45], whereas microtubule
array genes (e.g., MAP-65) are involved in many key processes in plant cell morphogenesis, including
cell division and expansion [46]. We identified many genes associated with the cell cycle regulation
and mitosis in both wild and cultivated carrots, most of them being upregulated in developing storage
roots, in contrast to wild carrot roots. Clusters cDEG.1.2.11, cDEG.1.2.19, and cDEG.1.2.31 comprised
most of these genes in the comparison between young plants and developing roots, while clusters
cDEG.1.3.18 and cDEG.1.3.34 were enriched in this category when mature roots were compared to
young plants. Cell cycle-associated genes were mostly downregulated in mature roots, as compared
with developing roots (cDEG.2.3.12). Overall, it points to the importance of cell cycle regulation for the
secondary growth of carrot storage roots. Beside cell cycle control, the abovementioned clusters were
also associated with root and vascular strand development, cell wall biogenesis, and maintenance
of the vegetative phase. Moreover, their co-expression with transcription regulators, genes involved
in hormones signaling or ubiquitination, indicates multi-directional regulation and intricacy of
those processes.
Another feature differentiating cultivated roots from wild carrot is the ability to uptake and
store large amounts of water. Water uptake and flow through the plants roots is mainly regulated by
aquaporins—proteins forming water-selective channels—facilitating water flow across membranes [47].
Differential expression of aquaporin encoding genes between wild and cultivated carrots has
been previously reported by Rong et al. (2014) [7]. Aquaporin genes were upregulated in all
comparisons (cDEG.1.2, cDEG.1.3, and cDEG.2.3) but not differentially expressed in wild carrot
roots. Moreover, gene encoding aquaporin TIP2-2 (LOC108206639) was one of the highly upregulated
genes during the storage root development (FCh >10 in cDEG.2.3). It was also revealed as differentially
expressed in the direct comparison between the wild and the cultivated plants in the mature roots
(wcDEG.3, Table S24 in the Supplementary Materials). Our results support the hypothesis proposed by
Rong et al. (2014) that transcriptional regulation of aquaporin genes was under selection upon carrot
domestication [7]. Besides aquaporins, we also identified another DEG (epidermis-specific secreted
glycoprotein EP1—LOC108223777) previously reported as linked to water transport in carrots [48],
highly expressed in the developing storage root as related to the young plant (cDEG.1.2, Table S14 in
the Supplementary Materials), but also upregulated in immature storage roots, as compared to wild
roots (wcDEG.2, Table S23 in the Supplementary Materials).
In the developing carrot storage root, sucrose is the major transport and storage sugar, but it is
partially converted into starch [49,50]. Starch synthesis probably maximizes sugar gradient to enhance
sink activity. During root growth and after harvest, starch and sugar concentration fluctuate, not only
due to starch synthesis but also degradation [50]. In this work we identified DEGs associated with
both sugars and starch metabolism. The great majority of them were upregulated in carrot storage
roots but not in wild roots, indicating that carbohydrate accumulation and metabolism differentiate
the two types. DEGs associated with carbohydrate metabolism were assigned to multiple clusters.
Carbohydrates may also play a role in other biological processes (e.g., signal transduction [51]).Genes 2018, 9, 431 17 of 20
One of the key features of cultivated carrots is their ability to accumulate large amounts
of carotenoids in roots. We found that two constitutive genes from the carotenoid pathway
(i.e., PSY2 and LCYE) were downregulated in mature roots of the cultivated carrot (cDEG.2.3).
This is in line with observations that carotenoids are mostly produced in developing storage
roots. Other chloroplast genes associated with photosynthesis were co-expressed with these
carotenoid genes (e.g., 28 kDa ribonucleoprotein, chloroplastic—LOC108202773; chlorophyll a-b binding
protein—LOC108210794; photosystem I reaction center subunit psaK—LOC108209242; photosystem
II reaction center PSB28 protein—LOC108204268; ribulose bisphosphate carboxylase small chain
1B—LOC108208532; and thylakoid lumenal 29 kDa protein—LOC108219534). Generally, genes encoding
proteins involved in photosynthesis were differentially expressed and highly enriched during storage
root development. Moreover, three of the abovementioned genes (LOC108202773, LOC108208532,
and LOC108219534) were expressed in developing storage roots but repressed in developing wild
carrot roots (wcDEG.2, Table S23 in the Supplementary Materials). Enhanced expression of genes
encoding proteins of photosystem II (LHC-II), in the cultivated carrot roots has been previously
reported [7,52]. The authors suggested that the high expression of LHC-II genes might be related
to carotenoid accumulation. Recently, this hypothesis was supported and extended by Iorizzo et al.
(2016) [9]. They found that genes involved in the assembly and function of photosystems I and II and
in plastid development were co-expressed with isoprenoid pathway genes (responsible for carotenoid
biosynthesis) in the orange-rooted carrot. They hypothesized that loss of the cross-talk repression
mechanism between the carotenoid biosynthesis pathway and the photosystems in the root tissue
conditioned by inactivation of the Y gene induced a constitutive activation of the metabolic cascade
leading to carotenoid accumulation [9]. Our results clearly corroborate that hypothesis.
4. Conclusions
Using transcriptomics evidence, we provided an in-depth view into the complexity of processes
leading to the formation of the carrot storage root. Several interconnected regulatory and signaling
mechanisms are likely involved in the storage root development. A range of differentially regulated
genes encoding transcription factors and proteins involved in post-translational protein modifications
have been revealed. In contrast, genes encoding proteins involved in redox signaling were largely
downregulated in cultivated carrot roots, as opposed to wild carrots. Genes encoding components
of photosystems I and II and those required for carotenoid biosynthesis were downregulated only in
mature roots of cultivated carrots. Genes associated with cell cycle regulation were upregulated in
the roots of cultivated carrot and co-expressed with genes involved in vascular strand development,
likely playing a key role in the dynamics of the secondary root growth. Aquaporins were highly
upregulated in all stages of carrot storage root development, possibly facilitating water uptake, but also
transport of signaling molecules. The upregulation of genes encoding proteins involved in sugar
metabolism was another hallmark feature of the cultivated carrot storage root. The reported results
provide directions for future investigations on the regulation of storage root formation in carrots and
possibly can be extended to other root crops from the Apiaceae family.
Supplementary Materials: The Supplementary Material for this article can be found online at http://www.
mdpi.com/2073-4425/9/9/431/s1, including the following: Figure S1: Venn diagrams representing numbers of
DEGs identified with three different algorithms for the wild D. carota subsp. commutatus; Figure S2: Venn diagrams
representing numbers of DEGs identified with three different algorithms for the cultivated D. carota subsp. sativus
2874B; Figure S3: Venn diagrams representing numbers of DEGs identified with three different algorithms for
the comparison between the wild D. carota subsp. commutatus and the cultivated D. carota subsp. sativus 2874B,
and Tables S1–S26. The RNAseq datasets generated for this study can be found in the GenBank Short Read Archive
acc. no. SRP155333.
Author Contributions: Conceptualization, M.I. and D.G.; Data curation, G.M.; Formal analysis, A.M.-P., M.I.,
and D.G.; Funding acquisition, D.G.; Investigation, G.M., H.B., A.M.-P., M.I., and D.G.; Methodology, G.M., H.B.,
and D.G.; Project administration, D.G.; Resources, G.M.; Software, G.M., H.B., and A.M.-P.; Supervision, M.I. and D.G.;
Validation, H.B. and A.M.-P.; Visualization, G.M. and H.B.; Writing of original draft, G.M., H.B., and D.G.Genes 2018, 9, 431 18 of 20
Funding: This research was funded by the Polish National Science Center, project no. 2012/05/B/NZ9/03401,
and the statutory funds for science granted by the Polish Ministry of Science and Higher Education to the Faculty
of Biotechnology and Horticulture, University of Agriculture in Krakow. M.I. was supported by the United States
Department of Agriculture National Institute of Food and Agriculture, Hatch project 1008691.
Acknowledgments: We thank Izabela Makałowska, Joanna Ciomborowska-Basheer, and Michał Kabza
(ideas4biology, Poznań, Poland) for their support in bioinformatics. We thank Thomas Nothnagel
from Julius-Kuehn Institut, Quedlinburg, Germany, for providing seeds of D. carota subsp. commutatus
(acc. no. JKI-W232/07) and Urszula Pienia˛żek for her assistance with the cultivation of plants in the greenhouse.
Conflicts of Interest: The authors declare no conflicts of interest.
References
1. FAOSTAT. The Statistics Division of FAO. Available online: http://faostat3.fao.org/ (accessed on 18 April 2018).
2. Simon, P.W. Plant breeding for human nutritional quality. Plant Breed. Rev. 2009, 31, 325–392.
3. Iorizzo, M.; Senalik, D.A.; Ellison, S.L.; Grzebelus, D.; Cavagnaro, P.F.; Allender, C.; Brunet, J.; Spooner, D.M.;
Van Deynze, A.; Simon, P.W. Genetic structure and domestication of carrot (Daucus carota subsp. sativus)
(Apiaceae) 1. Am. J. Bot. 2013, 100, 930–938. [CrossRef] [PubMed]
4. Banga, O. Origin and distribution of the western cultivated carrot. Genet. Agrar. 1963, 17, 357–370.
5. Stolarczyk, J.; Janick, J. Carrot: History and Iconography. Chron. Horticult. 2011, 51, 12–18.
6. Macko-Podgórni, A.; Machaj, G.; Stelmach, K.; Senalik, D.; Grzebelus, E.; Iorizzo, M.; Simon, P.W.; Grzebelus, D.;
Macko-Podgorni, A.; Machaj, G.; et al. Characterization of a genomic region under selection in cultivated carrot
(Daucus carota subsp. sativus) reveals a candidate domestication gene. Front. Plant Sci. 2017, 8, 1–13. [CrossRef]
7. Rong, J.; Lammers, Y.; Strasburg, J.L.; Schidlo, N.S.; Ariyurek, Y.; de Jong, T.J.; Klinkhamer, P.G.L.;
Smulders, M.J.M.; Vrieling, K. New insights into domestication of carrot from root transcriptome analyses.
BMC Genom. 2014, 15, 895. [CrossRef] [PubMed]
8. Wang, G.-L.L.; Jia, X.-L.L.; Xu, Z.-S.S.; Wang, F.; Xiong, A.-S.S. Sequencing, assembly, annotation, and
gene expression: Novel insights into the hormonal control of carrot root development revealed by a
high-throughput transcriptome. Mol. Genet. Genom. 2015, 290, 1379–1391. [CrossRef] [PubMed]
9. Iorizzo, M.; Ellison, S.; Senalik, D.; Zeng, P.; Satapoomin, P.; Huang, J.; Bowman, M.; Iovene, M.; Sanseverino, W.;
Cavagnaro, P.; et al. A high-quality carrot genome assembly provides new insights into carotenoid accumulation
and asterid genome evolution. Nat. Genet. 2016, 48, 657–666. [CrossRef] [PubMed]
10. Bolger, A.M.; Lohse, M.; Usadel, B. Trimmomatic: A flexible trimmer for Illumina sequence data.
Bioinformatics 2014, 30, 2114–2120. [CrossRef] [PubMed]
11. Langmead, B.; Salzberg, S.L. Fast gapped-read alignment with Bowtie 2. Nat. Methods 2012, 9, 357–359.
[CrossRef] [PubMed]
12. Dobin, A.; Davis, C.A.; Schlesinger, F.; Drenkow, J.; Zaleski, C.; Jha, S.; Batut, P.; Chaisson, M.; Gingeras, T.R.
STAR: Ultrafast universal RNA-seq aligner. Bioinformatics 2013, 29, 15–21. [CrossRef] [PubMed]
13. Pertea, M.; Pertea, G.M.; Antonescu, C.M.; Chang, T.-C.; Mendell, J.T.; Salzberg, S.L. StringTie enables
improved reconstruction of a transcriptome from RNA-seq reads. Nat. Biotechnol. 2015, 33, 290–295.
[CrossRef] [PubMed]
14. Trapnell, C.; Williams, B.A.; Pertea, G.; Mortazavi, A.; Kwan, G.; van Baren, M.J.; Salzberg, S.L.; Wold, B.J.; Pachter, L.
Transcript assembly and quantification by RNA-Seq reveals unannotated transcripts and isoform switching during
cell differentiation. Nat. Biotechnol. 2010, 28, 511–515. [CrossRef] [PubMed]
15. Haas, B.J.; Papanicolaou, A.; Yassour, M.; Grabherr, M.; Blood, P.D.; Bowden, J.; Couger, M.B.; Eccles, D.;
Li, B.; Lieber, M.; et al. De novo transcript sequence reconstruction from RNA-seq using the Trinity platform
for reference generation and analysis. Nat. Protoc. 2013, 8, 1494–1512. [CrossRef] [PubMed]
16. Bray, N.L.; Pimentel, H.; Melsted, P.; Pachter, L. Near-optimal probabilistic RNA-seq quantification.
Nat. Biotechnol. 2016, 34, 525–527. [CrossRef] [PubMed]
17. Love, M.I.; Huber, W.; Anders, S.; Lönnstedt, I.; Speed, T.; Robinson, M.; Smyth, G.; McCarthy, D.; Chen, Y.;
Smyth, G.; et al. Moderated estimation of fold change and dispersion for RNA-seq data with DESeq2.
Genome Biol. 2014, 15, 550. [CrossRef] [PubMed]
18. Leng, N.; Dawson, J.; Kendziorski, C. EBSeq: An R Package for Differential Expression Analysis Using
RNA-seq Data. 2018. Available online: http://www.bioconductor.org/packages/release/bioc/vignettes/
EBSeq/inst/doc/EBSeq_Vignette.pdf (accessed on 16 April 2018).Genes 2018, 9, 431 19 of 20
19. Robinson, M.D.; McCarthy, D.J.; Smyth, G.K. edgeR: A Bioconductor package for differential expression
analysis of digital gene expression data. Bioinformatics 2010, 26, 139–140. [CrossRef] [PubMed]
20. MacQueen, J.B. Some Methods for classification and Analysis of Multivariate Observations. In Proceedings
of the 5th Berkeley Symposium on Mathematical Statistics and Probability, Berkeley, CA, USA, 21 June–18
July 1965 and 27 December 1965–7 January 1966; University of California Press: Berkeley, CA, USA, 1967.
21. Lloyd, S.P. Least Squares Quantization in PCM. IEEE Trans. Inf. Theory 1982. [CrossRef]
22. Tao, X.; Gu, Y.-H.; Wang, H.-Y.; Zheng, W.; Li, X.; Zhao, C.-W.; Zhang, Y.-Z. Digital Gene Expression Analysis
Based on Integrated De Novo Transcriptome Assembly of Sweet Potato [Ipomoea batatas (L.) Lam.]. PLoS ONE 2012,
7, e36234. [CrossRef] [PubMed]
23. Wang, S.; Wang, X.; He, Q.; Liu, X.; Xu, W.; Li, L.; Gao, J.; Wang, F. Transcriptome analysis of the roots at
early and late seedling stages using Illumina paired-end sequencing and development of EST-SSR markers
in radish. Plant Cell Rep. 2012, 31, 1437–1447. [CrossRef] [PubMed]
24. Iorizzo, M.; Senalik, D.A.; Grzebelus, D.; Bowman, M.; Cavagnaro, P.F.; Matvienko, M.; Ashrafi, H.; Van
Deynze, A.; Simon, P.W. De novo assembly and characterization of the carrot transcriptome reveals novel
genes, new markers, and genetic diversity. BMC Genom. 2011, 12, 389. [CrossRef] [PubMed]
25. Ohashi-Ito, K.; Bergmann, D.C. Regulation of the Arabidopsis root vascular initial population by
LONESOME HIGHWAY. Development 2007, 134, 2959–2968. [CrossRef] [PubMed]
26. Sorin, C.; Declerck, M.; Christ, A.; Blein, T.; Ma, L.; Lelandais-Brière, C.; Njo, M.F.; Beeckman, T.; Crespi, M.;
Hartmann, C. A miR169 isoform regulates specific NF-YA targets and root architecture in Arabidopsis.
New Phytol. 2014, 202, 1197–1211. [CrossRef] [PubMed]
27. Li, X.; Qin, G.; Chen, Z.; Gu, H.; Qu, L.J. A gain-of-function mutation of transcriptional factor PTL results in
curly leaves, dwarfism and male sterility by affecting auxin homeostasis. Plant Mol. Biol. 2008, 66, 315–327.
[CrossRef] [PubMed]
28. Bernhardt, C. The bHLH genes GLABRA3 (GL3) and ENHANCER OF GLABRA3 (EGL3) specify epidermal
cell fate in the Arabidopsis root. Development 2003, 130, 6431–6439. [CrossRef] [PubMed]
29. Zhao, J.; Favero, D.S.; Peng, H.; Neff, M.M. Arabidopsis thaliana AHL family modulates hypocotyl growth
redundantly by interacting with each other via the PPC/DUF296 domain. Proc. Natl. Acad. Sci. USA 2013,
110, E4688–E4697. [CrossRef] [PubMed]
30. Lu, H.; Zou, Y.; Feng, N. Overexpression of AHL20 negatively regulates defenses in Arabidopsis. J. Integr.
Plant Biol. 2010, 52, 801–808. [CrossRef] [PubMed]
31. Yun, J.; Kim, Y.-S.S.; Jung, J.-H.H.; Seo, P.J.; Park, C.-M.M. The AT-hook motif-containing protein AHL22
regulates flowering initiation by modifying FLOWERING LOCUS T chromatin in Arabidopsis. J. Biol. Chem. 2012,
287, 15307–15316. [CrossRef] [PubMed]
32. Grzebelus, D.; Iorizzo, M.; Senalik, D.; Ellison, S.; Cavagnaro, P.; Macko-Podgorni, A.; Heller-Uszynska, K.;
Kilian, A.; Nothnagel, T.; Allender, C.; et al. Diversity, genetic mapping, and signatures of domestication in the
carrot (Daucus carota L.) genome, as revealed by Diversity Arrays Technology (DArT) markers. Mol. Breed. 2014,
33, 625–637. [CrossRef] [PubMed]
33. Hellmann, H. Plant Development: Regulation by Protein Degradation. Science 2002, 297, 793–797. [CrossRef]
[PubMed]
34. Moon, J.; Parry, G.; Estelle, M. The ubiquitin-proteasome pathway and plant development. Plant Cell 2004,
16, 3181–3195. [CrossRef] [PubMed]
35. Friso, G.; van Wijk, K.J. Update: Post-translational protein modifications in plant metabolism. Plant Physiol. 2015,
169, 1469–1487. [CrossRef] [PubMed]
36. Iovine, B.; Iannella, M.L.; Bevilacqua, M.A. Damage-specific DNA binding protein 1 (DDB1): A protein with
a wide range of functions. Int. J. Biochem. Cell Biol. 2011, 43, 1664–1667. [CrossRef] [PubMed]
37. Zhang, Y.; Feng, S.; Chen, F.; Chen, H.; Wang, J.; McCall, C.; Xiong, Y.; Deng, X.W. Arabidopsis DDB1-CUL4
ASSOCIATED FACTOR1 forms a nuclear E3 ubiquitin ligase with DDB1 and CUL4 that is involved in
multiple plant developmental processes. Plant Cell 2008, 20, 1437–1455. [CrossRef] [PubMed]
38. Catala, R.; Ouyang, J.; Abreu, I.A.; Hu, Y.; Seo, H.; Zhang, X.; Chua, N.-H. The Arabidopsis E3 SUMO Ligase
SIZ1 Regulates Plant Growth and Drought Responses. Plant Cell 2007, 19, 2952–2966. [CrossRef] [PubMed]
39. Durbak, A.; Yao, H.; McSteen, P. Hormone signaling in plant development. Curr. Opin. Plant Biol. 2012, 15, 92–96.
[CrossRef] [PubMed]You can also read