Hyperspectral image processing for the identification and quantification of lentiviral particles in fluid samples
←
→
Page content transcription
If your browser does not render page correctly, please read the page content below

www.nature.com/scientificreports
OPEN Hyperspectral image
processing for the identification
and quantification of lentiviral
particles in fluid samples
Emilio Gomez‑Gonzalez1,2*, Beatriz Fernandez‑Muñoz3, Alejandro Barriga‑Rivera1,4,
Jose Manuel Navas‑Garcia5, Isabel Fernandez‑Lizaranzu1,2,
Francisco Javier Munoz‑Gonzalez1, Ruben Parrilla‑Giraldez6, Desiree Requena‑Lancharro1,
Manuel Guerrero‑Claro1, Pedro Gil‑Gamboa1, Cristina Rosell‑Valle2,3,
Carmen Gomez‑Gonzalez7, Maria Jose Mayorga‑Buiza2,8, Maria Martin‑Lopez2,3,
Olga Muñoz9, Juan Carlos Gomez Martin9, Maria Isabel Relimpio Lopez10,11,
Jesus Aceituno‑Castro9,12, Manuel A. Perales‑Esteve13, Antonio Puppo‑Moreno7,
Francisco Jose Garcia Cozar14, Lucia Olvera‑Collantes15, Silvia de los Santos‑Trigo16,
Emilia Gomez17, Rosario Sanchez Pernaute3, Javier Padillo‑Ruiz2,18 &
Javier Marquez‑Rivas2,19,20
Optical spectroscopic techniques have been commonly used to detect the presence of biofilm-forming
pathogens (bacteria and fungi) in the agro-food industry. Recently, near-infrared (NIR) spectroscopy
revealed that it is also possible to detect the presence of viruses in animal and vegetal tissues. Here we
report a platform based on visible and NIR (VNIR) hyperspectral imaging for non-contact, reagent free
detection and quantification of laboratory-engineered viral particles in fluid samples (liquid droplets
and dry residue) using both partial least square-discriminant analysis and artificial feed-forward neural
networks. The detection was successfully achieved in preparations of phosphate buffered solution and
artificial saliva, with an equivalent pixel volume of 4 nL and lowest concentration of 800 TU·µL−1. This
method constitutes an innovative approach that could be potentially used at point of care for rapid
mass screening of viral infectious diseases and monitoring of the SARS-CoV-2 pandemic.
A variety of spectroscopic methods have been used in many applications that range from the agro-food industry1
to biological sciences2, medical applications3–5, and the pharmacological industry6 among others. In particular,
the use of near-infrared (NIR) spectroscopy has been reported for the detection of microorganisms in differ-
ent media. For example, Yao-Zen and co-workers7 studied the use of NIR hyperspectral imaging to detect, in
1
Department of Applied Physics III, School of Engineering, Universidad de Sevilla, Camino de los Descubrimientos
s/n, 41092 Sevilla, Spain. 2Institute of Biomedicine of Seville, 41013 Sevilla, Spain. 3Unidad de Producción y
Reprogramación Celular (UPRC), Red Andaluza de Diseño y Traslación de Terapias Avanzadas, 41092 Sevilla,
Spain. 4School of Biomedical Engineering, The University of Sydney, Sydney, NSW 2006, Australia. 5EOD‑CBRN
Group, Spanish National Police, 41011 Sevilla, Spain. 6Technology and Innovation Centre, Universidad de
Sevilla, 41012 Sevilla, Spain. 7Service of Intensive Care, University Hospital ‘Virgen del Rocio’, 41013 Sevilla,
Spain. 8Service of Anaesthesiology, University Hospital ‘Virgen del Rocio’, 41013 Sevilla, Spain. 9Instituto de
Astrofísica de Andalucía, CSIC, 18008 Granada, Spain. 10Department of Ophthalmology, University Hospital
‘Virgen Macarena’, 41009 Sevilla, Spain. 11OftaRed, Institute of Health ‘Carlos III’, 28029 Madrid, Spain. 12Centro
Astronomico Hispano Alemán, 04550 Almeria, Spain. 13Department of Electronic Engineering, School of
Engineering, Universidad de Sevilla, 41092 Sevilla, Spain. 14Department of Biomedicine, Biotechnology and Public
Health, University of Cadiz, 11003 Cadiz, Spain. 15Instituto de Investigación E Innovación Biomedica de Cádiz
(INIBICA), 11009 Cadiz, Spain. 16Corporación Tecnológica de Andalucía, 41092 Sevilla, Spain. 17Joint Research
Centre, European Commission, 41092 Sevilla, Spain. 18Department of General Surgery, University Hospital ‘Virgen
del Rocío’, 41013 Sevilla, Spain. 19Service of Neurosurgery, University Hospital ‘Virgen del Rocío’, 41013 Sevilla,
Spain. 20Centre for Advanced Neurology, 41013 Sevilla, Spain. *email: egomez@us.es
Scientific Reports | (2021) 11:16201 | https://doi.org/10.1038/s41598-021-95756-3 1
Vol.:(0123456789)
www.nature.com/scientificreports/
Figure 1. Block diagram of proposed processing platform for classification (positive or negative) of fluid
samples with lentiviral particles and quantification of their viral load. Fluid samples are deposited on a
supporting plate and imaged (as liquid droplets and dry residues) in the visible and near-infrared ranges using
a hyperspectral camera. Optical diffuse reflectance spectra are obtained and processed from individual pixels
and averaged. Spectral (wavelength) fringes of interest are determined for the calculation of 29 morphological
descriptors of features of individual spectra (F1–F28) and the area ratio (AR) with respect to the spectrum of
the background. Two independent classifiers are constructed and evaluated –using the same training and test
sample groups– at the pixel and sample (droplet) levels: a partial least square discriminant analysis (PLS-DA)
of individual and droplet-averaged spectra and an artificial feed-forward neural network (FFNN) built on the
values of the descriptors of features of individual spectra.
chicken fillets, the presence of Enterobacteriaceae, a large family of gram-negative bacteria able to cause important
diseases. Similarly, Siripatrawan et al.8 reported the detection of Escherichia coli in packaged spinach. For this
purpose, the authors implemented an artificial neural network (ANN) to successfully predict food contamina-
tion. While there is vast evidence that hyperspectral imaging can be used to detect relatively large microorgan-
isms such as bacteria or f ungi9, it is not clear whether these optical techniques can be successfully applied for
the detection of viral particles. First, bacteria and fungi are approximately two orders of magnitude larger than
viruses and tend to form colonies. Secondly, the size of viral particles typically lies slightly below the lower limit
of optical wavelengths (< 400 nm). Despite the apparent limitations that may exist for the detection of viruses
using optical spectroscopic imaging techniques, there are few studies that suggest its v iability10–13. However, it is
not clear whether these studies detected the presence of the virus or its effects on the tissues of the hosts, as the
damage and tissue alterations caused during an on-going infection may appear more prominent than the virus
itself at the working wavelengths.
Here, we pursued to understand whether visible and NIR (VNIR) hyperspectral imaging can be exploited
to determine the presence of viral particles in a fluid suspension as well as on a surface upon complete evapo-
ration of its water content. We analysed the diffuse optical reflectance spectra obtained from preparations of
lentiviral particles pseudotyped with the glycoprotein G of the vesicular stomatitis virus (VSV) using three
different approaches: classification (positive/negative) by partial least square-discriminant analysis (PLS-DA)
and a feed-forward neural network (FFNN), and quantification of viral load by analysis of averaged spectra,
as summarized in Fig. 1. The viral model under examination has been used to investigate a number of human
diseases14 including the severe acute respiratory syndrome coronavirus 2 (SARS-CoV-2)15, as it provides a safer
alternative while lowering biosafety requirements in the laboratory. The system engineered here was able to not
only detect the lentiviral particles but also to predict the viral load of the sample. This approach can be used for
rapid and mass screening of infectious diseases, as it allows for analysing large number of samples simultane-
ously in a matter of seconds.
Results
VNIR hyperspectral images were taken immediately after placing the samples (liquid droplets) on a supporting
plate and after complete dry-up (dry residue). The diffuse optical reflectance spectra, converted to pseudo-
absorbance (PA), were analysed following a pixel-based approach and integrated afterwards to obtain a per-
droplet classification. They corresponded to 164 preparations (with an individual volume of 5 µL) in two fluids:
74 samples prepared in phosphate buffered solution (PBS) and 90 in artificial saliva (AS). The numbers of pixels
from samples in PBS were: 74,626 from wet droplets and 80,212 from dry residues. The numbers of pixels from
samples in AS were: 92,657 from wet droplets and 94,425 from dry residues. For each fluid, the classification
methods used here were trained and evaluated using the same fixed sample sets.
Scientific Reports | (2021) 11:16201 | https://doi.org/10.1038/s41598-021-95756-3 2
Vol:.(1234567890)
www.nature.com/scientificreports/

                                  Figure 2.  Pseudo-absorbance spectra. (a,b) mean pseudo-absorbance spectra obtained from lentiviral particles
                                  resuspended in PBS (LP-PBS) or artificial saliva (LP-AS), and their respective negative controls (PBS-control
                                  and AS-control). (c,d) overall pseudo-absorbance spectra upon complete evaporation of the aqueous content.
                                  The concentration in (a–d) was 4000 TU∙µL−1. The shadowed area highlights the wavelength range in which
                                  shape features were more informative for the FFNN analysis. (e) PLS-DA three-dimensional score plot of
                                  LP-PBS vs. PBS-control (three latent variables and captured variances: V1 = 0.70, V2 = 0.12, V3 = 0.03). (f)
                                  PLS-DA three-dimensional score plot of AS-PBS vs. AS-control (three latent variables and captured variances:
                                  V1 = 0.75, V2 = 0.10, V3 = 0.02).

                                  Pseudo‑absorbance spectra. The first step in understanding whether or not the spectra in the VNIR
                                  range could discriminate samples with viral particles from their negative controls was to obtain the overall PA
                                  spectra of the pixels from 5-µL droplets. This volume was chosen sufficiently small to resemble relatively large
                                  respiratory droplets, and big enough to prevent rapid evaporation. The average number of pixels per droplet
                                  was approximately 1800 pixels. Pixels corresponding to image irregularities (e.g. reflection bright spots) were
                                  manually segmented, and the overall number of pixels per droplet reduced to roughly 1200, what represents
                                  two thirds of the total imaged surface of each sample. When placed on the supporting plate, the diameter of the
                                  droplet was approximately 2 mm; thus, assuming a 2-mm-in-diameter disc model, each pixel would represent a
                                  volume of 4 nL approximately, the volume of an infectious aerosol as reported for SARS-CoV-216. However, the
                                  information embedded within the spectrum of a given pixel does not only arise from that particular volume but
                                  also from neighbouring sites, as the contribution of sub-surface scattering plays a predominant role in providing
                                  differential information. We appreciated relevant differences in the spectral signatures between samples with
                                  lentiviral particles and their negative controls, both in PBS and AS preparations, as shown in Fig. 2a,b. Although
                                  less prominent, there were also differences in the spectra of their corresponding dry residues (Fig. 2c,d). This
                                  suggests that the spectral signatures carry relevant information about the viral content of the samples. However,
                                  the overlapping spectral signatures of the media and the targeted viral particles possess a high variability that
                                  requires multivariate analysis. Thus, to reduce the complexity of the information contained within the PA spec-
                                  tra, a PLS-DA model was built as described in the Methodology. This allowed to enhance the spectral differences
                                  as illustrated in the examples shown in Fig. 2e,f.

Scientific Reports |   (2021) 11:16201 |               https://doi.org/10.1038/s41598-021-95756-3                                                 3

                                                                                                                                             Vol.:(0123456789)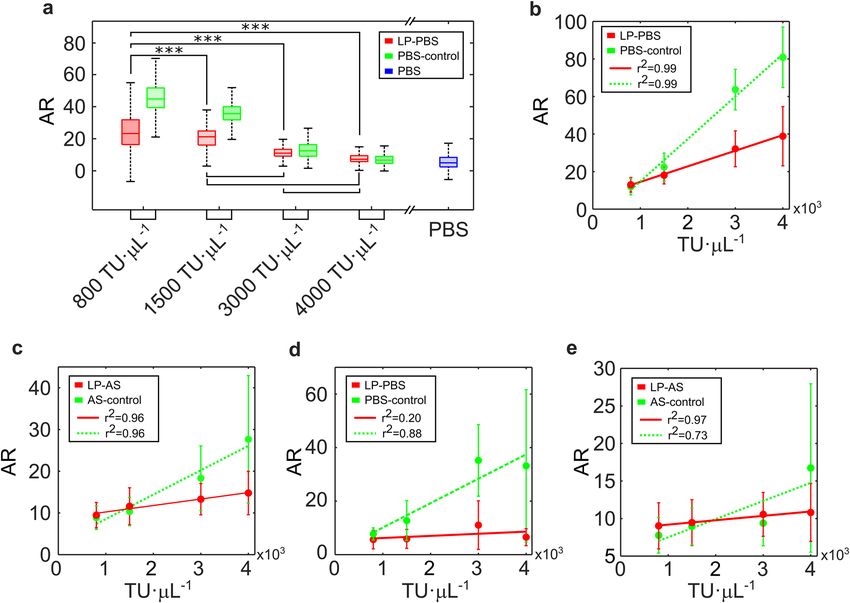
www.nature.com/scientificreports/
Classification using PLS‑DA. PLS-DA models included between 16 and 20 latent variables and retained
from 95.20% up to 96.27% of data variance. The output of the PLS-DA was used for pixel classification. The
Wilcoxon rank-sum test performed on these outputs revealed significant statistical differences between sam-
ples containing lentiviral particles and their non-transfected equivalent preparations (p-value = 0), as shown in
Fig. 3a. The interquartile range overlap was more pronounced in dry residues. Nevertheless, the classifier per-
formed better than a random classifier in all cases at pixel level, as illustrated in the receiver operating character-
istic (ROC) curves shown in Fig. 3b-e. Note that a ROC curve below the diagonal line, as in Fig. 3e, represents a
classifier model with an inverted output. An example of the resulting pixel classification in each case is illustrated
in Fig. 3f-i. Next, to determine whether or not a droplet was taken from a sample containing viral particles, a
new threshold was determined as the percentage of positive pixels within a given droplet. The ROC curves in
Fig. 3j-m show an important improvement in the performance of the classifier when operating at droplet level
(i.e., considering all individual pixels that constitute a given droplet), as information was gathered based on
multiple observations.
The area under the ROC (AUROC), a performance metric typically used to evaluate a classifier, showed
excellent accuracy in PBS preparations, both in wet droplets and dry residue (AUROC = 0.90). The accuracy
of the prediction dropped importantly for samples prepared in AS. Further information on the classification
performance can be found in Table 1.
FFNN classification. In order to extract the embedded information that enables detection of the viral pres-
ence, a set of 28 spectral shape descriptors was calculated in seven spectral bands of interest and fed into the
FFNN, whose output took values between 0 and 1 in the same fashion as in the PLS-DA. Similarly, the Wilcoxon
rank-sum test showed strong differences among the outputs of the FFNN classification obtained from prepara-
tions containing lentiviral particles and the negative controls used here, as illustrated in Fig. 4a. These differences
were also observed in their dry residues (Fig. 4b). ROC curves were constructed to determine the classification
thresholds, as shown in Fig. 4c-f. An example of the resulting classification of the pixels within the same droplet
is shown in Fig. 4g-j.
As in the PLS-DA, a per-droplet classification was obtained by requiring a certain percentage of individual
positive pixels to consider the sample as positive. Again, the droplet classification threshold was determined
following the criteria previously described, as illustrated in Fig. 4k-n. As with the PLS-DA models, this integra-
tion of information from individual pixels to droplet level improved drastically the performance of the FFNN
classifiers, even to 100% accuracy.
The goodness of the classification method was also assessed by computing the AUROC, which remained above
0.5 in all cases, as shown in Table 2. The sensitivity (SE) and specificity (SP) per-droplet showed similar values
for preparations in PBS (SE = 100%, SP = 100%) and AS (SE = 93.3%, SP = 100%), and were substantially higher
than those obtained from the PLS-DA. Regarding the analysis of the dry residues, the accuracy of the FFNN
algorithm showed similar performance for PBS and AS, above a random classifier at pixel level, and substantially
higher at droplet level (AUROC = 0.88 for PBS and AUROC = 0.67 for AS).
Prediction of the viral load. We observed that some spectral feature descriptors could shed light about
the viral load of the sample under study. In particular, the value of the area ratio (AR) descriptor (defined as the
ratio between the area under the spectral curve of the sample and the area under the curve of the spectrum of the
supporting plate, see supplementary material) showed statistically significant differences (Wilcoxon rank-sum
test, p-value = 0) when evaluated at different concentrations, as illustrated in Fig. 5a. In all cases, significant dif-
ferences (p-value = 0) were obtained between samples containing lentiviral particles and their negative controls
prepared in equal concentrations. Furthermore, a very strong linear correlation was found between the value
of the said descriptor and the viral load in fresh preparations in PBS (r2 = 0.99) and in AS (r2 = 0.96). A high
correlation was also found in dry residues of AS preparations (r2 = 0.88), as illustrated in Fig. 5b-c,e. This linear
relationship could not be established for dry residues from PBS preparations (r2 = 0.20), as shown in Fig. 5d.
These results suggest that it is possible to quantify the viral load of fresh samples by computing key morpho-
logical descriptors in certain spectral fringes. Note here that the lowest concentration included in this analysis
was 800 TU·µL−1. Assuming that approximately 0.1% of the virus particles that are present in the preparations
are infectious17, this minimum viral load, expressed in -physical units- (copies·mL−1), would be equivalent to
8·108 copies·mL−1. Within the wide range of viral loads of SARS-CoV-2 patients, this value corresponds to the
small percentage of the so-called ‘supercarrier’ individuals, potential ‘superspreaders’ of the d isease18.
Discussion
Hyperspectral imaging techniques have been extensively used to rapidly identify pathogens forming biofilms
on food products19 or to prevent the spread of plant diseases20 to name a few. Here we have demonstrated it is
also possible to detect the presence of a virus, in this case a lab-engineered lentiviral particle, in a fluid using
hyperspectral image processing techniques in the VNIR range. Although there have been successful attempts to
osquitoes11 or plant s eeds10 using similar methods, the previous results are limited to
identify viral infections in m
the analysis of ongoing infections in tissues, where histological changes or the effects of the host immune response
may represent the prevalent source of information to discriminate the presence of the virus. Nonetheless, we
have been able to successfully detect viral particles alone in two different media, achieving a sensitivity and a
specificity in liquid droplets comparable to those reported from molecular techniques (SE = 100%, SP = 100% in
PBS, SE = 93.3%, SP = 100% in AS). At present, the gold standard for the detection of a virus is the polymerase
chain reactions (PCR) test. However, with the advent of the global pandemic caused by the SARS-CoV-2 virus, a
number of new molecular-based diagnostic technologies have emerged21,22, allowing for a substantial reduction of
Scientific Reports | (2021) 11:16201 | https://doi.org/10.1038/s41598-021-95756-3 4
Vol:.(1234567890)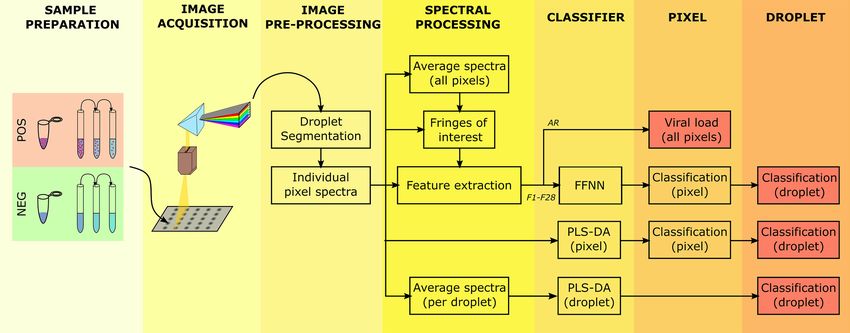
www.nature.com/scientificreports/

                                  Figure 3.  Classification of VSV-G pseudotyped lentiviral particles using PLS-DA. (a) median value of the
                                  PLS-DA output used for pixel classification for wet and dry samples prepared in phosphate buffer solution
                                  (PBS) and artificial saliva (AS). The boxes represent the interquartile range, and the whiskers show 2.7 times the
                                  standard deviation. Lentiviral particles (LP), denoted here in red, were prepared in PBS (LP-PBS) or in artificial
                                  saliva (LP-AS). Negative controls, represented here in green, were prepared from non-transfected culture
                                  media in PBS (PBS-control) or in artificial saliva (AS-control). ***p-value < 0.0001 from two-tailed Wilcoxon
                                  rank-sum test. (b) ROC curve obtained from the pixel classification of LP-PBS. (c) ROC curve from the pixel
                                  classification of LP-PBS obtained after complete evaporation of the water content. (d) ROC curve obtained from
                                  the pixel classification of LP-AS. (e) ROC curve from the pixel classification of LP-AS obtained after complete
                                  evaporation of the water content. (f–i) example of a pixel classification in a droplet. Red and green pixels denote
                                  pixels classified as positive and negative respectively. Note red and green backgrounds indicate positive droplet
                                  and its negative control respectively. (f) LP-PBS. (g) LP-PBS dry residue. (h) LP-AS. (i) LP-AS dry residue. (j)
                                  ROC curve obtained from droplet classification of LP-PBS. (k) ROC curve from droplet classification of LP-PBS
                                  obtained after complete evaporation of the water content. (l) ROC curve obtained from droplet classification of
                                  LP-AS. (m) ROC curve from droplet classification of LP-AS obtained after complete evaporation of the water
                                  content.

Scientific Reports |   (2021) 11:16201 |               https://doi.org/10.1038/s41598-021-95756-3                                                   5

                                                                                                                                               Vol.:(0123456789)
www.nature.com/scientificreports/
PLS-DA
WET DRY RESIDUE
n Th SE (%) SP (%) AUROC n Th SE (%) SP (%) AUROC
Pixel 15,104 0.71 75.0 72.8 0.82 20,527 0.80 67.5 61.9 0.66
PBS
Droplet 13 0.65 87.5 80.0 0.90 13 0.58 87.5 80.0 0.90
Pixel 28,646 0.55 64.7 55.7 0.64 31,006 0.50 42.6 46.9 0.43
AS
Droplet 20 0.24 100.0 60.0 0.64 20 0.49 33.3 60.0 0.32
Table 1. Classification performance of the PLS-DA method. Here, n is the sample size, Th is the value of
the classification threshold, SE denotes the sensitivity, SP is the specificity, and AUROC is the area under the
receiver operating characteristic curve.
turnaround times. A significant advantage of VNIR hyperspectral imaging detection over traditional diagnostic
techniques relies on the possibility of performing non-contact, reagent-free analysis of a large number of samples
simultaneously. We prepared the system to image between 9 and 25 droplets over an area of 9 × 8 cm2, but this
technology can be easily scaled to increase the field of view, thus allowing for the analysis of numerous samples
concurrently. Note that using a standard personal computer, the generation of numerical models can take several
hours. However, once these models are built, the average processing time per droplet is approximately one minute
for PLS-DA, and can be substantially reduced when using the FFNN algorithms described here.
It might also have the potential to be adapted for use in personal devices (e.g. smartphones) with adequate
optical adapters23. Furthermore, when compared to other optical spectroscopic techniques that rely on the use
of a single beam of light, hyperspectral imaging provides information redundancy by accounting for a collection
of pixels within a given sample. Note that even when the performance of the classifier at pixel level was slightly
above a random classifier, there was a substantial improvement at droplet level. This suggests that if the spectral
signature of a given virus contains distinctive information, this can be extracted and enhanced by analysing
multiple samples.
The envelope of the lentiviral particles used in this study was VSV-G glycoprotein. This glycoprotein confers
some optical properties that may be responsible for its spectral signature. Nevertheless, this study cannot discern
whether the information is arising at molecular level or from their aggregations or structural properties, and
the corresponding virological and biochemical studies remain open. It is also important to note that these viral
particles have a diameter between 80 nm and 120 nm24,25, which is approximately three times smaller than the
shortest wavelength within the visible range (i.e. blue light). Therefore, if the information is embedded in the
scattered light, the PA spectra obtained from other viral species might also possess distinct features that would
enable their optical identification. If that is confirmed, there are numerous applications for this technology.
However, the challenge lies with finding spectral features that are substantially different from the background
and the environment, that is, the supporting plate and the fluid media.
In this study, samples were classified using two different independent methods. The performance of both
techniques were similar, a point that supports the hypothesis underpinning this work. In addition, the statisti-
cally significant differences found in the value of one of the spectral feature descriptors across different sample
concentrations revealed that there was enough information for quantifying the viral load. It is therefore likely
that a combination of different spectral descriptors, when used in an ANN, could also be exploited to further
refine the quantification results reported here, as the combination of multiple sources of information can reveal
these hidden details.
We also sought to determine whether this imaging method could be used for the screening of viral contami-
nation on fomites. Although the performance of the classifier was in general lower in dry residues compared
to liquid samples, the technique showed values of the AUROC between 0.67 and 0.88. In particular, in AS, a
medium that mimics human fluids, the sensitivity thus obtained was 87.5% (SP = 60.0%). Note that this study
presents a relatively unbalanced number of positive and negative samples leaving room for further improve-
ments. A PLS-DA model built with unbalanced datasets substantially improves with balanced data26.The results
reported here support the use of this technology, not only for the screening of fluid samples obtained from a
large number of subjects but also for a potential pre-screening of inanimate objects which may be subjected to
viral contamination.
Materials and methods
VSV‑G pseudotyped lentiviral particles. For the production of the lentiviral particles, 293 T cells were
transfected with a lentiviral plasmid coding for ZsGreen, a plasmid coding for viral envelope VSGV-g protein
(under the control of the human cytomegalovirus promoter) and a plasmid encoding the Tat, Gag-Pol and Rev
genes required to construct a 2nd-generation lentiviral s ystem27,28. HEK cells were cultured in Gibco Dulbecco’s
Modified Eagle Medium (DMEM) supplemented with 10% foetal bovine serum (Biowest, Nuaillé, France) and
a combination of penicillin (100 UI·mL−1) and streptomycin (100 μg·mL−1) (MilliporeSigma, Missouri, USA).
After transfection, cells were incubated at 37ºC, 5% CO2 for 48 h. Next, the culture medium containing viral
particles was collected and Lenti-X reagent (Takara Bio Inc, Shiga, Japan) was added to concentrate viral par-
ticles through precipitation. The mixture was then incubated at 4ºC followed by centrifugation at 1500 G for
45 min at 4ºC.The supernatant was then removed, and the precipitate stored at -80ºC for later use. As a negative
Scientific Reports | (2021) 11:16201 | https://doi.org/10.1038/s41598-021-95756-3 6
Vol:.(1234567890)www.nature.com/scientificreports/
Figure 4. Classification of VSV-G pseudotyped lentiviral particles using FFNN. (a) median value of the FFNN
output used for pixel classification for samples prepared in PBS. (b) median value of the FFNN output used
for pixel classification for samples prepared in AS. (a,b) the boxes represent the interquartile range, and the
whiskers show 2.7 times the standard deviation. Lentiviral particles (LP), denoted here in red, were prepared in
PBS (LP-PBS) or in artificial saliva (LP-AS). Negative controls, represented here in green, were prepared from
non-transfected culture media in PBS (PBS-control) or in artificial saliva (AS-control). ***p-value < 0.0001 from
two-tailed Wilcoxon rank-sum test. (c) ROC curve obtained from the pixel classification of LP-PBS. (d) ROC
curve from the pixel classification of LP-PBS obtained after complete evaporation of the water content. (e) ROC
curve obtained from the pixel classification of LP-AS. (f) ROC curve from the pixel classification of LP-AS
obtained after complete evaporation of the water content. (g–j) example of a pixel classification in a droplet. Red
and green pixels denote pixels classified as positive and negative respectively. Note red and green backgrounds
indicate positive droplet and its negative control respectively. (g) LP-PBS. (h) LP-PBS dry residue. (i) LP-AS. (j)
LP-AS dry residue. (k) ROC curve obtained from droplet classification of LP-PBS. (l) ROC curve from droplet
classification of LP-PBS obtained after complete evaporation of the water content. (m) ROC curve obtained
from droplet classification of LP-AS. (n) ROC curve from droplet classification of LP-AS obtained after complete
evaporation of the water content.
Scientific Reports | (2021) 11:16201 | https://doi.org/10.1038/s41598-021-95756-3 7
Vol.:(0123456789)www.nature.com/scientificreports/
FFNN
WET DRY Residue
n Th SE (%) SP (%) AUROC n Th SE (%) SP (%) AUROC
Pixel 15,104 0.90 75.6 76.0 0.84 20,527 0.91 54.0 52.7 0.54
PBS
Droplet 13 0.52 100.0 100.0 1.00 13 0.16 87.5 80.0 0.88
Pixel 28,646 0.84 66.8 65.8 0.73 31,006 0.77 54.9 58.1 0.59
AS
Droplet 20 0.64 93.3 100.0 0.96 20 0.23 86.7 60.0 0.67
Table 2. Classification performance of the FFNN algorithm. Here, n is the sample size of the test set, Th is
the value of the classification threshold, SE denotes the sensitivity, SP is the specificity, and AUROC is the area
under the receiver operating characteristic curve.
Figure 5. Viral load quantification. (a) median value of the shape feature named area ratio (AR see
supplementary material), against viral load of the preparation. The boxes represent the interquartile range,
and the whiskers show 2.7 times the standard deviation. Lentiviral particles in PBS (LP-PBS) and their
corresponding negative controls (PBS-control). Additionally, the estimator was obtained for PBS alone.
***p-value < 0.0001 using Wilcoxon rank-sum test. (b) mean value of the AR obtained from LP-PBS and PBS-
control. (c) mean value of the AR obtained from LP-AS and AS-control. (d) mean value of the AR obtained
from LP-PBS and PBS-control upon complete evaporation of the water content. (e) mean value of the AR
obtained from LP-AS and AS-control upon complete evaporation of the water content. (b–e) the error bars
denote the standard deviation. The green dashed line and the red solid line represent the linear correlation, and r
denotes the linear correlation coefficient.
control, un-transfected HEK 293 T cells were cultured and the medium was collected, precipitated with LentiX,
and aliquoted as described above.
One hour prior to recording the reflectance spectra, a viral aliquot was thawed and resuspended in either
phosphate buffered saline (MilliporeSigma, Missouri, USA) or 1700–0305 artificial saliva (Pickering Labora-
tories, California, USA). From an initial stock titer of 20·103 transducing units (TU)·µL−1, serial dilutions were
Scientific Reports | (2021) 11:16201 | https://doi.org/10.1038/s41598-021-95756-3 8
Vol:.(1234567890)www.nature.com/scientificreports/
Fluid samples
PBS AS
Method Experimental groups Positive Control Total Positive Control Total
Training 52 9 61 58 12 70
PLS-DA Test 8 5 13 15 5 20
Total 60 14 74 73 17 90
Training 40 5 45 46 8 54
Validation 12 4 16 12 4 16
FFNN
Test 8 5 13 15 5 20
Total 60 14 74 73 17 90
Table 3. Number of droplets analysed using the PLS-DA and FFNN methods.
prepared in the corresponding media to obtain the following set of concentrations: [500, 800, 1000, 1500, 2000,
2500, 3000, 3500, 4000] TU·µL−1.
Negative controls. Droplets of the same fluid (PBS or AS) with the same concentrations of virus culture
medium (DMEM) and Lenti-X reagent but without lentiviral particles were used as negative controls. In addi-
tion, droplets of pure fluids were included for comparison.
Cell cultures. Human Embryonic Kidney (HEK) Lenti-XTM 293 T cell lines (Clontech) were maintained
in Dulbecco’s modified Eagle’s medium (DMEM) supplemented with 10% (v/v) heat inactivated Fetal Bovine
Serum (FBS), 2 mM L-glutamine, 10 mM Hepes, 1% (v/v) sodium pyruvate, 50 μM 2-mercaptoethanol, 100
U·mL-1 penicillin and 100 μg·mL-1 streptomycin at 37°C, 10% CO2.
Hyperspectral imaging setup and calibration. Spectral information was obtained between 406.62 nm
and 996.46 nm using an A-Series VNIR hyperspectral imaging system (Headwall, Massachusetts, USA), in 810
bands with 0.74 nm of nominal spectral resolution. These wavelengths range from the lower limit of the visible
(VIS) to the near infra-red (NIR) band of the electromagnetic spectrum. The camera was mounted 30 cm over
the sample plane on an A-LST0750-C (Zaber, Vancouver, Canada) motorised linear stage to allow scanning of
the samples, and a 35-mm LM35HC lens (KOWA, Saitama, Japan) was used to provide optimal focusing. An
area of 9 × 8 cm2 was scanned to ensure light intensity remained approximately homogenous over the sample.
The image had a resolution of 1275 pixels by 1000 pixels; therefore, the area of a single pixel was approximately
of 70 × 80 µm2. Optical reflectance signals at each spectral wavelength were codified using 8 bits.
The samples were illuminated using two ASD Illuminator halogen light sources (Malvern Pabalytical, Worces-
tershire, UK) mounted symmetrically 35 cm above the sample plane with their emission axes forming a 60-degree
angle with the sample plane. The colour temperature of the light source was 3100 K and the emission spectrum
ranged between 350 nm and 2500 nm. The experiments were carried out under low ambient illumination to
mimic a potential point-of-care testing environment. Illumination irradiance was measured in a square grid
pattern of 16 points covering the area of the sample supporting plate using a radiometer (HD 2102.2 with
a LP 471 Probe, Delta OHM srl, Padua, Italy). The contribution from ambient light was 1.03 ± 0.05 W∙m−2.
When the experimental illumination sources were connected, the average irradiance on the supporting plate
was 252 ± 28 W∙m−2.
The system was then linearly calibrated between a white and a dark reference. The white reference was
obtained from a 3.62-inch Spectralon white reference (Labsphere, New Hampshire, USA). The dark reference
was generated by blocking the lens using the lens cap provided by the manufacturer. Note the dark reference
contains the background noise generated by the photodetector.
Preparation of samples and imaging. The samples were imaged at room temperature under ambient
conditions (relative humidity varying between 40% and 60%). Using a micropipette, 5-µL droplets were depos-
ited onto the surface of an approximately 22 mm × 22 mm polytetrafluoroethylene sheet (BSH, Seville, Spain)
with a thickness of 1 mm (supporting plate). Each preparation contained between 9 and 25 droplets distributed
in a square mosaic pattern to facilitate off-line digital segmentation. The samples were immediately positioned
within the field of view of the imaging system over a 10-mm-thick wood sheet. The reflectance spectra were
then recorded. Following complete evaporation of the aqueous content, a second reflectance spectra dataset was
obtained from the dry residues.
Computer equipment. Processing units were standard, high-end personal computers (128 Gb RAM,
Intel® Core(TM) i9-10980XE CPU 3.00 GHz) running under Windows® 10 Pro, 64 bits.
Sample sets. A total of 164 preparations (74 samples in PBS and 90 in AS) were analysed. The sample
distribution among the different experimental groups is shown in Table 3. These same test groups were used to
Scientific Reports | (2021) 11:16201 | https://doi.org/10.1038/s41598-021-95756-3 9
Vol.:(0123456789)www.nature.com/scientificreports/
evaluate both the PLS-DA and FFNN classifiers. See supplementary material for a detailed description of posi-
tive and negative samples for each fluid and concentration.
Image pre‑processing. Original spectra of hyperspectral images were converted into pseudo-absorbance
(PA) by computing the logarithm of the inverse of the reflectance (R) spectra (PA = log (1/R)). A unit offset
was added to avoid zero-singularities in the logarithmic transform. A standard white-dark calibration was then
applied. Using the hyperspectral imaging software Evince (Prediktera, Umeå, Sweden), a red–green–blue (RGB)
subset of the hyperspectral cube was used to segment the content of each droplet. A conservative approach was
adopted to discard peripheral pixels. Next, a principal component analysis (PCA) with two components was
performed on the spectra of all pixels within a droplet to discard outlier pixels, typically flare-affected pixels. The
spectra were then normalised using the standard normal variate (SNV) transform. A Savitzky-Golay filter was
applied afterwards for smoothing, and a correction of the baseline was performed.
Partial Least‑Squares Discriminant Analysis (PLS‑DA). A PLS-DA m
odel29 was constructed using
the individual spectra of all pixels of training samples as input, and retaining a number of latent variables suf-
ficient to capture over 95% of data variance using PLS Toolbox 8.6 (Eigenvector Research Inc, Washington, USA)
running under Matlab R2020b (The Mathworks Inc., Massachusetts, USA). It generated an output variable with
values between 0 and 1 for the classification of each pixel in the test set. Additionally, we re-analysed the data
using the mean PA spectra for each droplet (see supplementary material for details).
Feed‑Forward Neural Network (FFNN). We constructed an ANN following a pixel-based approach30.
The input of the network consisted of the values of 28 spectral feature descriptors obtained in the seven spectral
bands of interest (between 415 nm and 900 nm). These descriptors quantify representative morphological fea-
tures (amplitude, length, curve ringing, curvature, compression, kurtosis, horizontality, area and comparisons
with the background reference) of every individual spectrum (see the supplementary material for a full descrip-
tion). The output of the network, a value comprised between 0 and 1, was then used for pixel classification. The
spectra were classified using an FFNN implemented in Matlab R2020b (The Mathworks Inc., Massachusetts,
USA) with sigmoid hidden and softmax output neurons. The FFNN consisted of 20 hidden and one output lay-
ers. The number of neurons (196) in each hidden layer was set as the product of the number of spectral descrip-
tors and bands of interest (28 × 7 = 196). Other configurations were discarded after empirical evaluation for best
outcomes. To find the optimal weights, the supervised training was carried out using the scaled conjugate gra-
dient backpropagation, limiting the number of iterations to 1000 to avoid overfitting. The performance of the
network was tested by evaluating the mean square error. Training, validation and test sets were constructed using
random splits of independent samples.
Data analysis. The non-parametric two-tailed Wilcoxon rank-sum test was performed on the outputs of the
PLS-DA and the FFNN models, and on the spectral feature descriptor used for quantification of the viral load.
To determine classification thresholds, ROC curves were analysed. The cut-off value was chosen to maximise
both, sensitivity and specificity. This value was determined as the point of the curve with minimum quadratic
distance to the upper left corner of highest sensitivity and specificity31. To assess the goodness of the classifier,
the AUROC was also computed, and the corresponding confusion matrix was calculated. From values of true
positive (TP), true negative (TN), false positive (FP) and false negative (FN) classifications, sensitivity (SE) and
specificity (SP) were then obtained as follows: SE = TP/(TP + FN), SP = TN/(TN + FP). Statistical significance was
considered at the 95% confidence level. P-values below 0.0001 were considered as zero.
Data availability
All data needed to evaluate the findings are present in the paper and the supplementary materials. Additional
data related to this work are available from the authors under reasonable request.
Received: 4 June 2021; Accepted: 30 July 2021
References
1. Dos Santos, C. A. T., Lopo, M., Páscoa, R. N. & Lopes, J. A. A review on the applications of portable near-infrared spectrometers
in the agro-food industry. Appl. Spectrosc. 67, 1215–1233 (2013).
2. Manley, M. Near-infrared spectroscopy and hyperspectral imaging: non-destructive analysis of biological materials. Chem. Soc.
Rev. 43, 8200–8214 (2014).
3. Li, T. et al. A brief review of opt101 sensor application in near-infrared spectroscopy instrumentation for intensive care unit clinics.
Sensors 17, 1701 (2017).
4. Barstow, T. J. Understanding near infrared spectroscopy and its application to skeletal muscle research. J. Appl. Physiol. 126,
1360–1376 (2019).
5. Lu, G. & Fei, B. Medical hyperspectral imaging: A review. J. Biomed. Opt. 19, 010901 (2014).
6. Roggo, Y. et al. A review of near infrared spectroscopy and chemometrics in pharmaceutical technologies. J. Pharmaceut. Biomed.
44, 683–700 (2007).
7. Feng, Y.-Z. et al. Near-infrared hyperspectral imaging and partial least squares regression for rapid and reagentless determination
of Enterobacteriaceae on chicken fillets. Food Chem 138, 1829–1836 (2013).
8. Siripatrawan, U., Makino, Y., Kawagoe, Y. & Oshita, S. Rapid detection of Escherichia coli contamination in packaged fresh spinach
using hyperspectral imaging. Talanta 85, 276–281 (2011).
9. Lu, Y. et al. Evaluation and classification of five cereal fungi on culture medium using Visible/Near-Infrared (Vis/NIR) hyperspectral
imaging. Infrar. Phys. Technol. 105, 103206 (2020).
Scientific Reports | (2021) 11:16201 | https://doi.org/10.1038/s41598-021-95756-3 10
Vol:.(1234567890)www.nature.com/scientificreports/
10. Lee, H. et al. Detection of cucumber green mottle mosaic virus-infected watermelon seeds using a near-infrared (NIR) hyperspec-
tral imaging system: Application to seeds of the “Sambok Honey” cultivar. Biosyst. Eng. 148, 138–147 (2016).
11. Fernandes, J. N. et al. Rapid, noninvasive detection of Zika virus in Aedes aegypti mosquitoes by near-infrared spectroscopy. Sci.
Adv. 4, eaat0496 (2018).
12. Wang, D. et al. Early detection of Tomato spotted wilt virus by hyperspectral imaging and Outlier Removal Auxiliary Classifier
Generative Adversarial Nets (OR-AC-GAN). Sci. Rep. 9, 1–14 (2019).
13. Nguyen, C. et al. Early detection of plant viral disease using hyperspectral imaging and deep learning. Sensors 21, 742 (2021).
14. Watson, D. J., Kobinger, G. P., Passini, M. A., Wilson, J. M. & Wolfe, J. H. Targeted transduction patterns in the mouse brain by
lentivirus vectors pseudotyped with VSV, Ebola, Mokola, LCMV, or MuLV envelope proteins. Mol. Ther. 5, 528–537 (2002).
15. Crawford, K. H. et al. Protocol and reagents for pseudotyping lentiviral particles with SARS-CoV-2 spike protein for neutralization
assays. Viruses 12, 513 (2020).
16. Greenhalgh, T. et al. Ten scientific reasons in support of airborne transmission of SARS-CoV-2. Lancet 397, 1603–1605 (2021).
17. Scherr, M., Battmer, K., Blömer, U., Ganser, A. & Grez, M. Quantitative determination of lentiviral vector particle numbers by
real-time PCR. Biotechniques 31, 520–526 (2001).
18. Yang, Q. et al. Just 2% of SARS-CoV-2− positive individuals carry 90% of the virus circulating in communities. Proc. Natl. Acad.
Sci. USA 118 (2021).
19. Huang, H., Liu, L. & Ngadi, M. O. Recent developments in hyperspectral imaging for assessment of food quality and safety. Sensors
14, 7248–7276 (2014).
20. Golhani, K., Balasundram, S. K., Vadamalai, G. & Pradhan, B. A review of neural networks in plant disease detection using hyper-
spectral data. Inf. Process Agric. 5, 354–371 (2018).
21. Kevadiya, B. D. et al. Diagnostics for SARS-CoV-2 infections. Nat. Mater. 20, 593-605 (2021).
22. Udugama, B. et al. Diagnosing COVID-19: the disease and tools for detection. ACS Nano 14, 3822–3835 (2020).
23. Hussain, I. & Bowden, A. K. Smartphone-based optical spectroscopic platforms for biomedical applications: A review. Biomed.
Opt. Express 12, 1974–1998 (2021).
24. Desmaris, N. et al. Production and neurotropism of lentivirus vectors pseudotyped with lyssavirus envelope glycoproteins. Mol.
Ther. 4, 149–156 (2001).
25. Segura, M.M., Garnier, A. & Kamen, A. Purification and characterization of retrovirus vector particles by rate zonal ultracentrifu-
gation. J. Virol. Methods 133, 82–91 (2006).
26. Lindström, S. W., Geladi, P., Jonsson, O. & Pettersson, F. The importance of balanced data sets for partial least squares discriminant
analysis: Classification problems using hyperspectral imaging data. J. Near Infrar. Spec. 19, 233–241 (2011).
27. Reiser, J. Production and concentration of pseudotyped HIV-1-based gene transfer vectors. Gene Ther. 7, 910–913 (2000).
28. Burns, J. C., Friedmann, T., Driever, W., Burrascano, M. & Yee, J.-K. Vesicular stomatitis virus G glycoprotein pseudotyped retroviral
vectors: concentration to very high titer and efficient gene transfer into mammalian and nonmammalian cells. Proc. Natl. Acad.
Sci. USA 90, 8033–8037 (1993).
29. Barker, M. & Rayens, W. Partial least squares for discrimination. J. Chemometr. 17, 166–173 (2003).
30. Hussain, M., Chen, D., Cheng, A., Wei, H. & Stanley, D. Change detection from remotely sensed images: From pixel-based to
object-based approaches. ISPRS J. Photogramm. Rem. Sens 80, 91–106 (2013).
31. Song, B., Zhang, G., Zhu, W. & Liang, Z. ROC operating point selection for classification of imbalanced data with application to
computer-aided polyp detection in CT colonography. Int. J. Comput. Assist. Radiol. Surg. 9, 79–89 (2014).
Acknowledgements
This research was funded by grants number COV20-00080 and COV20-00173 of the 2020 Emergency Call for
Research Projects about the SARS-CoV-2 virus and the COVID-19 disease of the Institute of Health ‘Carlos
III’, Spanish Ministry of Science and Innovation, and by grant number EQC2019-006240-P of the 2019 Call for
Acquisition of Scientific Equipment, FEDER Program, Spanish Ministry of Science and Innovation. This work
has been supported by the European Commission through the JRC HUMAINT project. ABR was supported
by grant number RTI2018-094465-J funded by the Spanish National Agency of Research. The authors would
like to gratefully acknowledge the assistance of the members of the EOD-CBRN Group of the Spanish National
Police, whose identities cannot be disclosed, and who are represented here by JMNG. Authors thank continuous
support from their institutions.
Author contributions
E.G.G. conceived the study, generated the hypotheses, and designed the imaging and analysis methodology and
experimental setup. E.G.G., J.M.R., J.M.N.G., B.F.M. and A.B.R. conceptualized the research. J.M.R. and J.M.N.G.
designed the operational methodology. E.G.G., J.M.N.G., J.M.R., R.P.G performed the experiments. E.G. provided
contributions to the methodology, machine learning net approach and data driven approach. E.G.G., J.M.N.G.,
J.M.R., M.G.C., I.F.L., F.J.M.G., P.G.G., R.P.G., D.R.L., M.A.P.E., J.A.C., O.M., J.C.G.M., S.S.T., A.B.R. analysed
the data. B.F.M., C.R.V., M.M.L., F.J.G.C., L.O.C. prepared and analysed virus solutions. M.G.C., I.F.L., F.J.M.G.,
P.G.G., D.R.L., R.P.G. contributed to data curation and programming. J.P.R., A.P.M., C.G.G., M.J.M.B., M.I.R.L.,
R.S.P. contributed to the experimental design. A.B.R., E.G.G., B.F.M. drafted the manuscript. All authors revised
the manuscript critically for important intellectual content and approved the final version.
Competing interests
Some authors (E.G.G., M.G.C., F.J.M.G., R.P.G., D.R.L., P.G.G., J.M.R., I.F.L., B.F.M. and J.M.N.G.) have filed a
patent related to the method described, with the goal of making this technology rapidly affordable for research
and potential use. All other authors declare no competing financial interests.
Additional information
Supplementary Information The online version contains supplementary material available at https://doi.org/
10.1038/s41598-021-95756-3.
Correspondence and requests for materials should be addressed to E.G.-G.
Reprints and permissions information is available at www.nature.com/reprints.
Scientific Reports | (2021) 11:16201 | https://doi.org/10.1038/s41598-021-95756-3 11
Vol.:(0123456789)www.nature.com/scientificreports/
Publisher’s note Springer Nature remains neutral with regard to jurisdictional claims in published maps and
institutional affiliations.
Open Access This article is licensed under a Creative Commons Attribution 4.0 International
License, which permits use, sharing, adaptation, distribution and reproduction in any medium or
format, as long as you give appropriate credit to the original author(s) and the source, provide a link to the
Creative Commons licence, and indicate if changes were made. The images or other third party material in this
article are included in the article’s Creative Commons licence, unless indicated otherwise in a credit line to the
material. If material is not included in the article’s Creative Commons licence and your intended use is not
permitted by statutory regulation or exceeds the permitted use, you will need to obtain permission directly from
the copyright holder. To view a copy of this licence, visit http://creativecommons.org/licenses/by/4.0/.
© The Author(s) 2021
Scientific Reports | (2021) 11:16201 | https://doi.org/10.1038/s41598-021-95756-3 12
Vol:.(1234567890)You can also read