Quality and Shelf Life of White Shrimp (Litopenaeus vannamei) Processed with High-Pressure Carbon Dioxide (HPCD) at Subcritical and Supercritical ...
←
→
Page content transcription
If your browser does not render page correctly, please read the page content below
Hindawi
Journal of Food Quality
Volume 2021, Article ID 6649583, 13 pages
https://doi.org/10.1155/2021/6649583

Research Article
Quality and Shelf Life of White Shrimp (Litopenaeus vannamei)
Processed with High-Pressure Carbon Dioxide (HPCD) at
Subcritical and Supercritical States

          Maria Erna Kustyawati ,1 Filli Pratama,2 Samsul Rizal ,1 Esa Ghanim Fadhallah ,1
          and Abdullah Aman Damai 1
          1
              Department of Agriculture Product Technology, University of Lampung, Bandar Lampung, Indonesia
          2
              Department of Agriculture Technology, University of Sriwijaya, Palembang, Indonesia

          Correspondence should be addressed to Maria Erna Kustyawati; maria.erna@fp.unila.ac.id

          Received 12 November 2020; Revised 10 March 2021; Accepted 21 June 2021; Published 30 June 2021

          Academic Editor: Flora V. Romeo

          Copyright © 2021 Maria Erna Kustyawati et al. This is an open access article distributed under the Creative Commons Attribution
          License, which permits unrestricted use, distribution, and reproduction in any medium, provided the original work is
          properly cited.
          Phase changes of carbon dioxide (supercritical or subcritical) depend on its proximity to a pressure of 7.35 MPa and temperature
          of 31.1°C. Carbon dioxide becomes supercritical and subcritical when it is above and slightly below its critical point, respectively.
          This study aims to determine the effect of high-pressure CO2 treatments at a pressure of 900 psi, 950 psi (subcritical), and 1100 psi
          (supercritical) and at holding times of 5, 10, and 15 min on the quality parameters of white shrimp (Litopenaeus vannamei) and to
          determine the shelf life of white shrimp processed with the best treatment. The results showed that the interaction between
          pressure and holding time had a significant (p < 0.05) effect on cholesterol, protein, moisture content, and b ∗ value, but pressure
          had a significant effect on carotene content. The best treatment was a supercritical CO2 treatment at 1100 psi for 10 min, which was
          determined based on a significant reduction in the number of microorganisms and no significant changes in color, texture, and fat
          content were observed compared with control. The best treatment was applied to process shrimps, which were then stored at 4°C
          to evaluate the effectiveness of scCO2 treatment on the shelf life. No significant changes were found in PV and lipid in treated and
          scCO2-treated shrimps during storage, but the treatment significantly affected pH, TVBN, and microbial counts. Among the
          samples, there was no hedonic difference in all sensory attributes. Supercritical CO2 treatment at 1100 psi for 10 min can be an
          alternative method for preservation of shrimps.

1. Introduction                                                          and bioactive components during heat treatment [1, 2]. A
                                                                         new method of nonthermal HPCD technology has also been
White shrimp (Litopenaeus vannamei) has highly distinctive               investigated as alternatives. This technique may overcome
nutritional value and powerful antioxidants but is of fast               some weaknesses of conventional methods of shrimp han-
deterioration, which results in an unpleasant odor, color,               dling techniques because it maintains the nutritional and
soft texture, and loss of acceptability. Several research works          sensorial quality of the foods while keeping freshness and
have been carried out to prevent shrimp deterioration                    flavor. High-pressure carbon dioxide is a nonthermal pro-
during handling, including the application of conventional               cessing or a cold pasteurization method, where CO2 is above
and nonthermal high-pressure carbon dioxide (HPCD)                       its critical point (supercritical region) and becomes super-
processing methods. However, there were some drawbacks                   critical fluid. CO2 in the form of supercritical fluid has a
to applying the first techniques, such as the occurrence of               density like liquid, so it has a high solubility and diffusion
temperature abuse, loss of flavor and acceptability of drying             due to the loss of boundary between the liquid and gas
shrimp, destruction of nutritional value, and loss of vitamins           phases. The CO2 fluid density is highly compressible, in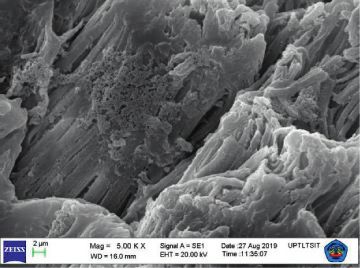
2                                                                                                       Journal of Food Quality

which a slight increase in pressure can lead to a large increase   processing instrument was located. Thereafter, processed
in fluid, making it possible to produce changes in the              shrimps were prepared for analytical tests or quickly packed
macromolecule and micromolecules of foods. Moreover,               in plastic container and kept in freezer −20°C until they were
supercritical CO2 fluid tends to be nonpolar organic com-           needed. Following that, processed and unprocessed shrimps
pounds, owing to its low polarity and lack of capacity for         were analyzed for color, texture, and basic nutrients. For
specific molecule interactions [3, 4]. Several studies on the       other analyses, such as cholesterol, carotene total, and mi-
application of high-pressure CO2 for shrimp processing have        crostructure (SEM), frozen samples were taken to the
been carried out, mainly with changing of temperature and          University of Lampung, Bandar Lampung, Indonesia, within
CO2 pressure. HPCD at 310 bar (31 MPa), 1875 L of CO2,             4 hours. It took 2 months to get all the data analyzed and find
and 37°C was to produce low-cholesterol shrimps [5], and           the best sample treatment. Thereafter, a storage study was
that at 20 MPa was for the prevention of shrimp melanosis          performed in the Laboratory of Microbiology, University of
[6]. HPCD in the range of 20–25 MPa and 37°C was per-              Lampung, after previously processing HPCD samples in the
formed for kinetic inactivation of PPO [7], while extraction       processing laboratory. The whole study was conducted for 4
of shrimp-waste astaxanthin was performed at 200 MPa for           months from July to October 2020.
5 min with the use of ethanol cosolvent [8].
     From those findings, the CO2 pressure used to process
                                                                   2.2. High-Pressure Carbon Dioxide (HPCD) Processing.
the shrimp was quite high (14–31 MPa) and 37°C. Addi-
                                                                   The high-pressure CO2 installation used for experimental
tionally, use of a very high CO2 pressure at 800 MPa resulted
                                                                   treatment consists of a CO2 gas cylinder, cylindrical pressure
in toughening of shrimp texture and loss of flavor [9]. In fact,
                                                                   chamber, pressure gauges, and water bath at a constant
the critical point of CO2 is at a pressure of 7.38 MPa and a
                                                                   temperature [12] (see Figure 1). Fresh shrimps were placed
temperature of 31.1°C [10], meaning that, at and above its
                                                                   in a pressure chamber, which has been previously disinfected
critical point, CO2 exists as a gas and liquid in equilibrium,
                                                                   with 70% alcohol. Then, the chamber was tightly closed.
where an increase in temperature or pressure above this
                                                                   When the designated temperature in the water bath was
critical point does not result in further phase changes [11].
                                                                   reached and all pipe connections were secured, commer-
The CO2 fluid density is highly compressible; therefore, a
                                                                   cially available CO2 (Pertamina, Jakarta, Indonesia) was
slight change in temperature and pressure values can cause
                                                                   injected through the gas inlet valve from the gas cylinder into
changes in the macromolecular and micromolecular
                                                                   the pressure chamber until it reached the desired pressures
structure of the shrimp, which, in turn, affect the quality of
                                                                   of 900, 950, and 1100 psi (shown in pressure gauge) within
the shrimps. Additionally, the use of a very high CO2
                                                                   1 min. After being subjected to high-pressure CO2 treatment
pressure level may also lead to higher costs. Taking into
                                                                   for a defined pressurized time (5, 10, and 15 min), the
account the above findings, our study used CO2 pressure
                                                                   pressure was lowered to atmospheric pressure within 3
treatments at supercritical CO2 (1100 psi/7.58 MPa) and
                                                                   minutes by slowly opening the gas outlet valve. Then, the
subcritical CO2 (900 psi/6.21 MPa and 950 psi/6.55 MPa).
                                                                   shrimps were aseptically removed from the pressure
This study aimed to determine the effect of subcritical (900
                                                                   chamber using a sterilized tong, placed in the sterilized
and 950 psi) and supercritical (1100 psi) CO2 treatment at
                                                                   container, and stored in a freezing temperature (−20°C)
holding times of 5, 10, and 15 min on changes in shrimps’
                                                                   before conducting an analysis such as SEM, but the samples
quality. The evaluated quality parameters included basic
                                                                   were directly analyzed for microorganisms. The experiment
nutrients, color, microbiological, total carotene, cholesterol,
                                                                   was conducted in a full factorial design with the following
texture, and muscle microstructure. The best treated shrimp
                                                                   factors: supercritical CO2 (scCO2) treatment at 1100 psi for
was determined from the quality parameters that were not
                                                                   5, 10, and 15 min and subcritical CO2 (sub-CO2) treatment
significantly different or the least changed compared with
                                                                   at 950 psi and 900 psi. The holding time for each of the
untreated shrimp. Then, it was stored at 4°C for 10 days to
                                                                   pressure treatments was 5, 10, 15, and 20 min. Each treat-
determine whether HPCD processing could prolong its shelf
                                                                   ment was replicated three times.
life. Spoilage indications, including the changes of lipid, PV,
TVBN, pH, and microbial levels, were monitored during
storage.                                                           2.3. Scanning Electron Microscope (SEM). Analysis of shrimp
                                                                   microstructure was conducted by scanning electron mi-
2. Materials and Methods                                           croscope (SEM, JSM-6310LV, JEOL Ltd.) following the
                                                                   procedures of Plascencia Jatomea and Viniegra et al. [13],
2.1. Time and Place of Sampling. Freshly caught and addi-          adjusted to the shrimps’ sample. Cross- and longitudinal
tive-free white shrimp (Litopenaeus vannamei) (25–30               sections of shrimp muscle (0.5 × 0.5 cm) were chemically
shrimps/kg) were purchased from a local farm in Palem-             prefixed with 2.5% (v/v) glutaraldehyde in 0.1 mol/L at pH
bang, Indonesia. The shrimps were kept in a sterile box ice        7.0 PBS (phosphate-buffered saline), overnight at 4oC. Then,
(shrimps: ice � 1 : 2) and transported to the laboratory within    postfix the sample with 1.0% (w/v) osmium tetra oxide at
45 min. Upon arrival, the shrimps were rinsed with tap water       room temperature for 1 hour. The specimens were washed in
and stored in a low temperature (2°C). Then, the fresh             50 mM of PBS, pH 7.0 three times and then dehydrated for
shrimps were run for high-pressure CO2 processing in the           15 min in a series of ethanol solutions graded at 30%, 50%,
Laboratory of Processing, University of Sriwijaya, Palem-          60%, 70%, 80%, 90%, 95%, and 100%, respectively. Following
bang, Indonesia, where the unit of high-pressure CO2               drying, the specimen then was coated in a gold coater by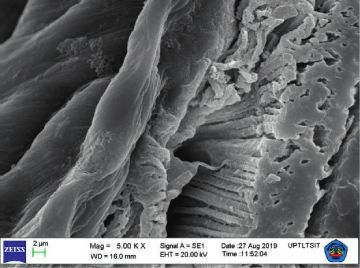
Journal of Food Quality                                                                                                            3

                                                                      shrimp meat was placed in an optically clear Petridis glass.
         CO2 inlet valve                                              For each sample, three measurements were performed at the
                                   Pressure gauge                     ventral body (second segment) of shrimp muscle, and the
                                                         CO2 outlet   average values of the three samples were recorded.
                Pipe                                       valve          The texture in terms of hardness was measured by using a
                                                                      LFRA Texture Analyzer (Brookfield AMETEK CT3-4500-
                                                                      115CT3). Immediately after processing with HPCD, the
                             CO2 inlet valve
                                                                      sample was placed on a platform and a needle probe (50 mm
                Water bath                                            diameter) attached to a 25 kg load cell. The texture analyzer
                                                                      was set to a test speed of 5.0 mm/s, posttest speed of 10 mm/s,
    CO2 gas
    cylinder                                                          target distance of 30.0 mm, and acquisition rate of 200 pps. A
                                                Sample                measurement was in gram force (m2/probe diameter), where
                                               chamber                a high value of measurement indicates an increase in shrimp
                                                                      hardness. For each sample, three measurements were per-
                                                                      formed, and the average value was recorded.

                                                                      2.6. Cholesterol Analysis. The extraction of cholesterol was
 Figure 1: Schematic diagram of HPCD treatment equipment.             following the methodology essayed by Saldanha et al. [14]
                                                                      and derivatization with TMS (trimethylsilyl) ethers. The
                                                                      TMS derivatives were diluted in 1 mL hexane, filtered
using IB3 ion coater tool for 5 minutes with an ions’ current         through a 22 μM filter (Millipore, Maryland, MD, USA) and
of 7-8 milliampere. Finally, the specimen was observed with           injected into a gas chromatograph (Shimadzu GC 2010,
ACC 20 kV-voltage devices at 100x, 250x, and 500x                     Tokyo, Japan) equipped with a split injector (1 : 50) and a
magnification.                                                         flame ionization detector and capillary column Rtx-5-MS
                                                                      (30 m × 0.25 mm x 0.25 μm Restek, Bellefonte, USA). The
                                                                      operation conditions were as follows: an initial temperature
2.4. Microbial Analysis. Microbial analysis in treated shrimp         of 230°C (0 min); heating rate of 2°C/min up to 264°C
was expressed in terms of the relative survivor fraction, log         (5 min); and then a heating rate of 1°C/min up to a final
(N/No), where N is the number of colony-forming units per             temperature of 275°C (2 min). The injector and detector
gram of sample (CFU/g) after treatment and No is the                  temperatures were 350°C and 290°C, respectively. The carrier
number of colony-forming units per gram (CFU/g) of                    gas used was hydrogen at a flow rate of 1 mL/min. Cho-
sample before treatment. Each experiment was performed in             lesterol identification was performed by comparing sample
duplicate, and the average values were reported. Total aer-           retention times with standard retention times (Sigma,
obic count was performed using the spread plate agar                  Milford, MA, USA). The quantification was performed by an
technique. First, the shrimp samples (10.0 ± 0.2 g) were              external calibration curve with 10 points, at concentrations
collected aseptically and placed in the sterile stomacher bag         ranging from 10 to 1000 μg/mL.
homogenized with 90 mL of 0.85% sterile saline solution for
2 min. Next, serial dilutions of 10−1, 10−2, and 10−3 were
prepared with 0.85% sterile saline solution. Subsequently,            2.7. Total Carotenoid Analysis. The concentration of total
0.1 mL of each dilution was spread on to plate count agar             carotenoids was measured using the spectrophotometric
(Difco, Detroit, MI, USA) for total aerobes.                          modified method from treated and untreated shrimp [15].
                                                                      To prepare the standard graph, different volumes 0.2, 0.4,
                                                                      0.6, 0.8, 1.0, and 1.2 ml stock solutions of astaxanthin (1%)
2.5. Color and Texture Analysis. The colors of untreated              were made, and the solutions were diluted up to 10 ml with
shrimps and treated ones with high-pressure CO2 were                  n-hexane. The absorbance was measured at 472 nm using
measured using a colorimeter (Konica Minolta C-400,                   n-hexane as the blank. The experiment was performed in
Tokyo, Japan) using CIELAB system. In this color system,              triplicate; the standard graph for astaxanthin was
the L∗ (lightness) variable represents the brightness, in             constructed.
which L∗ � 0 for dark and L∗ � 100 for white. The a∗
(redness) scale ranges from negative values (−a∗ ) for green
to positive values (+a∗ ) for red, and b∗ (yellowness) scale          2.8. Basic Nutrient Analysis. Water content, crude protein,
ranges from negative values (−b∗ ) for blue to positive values        fat, and ash were measured following the standard methods
(+b∗ ) for yellow. The chroma (C) value reflects the color             [16]. Weight differences were recorded after drying the
intensity, where the brighter the color, the lower the C value.       samples in a hot air oven at 100 ± 5°C overnight to determine
The notation of hue (°H) indicates the dominant color, where          the water content. Protein content was measured by using
negative °H has a range color of yellow-green; positive °H            the micro-Kjeldahl method. Crude fat was measured by
values have a range color of yellow-red. The colorimeter              Soxhlet extraction with diethyl ether. Ashing was done by
employed was firstly calibrated with a black standard fol-             incineration in a muffle furnace at 550 ± 50°C until white ash
lowed by a white standard to obtain the final setting. The             was obtained.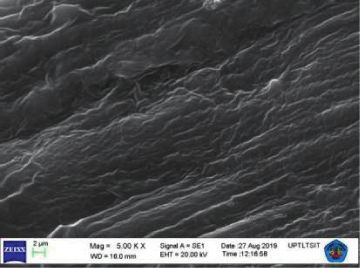
4                                                                                                      Journal of Food Quality

2.9. Storage Study                                               is determined by reference to a statistical table [20]. The
                                                                 study was run twice, and the average value was taken. This
2.9.1. Determination of pH, TVB-N, and PV during Storage.        study does not require ethical approval.
Determination of pH was performed using a pH meter
                 ™
(Seven Go Duo , Mettler Toledo Inc., Columbus, OH,
USA).The pH of all shrimp samples was determined at              2.10. Statistical Analysis. Statistical analyses were performed
ambient temperature. Approximately 20 g of shrimp was            using SPSS package (SPSS 23.0 for windows, SPSS Inc.,
                                                                 Chicago, IL, USA). The data of the parameters, including
homogenized with 80mL distilled water using Warring
Blender (USA). Prior to use, calibration of the Seven Go Duo
                                                            ®    basic nutrient, carotenoids, cholesterol, color values, texture,
pH Meter probes was done using standard buffers of pH 4.0.        and microbial counts, obtained from the treatments were
     The determination of TVB was performed following the        subjected to an analysis of variance (one-way ANOVA) to
National Standardization Body [17]. Approximately 5 g of         determine the significance between samples. Data obtained
shrimp flesh was homogenized with 15 mL of 4% tri-                from the storage study, including parameters such as pH,
chloroacetic acid (TCA) (w/v) and centrifuged at 3000 g for      TVBN, microbial counts, lipid, and PV, were also run for
3 min and then filtered through filter paper. An aliquot of        one-way ANOVA. A Duncan’s test was used to compare the
5 mL was removed and mixed with 5 mL of 2M NaOH. The             means of parameter analysis in the experiment. The means
mixture was poured into a semi-microdistillation tube and        with different letters were significantly different at p ≤ 0.05.
steam distillation was performed. The distillate was collected   Data represent the means ± SD of measurement for three
in a beaker containing 15 mL of 0.01 HCl containing 0.1 mL       replicates.
rosolic indicators. Titration was performed using 0.01 M
NaOH to a pale end point.                                        3. Results and Discussion
     Determination of peroxide value (PV) was done fol-
lowing the procedure IFRA [18]. Approximately 5 g of             The ANOVA and t-test (Table 1) indicated that high-
shrimp flesh was homogenized with 30 ml of solution of            pressure CO2 (subcritical and supercritical) significantly
glacial acetic acid: chloroform (3 : 2) in 250 mL Erlenmeyer     affected carotene, microbial reduction, moisture, protein,
flask for 30 sec. To the homogenate, 1 mL of saturated po-        and chrome color (p ≤ 0.05). However, holding time did not
tassium iodide (KI) solution was added, and it was allowed       significantly affect the hardness, fat, L∗ , a∗ , and hue color of
to react for 1 min by agitating. Then, 30 mL aquades was         treated shrimp (p ≥ 0.05). The interaction of the pressure
added. An equivalent (50 mL) amount of distilled water was       and holding time significantly affected the cholesterol,
added to the mixture to release the iodine and solution          moisture, ash, protein, b∗ , and chrome color of treated
titrated with 0.01 M sodium thiosulphate solution against        shrimp (p ≤ 0.05).
blank. PV was calculated and expressed as mEq active O2/kg
lipids.                                                          3.1. Effect of High-Pressure Treatment on Color, Texture, and
                                                                 Microstructure. High-pressure CO2 treatments did not
                                                                 significantly (p ≥ 0.05) change the color and texture of the
2.9.2. Sensory Analysis of Shrimps during Storage.               shrimps. Table 2 shows the effect of the treatments on the
Sensory analysis was performed to determine the effect of         color changes. Raw shrimps appeared slightly opaque and
high-pressure CO2 (HPCD) processing on the preferences           translucent with low color intensity (C) and very low
and organoleptic properties of shrimps during storage.           dominant color (°H) of yellow-red. After treatment at 900
Hedonic test was used to determine the preference level of       psi, the shrimps turned slightly pink, low color intensity (C),
untreated and treated shrimps based on hedonic scale. Duo-       and low dominant of yellow-red. When pressure treatment
Trio test was used to determine whether a perceptible            increased, the samples were dominant in slight pink color,
sensory difference exists between samples of two products,        with higher intensity in pale white, which was more pro-
untreated and treated shrimp with HPCD. All samples in-          nounced at 1100 psi. This was related to the decrease in
cluding untreated and treated shrimps with HPCD were             carotenoid (Table 3), meaning that astaxanthin was released.
assessed. For the Hedonic test, all samples were evaluated by    This result can be explained that the more release of
10 untrained panelists using a five-point hedonic scale,          astaxanthin in shrimp matrix, the more intense the color
ranging from 5 � like extremely to 1 � dislike extremely [19].   change. Youn et al. [21] and Sánchez-Camargo et al. [22]
They were asked to evaluate overall likeness, texture, and       reported that the higher supercritical CO2 pressure resulted
aroma. For the Duo-Trio test, a set of three samples of          in a significant increase of astaxanthin solubility and extract
shrimps was served to each of the 20 panels, of which one        yield. CO2 was a good solvent for astaxanthin due to its
sample was labeled as a reference and the other two samples      similar polarity, and therefore, the higher the pressure, the
had different codes. The panels were informed that one of         more intense the extraction, releasing free astaxanthin. In
the coded samples was the same as the reference and one was      our study, the slight discoloration of shrimp may be due to
different, and then, they are asked to report which of the        the weakening of physical interactions in the car-
coded samples they believe to be different most from the          otenoprotein molecules in the shrimp meat. Diffused CO2
reference (control) and write down the differences in terms       reduces water density and creates hydrophobic microenvi-
of each of the three parameters: color, texture, and odor. The   ronments. It can break the interaction between protein and
number of correct responses is counted, and the significance      astaxanthin by dissolving isoprene units linked by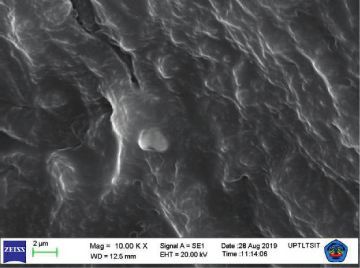
Journal of Food Quality 5
Table 1: Statistical analysis of the effects of HPCD parameters on experiment. At a pressure of 900, 950, and 1100 psi, high-
the qualities of treated shrimps. compressibility CO2 interacts with the hydrophobic bonds
p values in the protein, which causes unfolding of its tertiary
Parameters structure. The unfolded protein structure increases their
Pressure (P) Time (T) P×T
surface hydrophobicity allowing new intra- and interprotein
Carotene 0.000 — —
interaction, thereby resulting in a dense protein structure.
Microbial reduction 0.000 0.000 0.200
Cholesterol 0.063 0.024 0.000
During the release of CO2 pressure, the unfolded protein
Hardness 0.350 0.985 0.989 structure may return to its native structure and allow the
Basic nutrient
rehydration of protein, resulting in the less hard texture. This
Moisture 0.019 0.005 0.011 may explain the slight change in the texture of the shrimps.
Ash 0.853 0.008 0.064
Fat 0.053 0.854 0.809
Protein 0.047 0.000 0.000 3.2. Effect of High-Pressure Treatment on Basic Nutrients.
Carbohydrate 0.006 0.003 0.493 A whole shrimp consists of head, shell, meat muscle, and tail.
Color The main part is the meat, accounting for 48% of the shrimp
L 0.143 0.315 0.855 [26]. The chemical analysis of fresh and treated shrimp is
a∗ 0.178 0.280 0.575 presented in Table 4. It showed that the range of values for
b∗ 0.622 0.002 0.004 protein, fat, and ash content in all of the processed shrimps
C 0.016 0.003 0,001 was 16.04–18.89%, 0.23–0.53%, and 0.7–1.54% (w/w, wet-
H 0.974 0.065 0.132 weight basis), respectively. The results were similar to those
Significantly different at p ≤ 0.05. reported by Venugopal [27], who found the protein and fat
levels of L. vannamei were ranging from 17.0 to 23.0 and 0.37
to 0.88, respectively, with myosin and actin being the pre-
conjugated double bonds and produce a slight pink color dominant proteins. Tabitha and Anand [26] showed that
(a∗ � 5.85, ?L∗ � 61.35). In shrimp and salmon, astaxanthin protein, carbohydrate, lipid, moisture, and ash content of
is conjugated with protein to form carotenoprotein mole- L. vannamei from India were 35.69, 3.20, 19, 76.2, and 1.2%
cules. Astaxanthin does not bind to protein but only (dry basis), respectively.
physically interacts, where there is an intermolecular force As shown in Table 4, high-pressure CO2 (HPCD)
between astaxanthin and protein molecules [23]. Hydroxyl treatment significantly affected the protein content of
and ketone groups in the end ring structure, which are shrimp (p ≤ 0.05) with the fluctuating value. The protein of
bound to the hydrophilic part of the protein membrane, are untreated shrimp was 18.09%, and the treated shrimp at
polar molecules, while the isoprene unit is attached to the 1100 psi for 15 min was 18.21%. The lowest content, 16.04%,
hydrophobic part of the protein membrane and is nonpolar. was shrimp treated at 900 psi for 5 min. In this study, the
Colors produced by carotenoid pigments ranges from blue change in protein content can be due to molecular polarity
to red due to the presence of double bonds structure [24]. and interactions of supercritical CO2 with amino acid side
This color changes could relate to the change of texture chains. Shrimp proteins have an appreciable amount of the
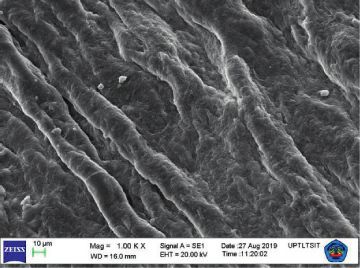
and microstructure found in this study. In the micro- essential amino acids, that is, leucine, isoleucine, lysine,
structure view (Figure 2), we found that the supercritical valine, threonine, methionine, phenyl alanine, and cysteine,
CO2 caused the muscle fiber structure to swell due to protein and good content of glycine, glutamic acid, alanine, and
denaturation. This was associated with a decrease in protein proline [27]. Leucine, isoleucine, valine, methionine, phenyl
content (Table 4). Monhemi and Dolatabadi [4] reported the alanine, alanine, and cysteine are hydrophobic residues of
complete denaturation occurred between 800 and 1400 nonpolar molecules, while threonine, lysine, glycine, and
MPA. Proteins are completely denatured when their sec- glutamic acid are hydrophilic residues of polar molecules.
ondary structure consisting of amino acids linked by hy- During the high-pressure CO2 treatment, CO2 molecules
drogen bonds is broken. Denaturation affects the shrinkage diffused to the protein matrix, made a hydrophobic mi-
of the sarcomere and the breaking of muscle fibers. As CO2 croenvironment, and lead to adsorption of nonpolar hy-
diffused in the aqueous meat matrix, it reduced water density drophobic amino acids. This causes reduction in protein
protein, and muscle fiber structure became dense forming a content. Polar hydrophilic amino acid residues escape from
larger sarcomeric space. Yan et al. [25] found that dena- the hydrophobic microenvironment and form nonnative
turation of sarcoplasmic protein produced paler color of hydrogen bonds with other hydrophilic residues. This
meat treated with high-pressure CO2. nonnative interactions lead to the protein denaturant in the
The changes of shrimp’s texture and microstructure of high-pressure CO2-treated protein. This may explain the
the shrimps are related to protein content and water-holding fluctuated value of protein in the study. CO2 is regarded as
capacity. Figure 3 displays the histogram of the hardness of hydrophobic fluid at supercritical CO2 and is a proper
treated and untreated shrimp at various pressures and solvent for most nonpolar and slightly polar molecules
holding time. When the protein denatured and collagen [4, 28]. Meanwhile, subcritical CO2 (900 psi) tends to attract
shrank, shrimp muscles lost their water-holding capacity, slight polar molecules [3].
leading to changes of hardness. In our study, there was the There was no significant difference (p ≥ 0.05) in fat
possibility of partial denaturation of shrimp protein in our content in all samples, meaning that there was no correlation6 Journal of Food Quality
Table 2: Effects of various pressures and holding times on color attributes of white shrimps (Litopenaeus vannamei).
Color
Pressure (psi)/holding time (min)
ΔL∗ a∗ b∗ Chrome Hue
Untreated 51.55 ± 0.77a 4.15 ± 0.07a 4.65 ± 0.49c 4.0 ± 0.92a 20.2 ± 2.05a
900/5 51.65 ± 0.77a 5.55 ± 1.62bc 7.6 ± 1.55e 7.5 ± 0.85c 45.7 ± 0.78cd
900/10 54.15 ± 1.10ab 5.15 ± 0.49ab 4.5 ± 0.71c 9.0 ± 1.48e 45.6 ± 1.2cd
900/15 59.1 ± 2.96cd 5.25 ± 2.05b 8.0 ± 2.12ef 8.8 ± 1.48de 45.8 ± 11.8cd
950/5 53.75 ± 0.71ab 5.0 ± 0.71ab 9.55 ± 0.21g 8.9 ± 0.07de 45.2 ± 8.91cd
950/10 52.05 ± 1.34a 4.05 ± 0.07a 2.05 ± 0.35a 4.7 ± 0.28ab 36.4 ± 4.31b
950/15 54.9 ± 6.64ab 5.6 ± 0.14bc 8.75 ± 0.21f 9.1 ± 0.35e 56.8 ± 0.49d
1100/5 59.75 ± 4.45c 5.25 ± 0.91b 3.85 ± 1.34b 6.5 ± 0.28b 43.2 ± 2.19c
1100/10 56.75 ± 3.88bc 5.85 ± 1.20c 6.65 ± 1.76d 6.6 ± 0.35b 45.1 ± 3.61cd
1100/15 61.35 ± 0.21c 6.1 ± 0.71c 7.75 ± 2.19ef 8.1 ± 0.64d 48.1 ± 2.47cd
Different letters in the same column indicate significance differences (p ≤ 0.05) between the treatments. Results represent an average of 3 replications and
standard deviation.
Table 3: Effects of various pressures and holding times on cholesterol, total carotene content, and microbial reduction in white shrimps
(Litopenaeus vannamei).
Pressure (psi)/holding time (min) Cholesterol (mg/g) Total carotene (mg/g) Microbial reduction (log N/No)
Control 1.63 ± 0.34f 4.24 ± 0.33a
900/5 1.39 ± 0.28cd 3.80 ± 1.09b 0.983 ± 0.00a
900/10 1.27 ± 0.32a 3.78 ± 0.09bc 0.979 ± 0.00ab
900/15 1.46 ± 0.29de 3.79 ± 0.64bc 0.974 ± 0.00bc
950/5 1.47 ± 0.32de 3.77 ± 2.02c 0.974 ± 0.00bc
950/10 1.39 ± 0.34de 3.76 ± 0.37c 0.969 ± 0.00c
950/15 1.36 ± 0.34bc 3.69 ± 0.55c 0.952 ± 0.00d
1100/5 1.46 ± 0.33de 2.51 ± 0.29d 0.803 ± .00e
1100/10 1.48 ± 0.31e 2.37 ± 0.06d 0.805 ± 0.00e
1100/15 1.34 ± 0.29ab 2.29 ± 0.12d 0.793 ± 0.00f
Means with the same superscript letter in the same column were not significant different (p ≤ 0.05).
(a) (b) (c) (d) (e)
Figure 2: SEM images of microstructures of white shrimp with high-pressure CO2 treatments. (a) Raw shrimp muscle at transversal section
showing a well-organized structure. (b) Raw shrimp muscle at longitudinal section. (c) Swollen muscle fiber due to protein denaturation
identified in treated shrimps at 900 psi for 10 min. (d) Denser muscle fiber and large sarcomeric space were formed in treated shrimps at 950
psi for 10 min. (e) Shrinkage of sarcomere and broken muscle fiber identified in treated shrimps at 1100 psi for 10 min.
between fat solubility and HPCD treatment at various significant. Another study reported the protective effect of
pressures and holding time. The data showed that the fat carbohydrate in foods on the inactivation of Brocothrix
content in untreated shrimps was 0.53%, while, in treated thermosphacta inoculated on minced and skinned beef
shrimps, it ranged from 0.23% to 0.44%. A similar finding treated with HPCD at 6.1 MPa, 45°C for 150 min [31].
reported that the fat content of Nila tilapia was not affected High-pressure CO2 did not have a significant effect
by scCO2 from 80 to 90 bars at 40°C [29]. On the contrary, fat (p ≥ 0.05) on the moisture of shrimps, although there was a
content in tempeh reduced at 1100 psi at 31°C [30]. Fat in decrease in moisture of up to 74% in shrimps treated with
foods is lipophilic and soluble in supercritical CO2; there- 1100 psi for 15 min. There is no removal of water from the
fore, it decreased during HPCD processing. The explanation shrimps, but rather the pressured CO2 attracts water mol-
was related to the presence of protein, cholesterol, and other ecules by binding to the water and forming HCO3� and CO3�
organic compounds in shrimps, which could act as a barrier ions and consequently reducing the water content. In-
effect on the solubility of fat-scCO2 and the lower moisture creasing pressure and longer treatment time increased the
content (74%), which reduced the amount of CO2 able to solubility and mass transfer of CO2, thereby enhancing the
dissolve in the food matrix; consequently, fat loss was not decrease in water content as what happened in shrimpsJournal of Food Quality 7
Table 4: Effects of high-pressure CO2 at various pressures and holding times on the proximate and microbial reduction.
Pressure (psi)/holding time (min) Moisture (%) Crude fat (%) Crude protein (%) Ash (%)
900/5 79.99 ± 0.71a 0.36 ± 0.005a 16.04 ± 0.08f 0.70 ± 0.03a
900/10 79.84 ± 0.14a 0.38 ± 0.01a 18.11 ± 0.13hi 0.99 ± 0.1ab
900/15 79.97 ± 0.1a 0.28 ± 0.03a 16.75 ± 0.12a 0.99 ± 0.1b
950/5 77.21 ± 1.48a 0.28 ± 0.007a 18.20 ± 0.14hi 1.06 ± 0.3c
950/10 78.48 ± 1.06a 0.24 ± 0.42a 18.15 ± 0.18bcd 1.54 ± 0.3cd
950/15 78.29 ± 1.84ab 0.60 ± 0.45a 16.78 ± 0.34ab 0.81 ± 0.12cd
1100/5 77.9 ± 1.27ab 0.78 ± 0.45a 18.45 ± 0.28de 1.28 ± 0.78cd
1100/10 74.96 ± 0.6ab 0.78 ± 0.53a 18.94 ± 0.13fg 1.52 ± 0.5cd
1100/15 74.38 ± 1.42bc 0.77 ± 0.046a 18.21 ± 0.14bc 1.03 ± 0.04d
Untreated 79.08 ± 1.36c 0.29 ± 0.021a 18.09 ± 0.68h 0.96 ± 0.1e
Means with the same superscript letter in the same column were not significant different (p ≤ 0.05).
140 which can inhibit penetration of CO2 into the bacterial cells
and prevent them from dying. Moreover, lower moisture
120
(74%) content due to the dissolution of CO2 into liquid
100 shrimps, which dissociates and forms HCO3–, CO3– and H+
Hardness (kN/m2)
ions, could increase the bactericidal effect of high-pressure
80
CO2 treatment. Erkem [31] showed that the bactericidal
60 action of HPCD was more effective in a liquid substrate,
where Brochothrix thermosphacta cells inoculated in
40
brain–heart infusion broth were completely inactivated
20 under 6.1 MPa after 30 min at 45°C, while it was reduced one
log cycle, when the cells were inoculated in minced beef
0
Control 900 psi 950 psi 1100 psi treated with HPCD at 6.1 MPa and 45°C for 150 min.
Pressure
5 min 3.4. Effect of High-Pressure Treatment on Cholesterol and Total
10 min Carotene. Shrimps are rich in cholesterol even though they
15 min
contain high nutrient quality of polyunsaturated fatty acids
Figure 3: Texture of untreated and treated shrimps with HPCD at [32, 33]. In this study, the effects of HPCD processing on
various pressures and holding times. The results represented the cholesterol and total carotene in shrimp were measured and
mean values obtained from 3 different samples and two displayed in Table 3. It showed that HPCD processing
replications. significantly decreased (p ≤ 0.05) cholesterol and total
carotene content in shrimps. The initial cholesterol content
treated with 1100 psi for 15 min. Ash content of the shrimps in untreated shrimps was 1.63 mg/g. Cholesterol levels in
treated at 1100 psi significantly increased (p ≤ 0.05) com- treated shrimps fluctuated between 1.27 and 1.48 mg/g, and
pared with the other samples. A decrease in moisture the lowest level was reached at 900 psi for 10 min of holding
content can cause a relative increase in protein, fat, and ash time. Compared with the study conducted by Higuera-
[7]. Ciapara et al. [5], which found that cholesterol was extracted
in supercritical CO2 (310 bar; 37°C), our findings suggest
that cholesterol was extracted in both subcritical CO2
3.3. Microbiological Analysis. Table 3 displays the reduction (900 psi) and supercritical CO2 (1100 psi). This can be
number of aerobic bacteria in treated shrimp with HPCD. explained by considering the molecular polarity and solu-
The high-pressure treatment significantly destroyed bacteria bility of CO2. In the supercritical region, supercritical CO2
(p ≤ 0.05) at 1100 psi. The number of aerobic bacteria in (scCO2) possesses high solubility, where the density of
fresh shrimp (before treatment) and in treated shrimp at scCO2 increased with increasing pressure, so that more
1100 psi was 4.5 × 10⁵ CFU/g and 3.5 × 10⁴ CFU/g, respec- cholesterol was extracted. In the subcritical region slightly
tively. In contrast, the number of microbes in tilapia de- below the critical point, CO2 can be a liquid, which is more
creased by 2 log cycles at a pressure treatment of 80 bar polar, and cholesterol can most likely be extracted in this
reported by Sugiharto et al. [29]. Meanwhile, Kustyawati CO2 phase [34]. Below the critical point and above the triple
et al. [30] found that tempeh treated with 900 psi signifi- point of −56.6°C and 0.52 MPa, CO2 exists as a liquid. At and
cantly (p ≤ 0.05) reduced the number of microbes by 2 logs. above the critical temperature of 31°C and critical pressure of
The type and chemical contents of products processed with 7.35 MPa (critical point), CO2 exists as a gas and liquid in
supercritical CO2 could be the reason for inhibiting mi- equilibrium; increasing temperature or pressure above this
crobiological inactivation in treated shrimps in this study. critical point does not result in any further phase changes.
Shrimps are a marine product that contains high protein, fat, Cholesterol (C27H46O) is mostly a nonpolar hydrocarbon
minerals, and many bioactive compounds in their matrix, compound [33], but cholesterol is water-soluble because it8 Journal of Food Quality has a polar OH functional group, so more cholesterol is increased in treated shrimps with scCO2 and ended at extracted at 900 psi. Cholesterol levels of all processed 30.21 mg/100g at day 10 of storage. Our results indicated that shrimps in our study were in accordance with the recom- the TVB-N (24.21 mg/g) of treated shrimps with scCO2was mended daily intake (
Journal of Food Quality 9
Table 5: Recapitulation of quality parameter values in white shrimp (Litopenaeus vannamei) treated with high-pressure CO2.
Treatment (pressure (psi)/holding time (min))
Quality parameter
900/5 900/10 900/15 950/5 950/10 950/15 1100/5 1100/10 1100/15 Untreated
Moisture (%) 79.99 79.84 79.97 77.21 78.48 78.29 77.9 74.96∗ 74.38∗ 79.08
∗
Fat (%) 0.35 0.38 0.28 0.275 0.235 0.6 0.77 0.78∗ 0.77 0.28
Protein (%) 16.04∗ 18.11 16.75∗ 18.21 18.15∗ 16.78∗ 18.45 18.94 18.21 18,09
Hardness (kN/m2) 79.8 58.3 27.9 74.6∗ 69.9∗ 62 62.4 55.2 57.6 46.1
ΔL∗ value 51.65 54.15 59.1 53.75 52.05 54.9 59.75 56.75 61.35∗ 51.55
a∗ value 5.55 5.15 5.25 5 4.05 5.6 5.25 5.85∗ 7.1 4.15
Cholesterol (mg/g) 1.39∗ 1.27 1.46 1.47 1.39 1.36 ∗
1.46 1.48∗ 1.34∗ 1.63
Total carotene (mg/g) 3.8 3.78 3.79 3.77 3.76 3.69 2.51 2.37∗ 2.29∗ 4.24
Microbial reduction (log N/No) 0.98 0.979 0.974 0.974 0.969 0.952 0.803 0.805 0.793
40 HPCD slightly reduced volatile compounds [48, 49]. Chen
Ae
35 Ad Ad et al. [48] found no change in ester composition and slight
TVB-N (mg/100 g)
30 Ac change in alcohol and aldehydes in Hami melon juice after
25 treatment with HPCD at 35 MPa and 55oC for 60 min and
Ab Be four-week storage. Zhou et al. [50] found that low threshold
20 Bd Bd
15 Ba
was responsible for the changes in the odor/flavor of foods.
Bc The aroma of foods mostly generated from volatile com-
10 Bb
Aa pounds. In shrimps, volatile compounds can be come from
5
0 2 4 6 8 10 12 chemical reactions and enzymatic reactions, involving
Storage time (days) amino acids side chain of protein, carbohydrate, and lipid.
Untreated
When scCO2 was used, lipid and nonpolar amino acids were
Treated oxidized or extracted, enzymatic activation was changed,
and new volatile compounds in the food matrix can be
Figure 4: Changes of TVB-N during storage of untreated and produced. However, the volatile compound may be stripped
scCO2-treated shrimp at 4°C for 10 days. Different capital letters off during depressurized CO2, thereby having no effect on
indicate that the treatment had significant effect on TVB-N value
food odor. This was why the sensory panelists could not
(p < 0.05). The different lowercase letters indicate that storage time
had a significant effect on TVN value (p < 0.05). differentiate between the treated and untreated shrimps.
Kleekayai et al. [51] found that N- and S-containing com-
pounds with major volatile compounds, trimethylamine,
7.50 2,5-dimethylpyrazine, and dimethyl trisulfide, and nonpolar
Ab
Microbial count (log cfu/g)
Ab
7.00 Ab Ac compounds were responsible for the aroma of shrimps. In
6.50 Bc addition, aldehydes, ketones, and alcohols mostly produced
6.00 Aa
Aa
Bb Bb Bb from oxidative cleavages of lipids, and degradation of amino
acids and saccharides were also responsible for the shrimp
5.50
odor.
5.00 Ba Consumer acceptance test was performed by 20 students
Ba
4.50 from the departments. A 5-point hedonic scale was used to
4.00 evaluate overall acceptance and color, texture, and odor
0 2 4 6 8 10 12 acceptance (Figure 9). Any changes in the compounds re-
Storage time (days)
sponsible for the color, texture, and odor can lead to their
Untreated acceptance. It can be concluded that, among the samples,
Treated there was no hedonic difference in odor, color, and texture,
Figure 5: Changes of microbial count during storage of untreated as well as overall acceptance (p < 0.05). The score of overall
and scCO2-treated shrimps at 4°C for 10 days. Different capital acceptance was moderate (score of 3.8) for treated shrimp at
letters indicate that the treatment had significant effect on mi- eight-day storage. Sensory panelist acceptance to the sense of
crobial count (p < 0.05). The different lowercase letters indicate color was moderate (score of 3.8) for treated shrimp at eight-
that storage time had significant effect on microbial count day storage. However, acceptance of sensory panelists to
(p < 0.05). odor was neither like or dislike (score of 3.0) for treated
shrimp during storage at 4°C. The score of the sense of
texture given by sensory panelists was neither like or dislike
other samples at day 6 of storage. Similarly, Kincal et al. [47] (3.1) during storage at 4°C, but panelists accepted the sample
showed that the sensory panelists could not detect any more (score of 3.8, moderate) at eight-day storage.
significant aroma differences between the control frozen Figure 7 shows the lipid changes of scCO2-treated and
fresh orange juice and HPCD-treated orange juice after a untreated shrimps during storage. The result of analysis
two-week storage at 17oC. Some researchers showed that variance showed that both the scCO2 treatment and storage10 Journal of Food Quality
8 Aab
Aa Ab
7.8
7.6 Ba
7.4 Bab Ac
7.2
pH
7 Bb
Ad
6.8 Bd
6.6 Bd
Bc Ad
6.4
6.2
0 2 4 6 8 10 12
Storage time (days)
Untreated
Treated
Figure 6: Changes of pH during storage of untreated and scCO2-treated shrimps at 4°C for 10 days. Different capital letters indicate that the
treatment had significant effect on pH value (p < 0.05). The different lowercase letters indicate that storage time had significant effect on pH
value (p < 0.05).
25
20
Lipid (%, dry basis)
15
10
5
0
0 2 4 6 8 10 12
Storage time (days)
Untreated
Treated
Figure 7: Changes of total lipid during storage of untreated and scCO2-treated shrimps at 4°C for 10 days.
time did not significantly affect the total lipid during storage shrimp (Penaeus monodon) control samples did not
(p > 0.05). The same results were reported by Senapati et al. significantly change during 12 months of storage. In this
[52], which showed that the crude fat content of white-leg study, scCO2 treatment could potentially slow down the
shrimps (Litopenaeus vannamei) did not significantly mechanisms responsible for lipid damage in shrimps
change during 14 days of chilled storage. In this study, during storage at 4°C. Peroxide value is a product of lipid
supercritical CO2 treatment and low storage temperature autoxidation, which indicates the oxidation deterioration
could protect shrimp fat from hydrolysis; therefore, no level of lipid. Lipid deterioration is influenced by the
significant fat changes were found during storage at 4°C. oxygen presence, temperature, and light during the
Shrimp lipids, a nonpolar biomolecule, are reduced when storage of product [56–58]. Additionally, temperature
the shrimp is treated with scCO2, thereby preventing pos- affected PV value, which significantly increased when
sible hydrolysis during storage. Supercritical CO2 dissolves shrimps were kept under high temperature and in the
nonpolar or slightly polar compounds [4]. Additionally, presence of sunlight [59].Light catalyzes the oxidation of
lipid hydrolysis occurred rapidly at higher storage tem- lipid under photo-oxidation process. During photo-ox-
peratures, which increased free fatty acids, resulting in the idation, the energy of light is absorbed and turns the free
shrimps’ off odor [53, 54]. radical group, triplet oxygen into singlet oxygen, which
Figure 8 shows the peroxide value (PV) changes in easily reacts with unsaturated fatty acids and generates
scCO2-treated and untreated shrimps during storage. The hydrogen peroxide [60].
result of analysis of variance showed that scCO2 treat- It could be said that scCO2-treated shrimps were ac-
ment and storage time did not significantly affect the PV cepted by panelists until eight-day storage at 4oC and found
during storage (p > 0.05). Similar results were reported by no significant changes in quality degradation parameters
Minh et al. [55] that showed that the PV of black tiger responsible for shrimp deterioration.Journal of Food Quality 11
3.5
3.0
Peroxide value (%)
2.5
2.0
1.5
1.0
0.5
0.0
0 2 4 6 8 10 12
Storage time (days)
Untreated
Treated
Figure 8: Changes of peroxide value during storage of untreated and scCO2-treated shrimps at 4°C for 10 days.
Table 6: Duo-Trio test of untreated and treated shrimps with supercritical CO2 during storage at 4°C.
Day 0 Day 2 Day 4 Day 6 Day 8 Day 10
Parameters
463 198 257 671 553 879 611 537 227 983 265 871
Odor 13 10 10 13 12 11 10 13 11 12 12 11
Color 10 13 10 13 9 14 15 8 3 20∗ 11 12
Texture 15 8 11 12 13 10 16∗ 7 15 8 13 10
∗
The numbers followed by an asterisk ( ) were significantly different among other samples; code of untreated samples: 463, 257, 553, 611, 227, and 265; code of
samples treated with supercritical CO2: 198, 671, 879, 537, 983, and 871.
5.00 untreated shrimps possessed a texture significantly dif-
ferent from that of the other samples at six-day storage,
4.00
while scCO2-treated shrimps possessed a very significant
3.00 color difference compared with the other samples at eight-
Score
2.00 day storage.
It was found that scCO2-treated shrimps, at 1100 psi for
1.00
10 min, were accepted by panelists when stored up to eight
0.00 days. The results of this study provided useful information
Odor Color Texture Overall about the possibility of applying supercritical CO2 at 1100
acceptance
0d 6d psi for 10 min as an alternative method for preservation of
2d 8d shrimps.
4d 10 d
Figure 9: Consumer acceptance test of scCO2-treated shrimps Data Availability
during storage at 4°C by using a 5-point hedonic scale.
All data generated or analyzed during this study are included
4. Conclusions within the article.
Subcritical and supercritical CO2 did not affect the Conflicts of Interest
hardness and lightness of shrimps, indicating that the
quality of freshness of shrimps is maintained. However, The authors declare that there are no conflicts of interest
cholesterol reduction occurred at either the subcritical or
supercritical treatment. Supercritical CO2 treatment at Acknowledgments
1100 psi for 10 min was the best treatment recommended
for processing white shrimps. A storage study was per- The authors greatly thank Prof. Dr. Irwan Sukri Banuwa, the
formed to see the effectiveness of scCO2 treatment at 1100 Dean of the Faculty of Agriculture, University of Lampung,
psi for 10 min during storage. No significant changes were and Prof. Daniel Saputra, PhD at the University of Sriwijaya,
found in PV and lipid in untreated and scCO2-treated Palembang, Indonesia. This project was supported by the
shrimps, but the treatment significantly affected pH, Ministry of Research and Technology-National Research
TVBN, and microbial counts during storage. Among the and Innovation Agency (RISTEK-BRIN) (contract nos.
samples, there was no hedonic difference in odor, color, 4375/UN26.21/PN/2020 and 179/SP2H/AMD/LT/DRPM/
texture, and overall acceptance during storage. Moreover, 2020).12 Journal of Food Quality
References [16] G. Latimer, Official Methods of Analysis of AOAC
International, AOAC International, Rockville, MD, USA, 21st
[1] K. Manheem, S. Benjakul, K. Kijroongrojana, N. Faithong, edition, 2019.
and W. Visessanguan, “Effect of pre-cooking times on en- [17] National Standardization Body, SNI 2354.8-2009: Chemical
zymes, properties, and melanosis of Pacific white shrimp Test Method-Part 8: Determination of Total Volatile Base
during refrigerated storage,” International Aquatic Research, Nitrogen (TVB-N) and Trimethyl Amin Nitrogen (TMA-N)
vol. 5, no. 1, pp. 1–11, 2013. Levels in Fishery Products, National Standardization Body,
[2] N. Xu, W. Shi, X. Wang, and Z. Wang, “Effect of ice water Geneva, Switzerland, 2009.
pretreatment on the quality of Pacific White Shrimps ( [18] IFRA, Determination of the Peroxide Value, The International
Litopenaeus vannamei ),” Food Science & Nutrition, vol. 7, Fragrance Association, Geneva, Switzerland, 2019.
no. 2, pp. 645–655, 2019. [19] J. A. Dorado-Rodelo, J. M. Ezquerra-Brauer, and H. Soto-
[3] L. Laboureur, M. Ollero, and D. Touboul, “Lipidomics by Valdez, “Effect of ovenproof plastic films on the quality of
supercritical fluid chromatography,” International Journal of spotted rose snapper (Lutjanus guttatus) fillets during frozen
Molecular Sciences, vol. 16, no. 12, pp. 13868–13884, 2015. storage,” Packaging Technology and Science, vol. 20, no. 5,
[4] H. Monhemi and S. Dolatabadi, “Molecular dynamics sim- pp. 301–307, 2007.
ulation of high-pressure CO2 pasteurization reveals the in- [20] M. Meilgaard, G. V. Civille, and B. T. Carr, Sensory Evaluation
terfacial denaturation of proteins at CO2/water interface,” Techniques, CRC Press, Boca Raton, FL, USA, 4th edition,
Journal of CO2 Utilization, vol. 35, pp. 256–264, 2020. 2007.
[5] I. Higuera-Ciapara, A. R. Toledo-Guillen, L. Noriega-Orozco, [21] H. S. Youn, M. K. Roh, A. Weber, G. T. Wilkinson, and
K. G. Martinez-Robinson, and M. C. Esquade-Valle, “Pro- B. S. Chun, “Solubility of astaxanthin in supercritical carbon
dution of a low-cholesterol shrimp using supercritical ex- dioxide,” Korean Journal of Chemical Engineering, vol. 24,
traction,” Journal of Food Process Engineering, vol. 28, no. 5, no. 5, pp. 831–834, 2007.
pp. 526–538, 2005. [22] A. P. Sánchez-Camargo, H. A. Martinez-Correa, L. C. Paviani,
[6] A. E. Illera, M. T. Sanz, S. Beltrán, and O. Benito-Román, and F. A. Cabral, “Supercritical CO2 extraction of lipids and
“Effect of high pressure carbon dioxide on polyphenoloxidase astaxanthin from Brazilian redspotted shrimp waste (Far-
from Litopenaeus vannamei,” LWT, vol. 109, pp. 359–365, fantepenaeus paulensis),” Journal of Supercritical Fluids,
2019. vol. 56, no. 2, pp. 164–173, 2011.
[7] B. Zhang, L. K. Ma, S. G. Deng, C. Xie, and X. H. Qiu, “Shelf- [23] F. J. Pashkow, D. G. Watumull, and C. L. Campbell,
life of pacific white shrimp (Litopenaeus vannamei) as affected “Astaxanthin: a novel potential treatment for oxidative stress
by weakly acidic electrolyzed water ice-glazing and modified and inflammation in cardiovascular disease,” American
atmosphere packaging,” Food Control, vol. 51, pp. 114–121, Journal of Cardiology, vol. 101, no. 10 Suppl, pp. S58–S68,
2015. 2008.
[8] J. Li, W. Sun, H. S. Ramaswamy et al., “High pressure ex- [24] J. Li, C. Guo, and J. Wu, “Astaxanthin in liver health and
disease: a potential therapeutic agent,” Drug Design, Devel-
traction of astaxanthin from shrimp waste (Penaeus Van-
opment and Therapy, vol. 14, pp. 2275–2285, 2020.
namei Boone): effect on yield and antioxidant activity,”
[25] W. Yan, J. Cui, R. Dai, H. Wang, and X. Li, “Effects of dense
Journal of Food Process Engineering, vol. 40, no. 2, p. e12353,
phase carbon dioxide on quality and physical-chemical
2017.
properties of chilled pork,” Nongye Gongcheng Xuebao/
[9] T. Jantakoson, K. Kijroongrojana, and S. Benjakul, “Effect of
Transactions of the Chinese Society of Agricultural Engineering,
high pressure and heat treatments on black tiger shrimp
vol. 26, no. 7, pp. 346–350, 2010.
(Penaeus monodon Fabricius) muscle protein,” International [26] N. S. Tabitha and T. Anand, “Nutritive value of cultured white
Aquatic Research, vol. 4, no. 1, pp. 1–12, 2012. leg shrimp Litopenaeus vannamei,” International Journal of
[10] M. McHugh and V. Krukonis, Supercritical Fluid Extraction, Fisheries and Aquaculture, vol. 5, no. 7, pp. 166–171, 2013.
H. Brenner, Ed., Butterworth-Heinemann, UK, 2nd edition, [27] V. Venugopal, “Nutritional value of shrimp the popular
2013. shellfish,” EC Nutrition, vol. 02, pp. 1–9, 2020.
[11] B. Werner and J. Hotchkiss, “Modified atmosphere packaging,” in [28] C. Da Porto and A. Natolino, “Supercritical fluid extraction of
Microbiology of Fruits and Vegetables, M. G. Sapers, J. R. Gorny, polyphenols from grape seed (Vitis vinifera): study on process
and A. E. Yousef, Eds., CRC Press, Boca Raton, FL, USA, 1st variables and kinetics,” Journal of Supercritical Fluids, vol. 130,
edition, 2006. pp. 239–245, 2017.
[12] D. Saputra, “Puffing dehydrated vegetable with carbon di- [29] S. Sugiharto, N. Bintoro, J. Karyadi, and Y. Pranoto, “Su-
oxide,” in Jurnal Keteknikan Pertanian, pp. 157–165, 2006. percritical carbon dioxide pasteurization to reduce the activity
[13] M. Plascencia-Jatomea, G. Viniegra, R. Olayo, M. M. Castillo- of muscle protease and its impact on physicochemical
Ortega, and K. Shirai, “Effect of chitosan and temperature on properties of Nile tilapia,” Research Ideas and Outcomes,
spore germination of Aspergillus Niger,” Macromolecular vol. 6, p. 56887, 2020.
Bioscience, vol. 3, no. 10, pp. 582–586, 2003. [30] M. E. Kustyawati, F. Pratama, D. Saputra, and A. Wijaya,
[14] T. Saldanha, M. T. Benassi, and N. Bragagnolo, “Fatty acid “Viability of molds and bacteria in tempeh processed with
contents evolution and cholesterol oxides formation in Bra- supercritical carbon dioxides during storage,” International
zilian sardines (Sardinella brasiliensis) as a result of frozen Journal of Food Science, vol. 2018, 2018.
storage followed by grilling,” LWT-Food Science and Tech- [31] O. Erkmen, “Antimicrobial effects of pressurised carbon di-
nology, vol. 41, no. 7, pp. 1301–1309, 2008. oxide on Brochothrix thermosphacta in broth and foods,”
[15] H. D. de Holanda and F. M. Netto, “Recovery of components Journal of the Science of Food and Agriculture, vol. 80, no. 9,
from shrimp (Xiphopenaeus kroyeri) processing waste by pp. 1365–1370, 2000.
enzymatic hydrolysis,” Journal of Food Science, vol. 71, no. 5, [32] D. R. Pires, D. Morais, A. C. N. Coelho, A. F. Góes,
pp. C298–C303, 2006. L. C. D. S. A. Ferreira, and T. Saldanha, “NutritionalJournal of Food Quality 13
composition, fatty acids and cholesterol levels in Atlantic (Cucumis melo L.) juice treated with dense phase carbon
white shrimp (Litopenaeus schimitti),” International Food dioxide and stored at 4°C,” Innovative Food Science and
Research Journal, vol. 25, no. 1, pp. 151–157, 2018. Emerging Technologies, vol. 11, no. 4, pp. 623–629, 2010.
[33] S. M. Pourmortazavi, Z. Saghafi, A. Ehsani, and M. Yousefi, [49] L. Niu, X. Hu, J. Wu et al., “Effect of dense phase carbon
“Application of supercritical fluids in cholesterol extraction dioxide process on physicochemical properties and flavor
from foodstuffs: a review,” Journal of Food Science and compounds of orange juice,” Journal of Food Processing and
Technology, vol. 55, no. 8, pp. 2813–2823, 2018. Preservation, vol. 34, no. Suppl. 2, pp. 530–548, 2010.
[34] O. H. Nautiyal, “Review article food processing by super- [50] L. Zhou, X. Bi, Z. Xu, Y. Yang, and X. Liao, “Effects of high-
critical carbon dioxide-review,” EC Chemistry, vol. 2, no. 1, pressure CO2 processing on flavor, texture, and color of
pp. 111–135, 2016. foods,” Critical Reviews in Food Science and Nutrition, vol. 55,
[35] D. Kartono, J. A. B. Hardiyansyah, and A. Sulaeman, no. 6, pp. 750–768, 2015.
“Summary of recommended nutritional adequacy for Indo- [51] T. Kleekayai, S. Pinitklang, N. Laohakunjit, and
nesians,” in Proceedings of the Widyakarya Nasional Pangan W. Suntornsuk, “Volatile components and sensory charac-
Dan Gizi (WNPG) X, pp. 1–18, Jakarta, Indonesia, April 2017. teristics of Thai traditional fermented shrimp pastes during
[36] R. K. Eldiaz, A. Agustono, and K. T. Pursetyo, “The content of fermentation periods,” Journal of Food Science and Technol-
low density lipoprotein, high density lipoproteins, cholesterol ogy, vol. 53, no. 3, pp. 1399–1410, 2016.
on pen shells (Atrina pectinata) fish catch in kenjeran sur- [52] S. R. Senapati, G. P. Kumar, C. B. Singh et al., “Melanosis and
abaya,” Journal of Marine and Coastal Science, vol. 7, no. 2, quality attributes of chill stored farm raised whiteleg shrimp
p. 51, 2020. (Litopenaeus vannamei),” Journal of Applied and Natural
[37] N. Mezzomo and S. R. S. Ferreira, “Carotenoids functionality, Science, vol. 9, no. 1, pp. 626–631, 2017.
sources, and processing by supercritical technology: a review,” [53] J. Lu, M. Langton, S. Sampels, and J. Pickova, “Lipolysis and
Journal of Chemistry, vol. 2016, Article ID 3164312, 17 pages, oxidation in ultra-high temperature milk depend on sampling
2016. month, storage duration, and temperature,” Journal of Food
[38] S. A. Radzali, B. S. Baharin, and R. A. Rahman, “Optimisation Science, vol. 84, no. 5, pp. 1045–1053, 2019.
of supercritical fluid extraction of astaxanthin from Penaeus [54] C. Rivera-Pérez, F. L. Garcı́a-Carreño, and R. Saborowski,
monodon waste using ethanol-modified carbon dioxide,” “Purification and biochemical characterization of digestive
Journal of Engineering Science and Technology, vol. 11, no. 5, lipase in whiteleg shrimp,” Marine Biotechnology, vol. 13,
pp. 722–736, 2016. no. 2, pp. 284–295, 2011.
[39] K. Marszałek, Ł. Woźniak, B. Kruszewski, and S. Skapska, [55] N. P. Minh, T. Thi, Y. Nhi et al., “Quality of frozen black tiger
“The effect of high pressure techniques on the stability of shrimp (Penaeus monodon) under a low-density polyethylene
anthocyanins in fruit and vegetables,” International Journal of bag coextruded with butylated hydroxyanisole,” vol. 11, no. 4,
Molecular Sciences, vol. 18, no. 2, 2017. pp. 1483–1486, 2019.
[40] A. Molino, V. Larocca, G. Di Sanzo et al., “Extraction of [56] M. H. Gordon, “Factors affecting lipid oxidation,” in Un-
bioactive compounds using supercritical carbon dioxide,” derstanding and Measuring the Shelf-Life of Food, Woodhead
Molecules, vol. 24, no. 4, 2019. Publishing Limited, Sawston, UK, 2004.
[41] C. Niamnuy, S. Devahastin, and S. Soponronnarit, “Quality [57] D. R. Johnson and E. A. Decker, “The role of oxygen in lipid
changes of shrimp during boiling in salt solution,” Journal of oxidation reactions: a review,” Annual Review of Food Science
Food Science, vol. 72, no. 5, pp. S289–S297, 2007. and Technology, vol. 6, pp. 171–190, 2015.
[42] J. M. Jay, M. J. Loessner, and D. A. Golden, Modern Food [58] F. Kong and R. P. Singh, “Advances in instrumental methods
Microbiology, Springer US, New York, NY, USA, 7th edition, to determine food quality deterioration,” in Food and Bev-
2005. erage Stability and Shelf Life, Woodhead Publishing Limited,
[43] T. Yu, L. Niu, and H. Iwahashi, “High-pressure carbon di- Sawston, UK, 2011.
oxide used for pasteurization in food industry,” in Food [59] D. Y. Li, Z. Yuan, Z. Q. Liu et al., “Effect of oxidation and
Engineering Reviews, vol. 12, no. 3, pp. 364–380, 2020. maillard reaction on color deterioration of ready-to-eat
[44] L. Jin, G. Ding, P. Li, J. Gu, and X. Zhang, “Changes in quality shrimps during storage,” Lwt, vol. 131, Article ID 109696,
attributes of marine-trawling shrimp (Solenocera crassicornis) 2020.
during storage under different deep-frozen temperatures,” [60] H. H. Chang, Quantitative Changes of Volatile Compound in
Journal of Food Science and Technology, vol. 55, no. 8, Soybean and Algal Oil and Effects of Antioxidants on the
Oxidative Stability of Algal Oil under Light Storage, The Ohio
pp. 2890–2898, 2018.
State University, Columbus, OH, USA, 2011.
[45] X. Y. Dai, M. X. Zhang, X. Y. Wei, R. C. Hider, and T. Zhou,
“Novel multifunctional hydroxypyridinone derivatives as
potential shrimp preservatives,” Food and Bioprocess Tech-
nology, vol. 9, no. 7, pp. 1079–1088, 2016.
[46] H. Mu, H. Chen, X. Fang, J. Mao, and H. Gao, “Effect of
cinnamaldehyde on melanosis and spoilage of Pacific white
shrimp (Litopenaeus vannamei) during storage,” Journal of
the Science of Food and Agriculture, vol. 92, no. 10,
pp. 2177–2182, 2012.
[47] D. Kincal, W. S. Hill, M. Balaban et al., “A continuous high-
pressure carbon dioxide system for cloud and quality re-
tention in orange juice,” Journal of Food Science, vol. 71, no. 6,
pp. C338–C344, 2006.
[48] J. L. Chen, J. Zhang, L. Song, Y. Jiang, J. Wu, and X. S. Hu,
“Changes in microorganism, enzyme, aroma of hami melonYou can also read