Hydrochemical Processes and Isotopic Study of Geothermal Springs within Soutpansberg, Limpopo Province, South Africa - MDPI
←
→
Page content transcription
If your browser does not render page correctly, please read the page content below

applied
           sciences
Article
Hydrochemical Processes and Isotopic Study of
Geothermal Springs within Soutpansberg,
Limpopo Province, South Africa
Olatunde Samod Durowoju 1, * , Mike Butler 2 , Georges-Ivo Ekosse Ekosse 3 and
John Ogony Odiyo 1
 1    Department of Hydrology and Water Resources, University of Venda, Private Bag X5050,
      Thohoyandou 0950, South Africa; john.odiyo@univen.ac.za
 2    iThemba Labs, Environmental isotope laboratory, Private bag 11, Wits, Johannesburg 2050, South Africa;
      butler@tlabs.ac.za
 3    Directorate of Research and Innovation, University of Venda, Private Bag X5050,
      Thohoyandou 0950, South Africa; Georges-Ivo.Ekosse@univen.ac.za
 *    Correspondence: durotunde@gmail.com; Tel.: +27-780-642-299

 Received: 23 January 2019; Accepted: 27 February 2019; Published: 24 April 2019

 Abstract: Geothermal springs and boreholes within the Soutpansberg Group were sampled and
 analysed for their major ion chemistry and stable isotope compositions in order to ascertain the
 possible sources and geochemical processes of the waters. The temperature of the geothermal springs
 ranges from 41 ◦ C to 49 ◦ C (thermal/hot waters) and 53 ◦ C to 69 ◦ C (scalding/hyperthermal waters).
 The major water types are Na-Cl and Na-HCO3 , which are typical of marine and deep groundwaters
 influenced by ion-exchange processes. The hydrochemical parameters suggest that thermal gradient,
 carbonate weathering, mineral dissolution, ion exchange, and evaporation are the main geochemical
 processes controlling the geothermal springs. The δ18 O and δ2 H values vary from −5.82% to −4.82%
 for δ18 O and −33.5% to −24.6% for δ2 H for all the geothermal spring water. The isotopic ranges of
 the groundwater are relatively smaller and more depleted than those of rainwater (δ2 H = −9.8%
 and δ18 O = −2.7%). The δ2 H and δ18 O signatures reveal a significant infiltration before evaporation.
 The δ2 H and δ18 O values further confirm that the waters are of meteoric origin, which implies that
 modern rainfall is the fundamental component of recharge derived from the infiltration of local
 precipitation with significant contribution of another type of water in the deeper part of the aquifer.
 These results provide further insight into this basement aquifer, which is a vital resource for the region.

 Keywords: geochemical process; geothermal springs; meteoric origin; Soutpansberg; stable isotopes;
 water type

1. Introduction
     Geothermal springs are geological phenomena that occur in all parts of the world. They could be
of volcanic or meteoric origin [1,2] with uses ranging from power generation, industrial processing,
agriculture, aquaculture, bottled water, the extraction of rare elements, and the use of thermophilic
bacteria for industrial purposes, among others [1]. The socio-economic importance of geothermal
springs has fluctuated over time, but over the past few decades, there has been an unprecedented
resurgence of interest in this resource mainly due to a diversification in the application of the
waters [1–3].
     South Africa is richly endowed with geothermal springs with about 30% of these springs found in
Limpopo Province [1]. The geothermal springs in the Province were classified according to the residing
mountain—Waterberg Group, Soutpansberg Group, and Drakensberg Group [2]. For this study,

Appl. Sci. 2019, 9, 1688; doi:10.3390/app9081688                                   www.mdpi.com/journal/applsci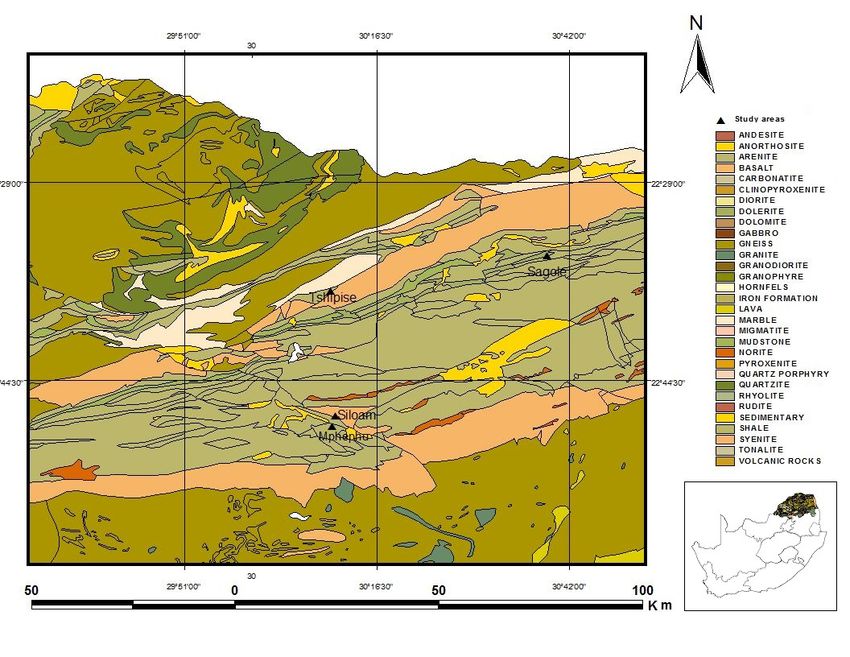
Appl. Sci. 2019, 9, x FOR PEER REVIEW 2 of 19
Appl. Sci. 2019, 9, 1688 2 of 18
residing mountain—Waterberg Group, Soutpansberg Group, and Drakensberg Group [2]. For this
study,
the the geothermal
geothermal springsthe
springs within within the Soutpansberg
Soutpansberg Group (BasinGroup
and (Basin and Karoo
Karoo Trough) wereTrough) were
investigated
investigated
(Figure (Figure
1). These 1). These geothermal
geothermal springs aresprings are associated
associated with faultswith
andfaults and impermeable
impermeable dykes and dykes
are
and are assumed to be of meteoric origin [1,3]. The optimal utilisation of geothermal
assumed to be of meteoric origin [1,3]. The optimal utilisation of geothermal springs is generally springs is
generally dependent
dependent upon theirupon theirand
physical physical andproperties,
chemical chemical properties, and additionally,
and additionally, the formation
the geological geological
formation
found at thefound
depth atof the depth
origin. of origin.
Individuals Individuals
have have utilised
utilised geothermal springgeothermal
waters for spring
differentwaters for
purposes
different
for many purposes for many
years, ranging fromyears, ranging
bathing, from bathing,
therapeutic, therapeutic,
religious, religious,
hygienic, and social hygienic,
purposes and social
in several
purposes
nations in in
theseveral
worldnations
[4,5]. in the world [4–5].
Figure 1. Hydrogeological map with Soutpansberg basin/Soutpansberg Karoo Trough located in the
Figure 1. part
northern Hydrogeological map
of South Africa, with Soutpansberg
showing the locationsbasin/Soutpansberg Karoo Trough located in the
of geothermal springs.
northern part of South Africa, showing the locations of geothermal springs.
Gonfiantini [6] reported that environmental hydrogen and oxygen isotopes are ideal tracers of
waterGonfiantini
systems since [6] reported that environmental
they are incorporated hydrogen
in the water and oxygen
molecules isotopestheir
and therefore are ideal tracers
behaviour of
and
water systems
variations reflectsince they are
the origin, theincorporated
hydrologicalin andthegeochemical
water molecules andthat
processes therefore their behaviour
affect natural and
water bodies.
variations reflect
Environmental the origin,
isotopes withthe hydrologicaldata
hydrochemical and are
geochemical
viable tools processes that affect natural
for understanding groundwaterwater
bodies. Environmental
dynamics isotopes with
within the Soutpansberg basinhydrochemical
because they providedata are viable
critical tools forabout
information understanding
sources of
groundwater recharge,
dynamicstimingwithinofthe Soutpansberg
recharge, basininteraction
water-rock because theyalong provide critical
flow paths, andinformation
mixing of
about sources
distinct of groundwater
groundwater bodies [7].recharge,
This is timing
despiteofthe recharge,
fact thatwater-rock
groundwater interaction along
is greatly flow by
affected paths,
the
and mixing of
geochemical distinct occurring
processes groundwater bodies
within the [7]. This is despite
groundwater the fact that
and interaction groundwater
with the aquiferismaterial
greatly
affectedto
leading byseasonal
the geochemical
and spatial processes occurring
variations within the groundwater
in the groundwater chemistry [8].and interaction
Hence, with the
the geochemical
aquifer material
characteristics of leading to seasonal
groundwater depend and
onspatial variations
the different in the groundwater
geochemical processes and chemistry
chemistry [8].ofHence,
water
thethe
at geochemical
recharge area characteristics
[9]. of groundwater depend on the different geochemical processes and
chemistry
Some ofstudies
water athavethe recharge area [9].out on Limpopo geothermal springs ranging from
been carried
Some studies
hydrogeology, water have
quality,been carried
impacts on theout on Limpopo
surrounding soils geothermal
and vegetation springs
[10–15], ranging from
and recently,
hydrogeology, water quality, impacts on the surrounding soils and vegetation
Durowoju et al. [16–18]. None of these studies elucidated the isotopic signatures in relation to the [10–15], and recently,
Durowoju et al.parameters
hydrochemical [16–18]. Noneof theofgeothermal
these studies elucidated
springs. There the
is a isotopic signatures in
need to understand therelation
groundwaterto the
hydrochemical
system and chemicalparameters
processesofgoverning
the geothermal
the resources springs.
such asThere is water
sources, a need to and
types, understand
groundwater the
groundwater system and chemical processes governing the resources such as
recharge, among others. The knowledge of the groundwater system and chemical processes will help to sources, water types,
and groundwater recharge, among others. The knowledge of the groundwater system and chemicalAppl. Sci. 2019, 9, 1688 3 of 18
improve on the sustainability and development of the water resources within the locality. Already, some
of the geothermal springs in Limpopo Province experience reduction in their yield and even dry up.
For example, the hottest geothermal spring in the country—found at Siloam village—has dried up.
Therefore, to avert these occurrences in the future, such studies have to be undertaken to improve
knowledge of the hydrogeological systems of the geothermal springs for effective sustainability of
the resources.
In order to increase the understanding of the geothermal spring systems, this study focuses
on delineation of geothermal systems by means of environmental stable isotope (2 H and 18 O)
and hydrochemical parameters in relation to geology of the area. Hence, this study is aimed at
understanding the geochemical processes and possible sources of these geothermal springs/boreholes
within Soutpansberg. The application of all these different methods to the hydrochemical and isotope
data allowed us to characterise the mechanisms of mineralisation of groundwater. Such knowledge is
important, particularly in providing relevant management options towards achieving the optimum
integrated water resources management. This will further result in the maximum exploration of
the potential of the geothermal spring water to be used for the benefits of the local communities
(for domestic and recreational purposes) in the future.
2. Study Area
Mphephu and Siloam, Sagole, and Tshipise springs are located in Makhado, Mutale, and Musina
municipalities, respectively, in Vhembe District, Limpopo Province of South Africa (Figure 1). The study
areas fall under quaternary catchments of the Nzhelele River catchment (within the Soutpansberg
Group), which is in the northern region of Limpopo Province, South Africa [19]. The coordinates,
altitudes, and geological structures associated with the springs are presented in Table 1.
Table 1. Geographical coordinates, altitudes, and geological structures associated with springs.
Sampling Site Sites Coordinates Altitude (m) Surface Geology and Geological Structures
Quartzite and Sandstone
30◦ 100 35.582” E
Mphephu 890 Reverse fault between Waterberg Group
22◦ 540 26.280” S
quartzite and Dominion Reef lava
Mudstone, shale, subordinate micaceous
sandstone, carbonaceous shale, siltstone,
30◦ 390 07.128” E
Sagole 450 micaceous sandstone. Mikambeni Formation
22◦ 310 49.440” S
and Madzaringwe Formation, Karoo
Supergroup
30◦ 100 59.988” E Basalt, minor tuff
Siloam 835
22◦ 520 58.800” S Sibasa Formation, Soutpansberg Group
Basalt, minor andesite, cream-coloured
30◦ 100 20.712” E sandstone, dolerite sills, and dykes
Tshipise 520
22◦ 360 31.320” S Intersection of 2 post-Permian faults in upper
Karoo
According to the Geological Survey: 1:250 000 Messina; Kent [1,20]; Olivier et al. [3].
Groundwater occurrence is mainly related to secondary hydrogeological features; that is, fault and
joints, which present preferential pathways and thus enhance the potential for groundwater flow in the
region. The geology determines the extent to which the reaction with the host rock proceeds depending
on the chemical composition of the rock and the rate at which water passes through the rock.
2.1. Climate of the Study Area
The studied areas were categorised under the hot semi-arid region [21]. It receives much of its
rainfall during summer (November to February), as the area is within the northward and southward
oscillation of the inter-tropical convergence zone (ITCZ) and is associated with southerly monsoonAppl. Sci. 2019, 9, 1688 4 of 18
Appl. Sci. 2019, 9, x FOR PEER REVIEW 4 of 19
oscillation
winds. The of thewere
areas inter-tropical convergence
characterised zone (ITCZ)variations
by high-temperature and is associated with
in different southerly
seasons of the monsoon
year with
winds. The areas were characterised by ◦ high-temperature
◦ variations in different
◦
temperatures in winter ranging from 16 C to 22 C, and in summer from 22 C to 40 C (Figure seasons
◦ of the
2) year
[22].
with temperatures in winter ranging from 16 °C to 22 °C, and in summer from 22 °C to
The mean annual rainfall of Nzhelele ranges from 350–400 mm per annum [19]. More than 80% of the 40 °C (Figure
2) [22]. The
rainfall mean
occurs annual
in the rainfall
summer, andof Nzhelele
only ranges
about 20% fromin350–400
occurs mm[23].
the winter per annum [19]. More than
80% of the rainfall occurs in the summer, and only about 20% occurs in the winter [23].
Figure 2. Average temperature and rainfall within the study areas over the past 100 years (1916–2016)
Figure 2. Average temperature and rainfall within the study areas over the past 100 years (1916–2016)
(extracted from http://www.weatherbase.com).
(extracted from http://www.weatherbase.com).
2.2. Geology of Study Area
2.2. Geology of Study Area
The study area is underlain by block-faulted Karoo Supergroup and Soutpansberg Supergroup
rocksThe study
in the area ispart
northern underlain
of the by block-faulted
Limpopo Province Karoo
(FigureSupergroup
3). Theseand Soutpansberg
rocks have very low Supergroup
primary
rocks in the northern part of the Limpopo Province (Figure 3). These rocks
porosity, permeability, and storage capacity, with limited groundwater flow [24]. Mphephu geothermal have very low primary
porosity,
spring permeability,
is underlain and storage
by Wyllie’s Poort capacity,
and Nzhelele withFormations
limited groundwater flow [24].Supergroup.
of the Soutpansberg Mphephu
geothermal spring is underlain by Wyllie’s Poort and Nzhelele Formations
These lithologies are mainly comprised of sandstone and quartzite (Table 1). Mphephu geothermal of the Soutpansberg
Supergroup.
spring These lithologies
is associated are mainly
with the Nzhelele Faultcomprised
[25]. of sandstone and quartzite (Table 1). Mphephu
geothermal spring
The Sagole is associated
geothermal with
spring the Nzhelele
is associated with Fault [25]. Tshipise Fault, which lies in the contact
the Klein
The Sagole geothermal spring is
zone between Karoo and Soutpansberg Supergroups. To associated with thetheKlein
southTshipise Fault,iswhich
of the fault lies in
the basalt the
of the
contact zone
Musekwa between
Member of theKaroo and Formation,
Nzhelele Soutpansberg andSupergroups.
to the north of To thethe south
fault of sedimentary
are the the fault is the basalt
rocks of
of the
the Musekwa Member of the Nzhelele Formation, and to the north
Madzaringwe and Mikambeni Formations of the Karoo Supergroup. The Mikambeni Formation consistsof the fault are the sedimentary
rocks
of of the shale,
mudstone, Madzaringwe
and laminatedand Mikambeni
sandstone (Table Formations
1), whereas of the
the Karoo Supergroup.
Madzaringwe FormationThe isMikambeni
comprised
of alternating sandstone, siltstone, and shale (Table 1), with sporadically occurring coal seams [26]. the
Formation consists of mudstone, shale, and laminated sandstone (Table 1), whereas
Madzaringwe
The SiloamFormation
geothermal is spring
comprised of alternating
is found in the Nzhelele sandstone,
Valley siltstone,
at Siloam and shale
Village, (Table
which falls1),under
with
sporadically occurring coal seams [26].
the youngest formation of the Soutpansberg Group, which is the Sibasa Formation. It is dominated
The Siloam
by basalt, geothermalfrom
which originated springtheislavafound in base
at the the Nzhelele Valley at Basalt
of the formation. SiloamisVillage,
responsible which forfalls
the
more undulating topography to the south of the Soutpansberg [27]. There are dark-red shales It
under the youngest formation of the Soutpansberg Group, which is the Sibasa Formation. andis
dominated that
sandstones by are
basalt,
fine, which originated
thinly-bedded from the
sandstones. lavais at
There an the base of
interlayer the ignimbrite,
of tuff, formation. and Basalt is
chert,
responsible for the more undulating topography to the south of the Soutpansberg
and in some places, tuffaceous shale [28]. Various types of conglomerates are also available, such as [27]. There are
dark-red shales
argillaceous andand sandstones
arenaceous that
types. Thearemudstone
fine, thinly-bedded
and siltstone sandstones. There Member
of Delvis Gully is an interlayer of tuff,
also exist [28].
ignimbrite,
Siloam andischert,
Village and in some
characterised places, tuffaceous
by fractured aquifers ofshale [28]. Various
sandstone types of conglomerates
where groundwater occurs. are
also Tshipise
available,geothermal
such as argillaceous and arenaceous types. The mudstone and
spring is underlain by basalt and minor andesite of the Letaba Formation of siltstone of Delvis
Gully Member also
Lebombo Group and Karoo exist [28]. Siloam Village
Supergroup. is characterised
The Lebombo by fractured
Group rests aquifersmember
on the Tshipise of sandstone
of the
where groundwater occurs.Appl. Sci. 2019, 9, x FOR PEER REVIEW 5 of 19
Appl. Sci. 2019, 9, 1688 5 of 18
Tshipise geothermal spring is underlain by basalt and minor andesite of the Letaba Formation
of Lebombo Group and Karoo Supergroup. The Lebombo Group rests on the Tshipise member of the
Clarence
ClarenceFormation,
Formation,which
whichis is
comprised
comprised of of
white
whiteto cream-coloured sandstones.
to cream-coloured These
sandstones. lithologies
These are
lithologies
intruded upon by Karoo dolerite dykes and sills with strongly developed faults [26].
are intruded upon by Karoo dolerite dykes and sills with strongly developed faults [26]. The The Tshipise
thermal
Tshipisespring occurs
thermal at the
spring intersection
occurs of two post-Permian
at the intersection faults in Upper
of two post-Permian faults Karoo, one
in Upper of which
Karoo, one is
of
the Tshipise
which is theFault [15].Fault [15].
Tshipise
Figure 3. Geology map showing the geothermal springs within the Soutpansberg Group.
3. Materials and Methods
Figure 3. Geology map showing the geothermal springs within the Soutpansberg Group.
3.1. Sampling and Sample Pretreatment
3. Materials and Methods
Water samples were collected at Siloam and Tshipise geothermal springs during winter and
summer seasons
3.1. Sampling andfrom October
Sample 2016–July 2017. The samples were collected thrice per season to include
Pretreatment
seasonality [29]. The geothermal water/borehole samples were collected at the source using acid-washed
Water samples were collected at Siloam and Tshipise geothermal springs during winter and
high-density polyethene (HDPE) containers, chilled to between 3 ◦ C to 5 ◦ C [30], and dispatched in
summer seasons from October 2016–July 2017. The samples were collected thrice per season to
a cooler box to Agricultural Research Council (ARC-ISCW) laboratory, Pretoria. The samples were
include seasonality [29]. The geothermal water/borehole samples were collected at the source using
allowed to cool before pre-treatment due to the high temperature of water. The HDPE containers were
acid-washed high-density polyethene (HDPE) containers, chilled to between 3 °C to 5 °C [30], and
rinsed properly with spring water to avoid cross-contamination. Water temperatures together with
dispatched in a cooler box to Agricultural Research Council (ARC-ISCW) laboratory, Pretoria. The
other physical parameters such as pH, electrical conductivity (EC), and total dissolved solids (TDS)
samples were allowed to cool before pre-treatment due to the high temperature of water. The HDPE
were measured in the field using portable multi-sensor meter (Multi 340i/SET, USA) as suggested by
containers were rinsed properly with spring water to avoid cross-contamination. Water
the American Public Health Association [31].
temperatures together with other physical parameters such as pH, electrical conductivity (EC), and
totalAnalytical
3.2. dissolved solids (TDS) were measured in the field using portable multi-sensor meter (Multi
Methods
340i/SET, USA) as suggested by the American Public Health Association [31].
Samples were analysed for hydrochemical parameters in the laboratory using the standard
recommended
3.2. Analytical methods
Methods [31]. The sample pH, sodium absorption ratio (SAR), alkalinity, and temporary
hardness were determined using ManTech Titrasip Autotitrator (Guelph, Ontario NIH6J2, Canada).
Samplesfor
The samples were analysed
anions (F− , Clfor hydrochemical
− , NO − 2− parameters
3− −in the laboratory using the
+ standard
+ 2+
3 , SO4 , PO4 , HCO3 ) and major cations (Na , K , Ca ,
recommended
2+ methods [31]. The sample pH, sodium absorption ratio (SAR), alkalinity,
and Mg ) analyses were filtered and analysed using the ion chromatography method (Dionex Model and
temporary
DX 500) (1228hardness
Titan way,were determined
Sunnyvale, using ManTech
CA 94088-3603). QualityTitrasip Autotitrator
assurance/quality (Guelph,
control Ontario
(QA/QC) wasAppl. Sci. 2019, 9, 1688 6 of 18
incorporated into geothermal spring water sampling and analyses to enhance sample integrity, increase
the confidence of analytical data as reliable analytical information, and prevent reporting wrong
positive values caused by contamination. Field blank and splits were ensured for the water samples.
The instruments used were calibrated with a standard solution to avoid analytical errors. The method
detection limit (MDL) for each cation was obtained by US EPA method 200.8 [32]. The MDLs for each
cation were 0.03 µg/L (Na+), 0.07 µg/L (Mg2+ ), 0.4 µg/L (K+ ), and 0.03 µg/L (Ca2+ ). The MDLs for
each anion were determined according to US EPA method 300.0, rev 2.1 [33] accuracy measurements
methodology. The MDLs for each anion were 25 µg/L (F− ), 12.5 µg/L (NO3 − ), 500 µg/L (Cl− ), 125 µg/L
(SO4 2− ), and 150 µg/L (PO4 3− ). The samples were analysed in triplicate to obtain the mean values of
the concentrations
Stable isotopes analyses of the samples were performed using Thermo Delta V mass spectrometer
connected to a Gasbench at Environmental Isotope Laboratory (EIL) iThemba LABS Johannesburg,
South Africa. Samples were flushed using a mixture of either H2 or CO2 in He, which was also used
as the equilibration gas. The water samples were equilibrated along with platinum (Pt) catalyst in
preparation for deuterium measurements [34]. The equilibration time of the water samples with
hydrogen gas was 40 mins, whereas carbon dioxide gas was equilibrated with water samples in about
20 h. Laboratory standards calibrated against international reference materials were analysed with
each batch of the samples.
Conventionally, the isotope ratios of 2 H/1 H and 18 O/16 O in the water samples were expressed as
per mil (%) deviation relative to the Standard Mean Ocean Water (SMOW) as follows:
RsampLe − Rsmow
δ (%0) = × 1000 (1)
Rsmow
where R represents the ratio of heavy to light isotopes (D/H or 18 O/16 O) in the sample and standard,
respectively. The oxygen and hydrogen isotopic ratios were henceforth expressed individually as δ18 O
and δ2 H, respectively, or collectively as δ values. Total analytical precisions were estimated at 0.2%
for δ18 O and 0.8% for δ2 H. The generated Thohoyandou local meteoric water line (TLMWL) [35] was
used for the interpretation of the isotopic composition of the geothermal springs.
The chloro-alkaline indices CAI 1, 2 indicate the possible ion exchange reaction between
groundwater and the host environment, as suggested by Schoeller [44]. Chloro-alkaline indices
used in the evaluation of base exchange were calculated using Equations (2) and (3):
CAI-1 = Cl − (Na + K)/Cl (2)
CAI-2 = Cl − (Na + K)/(SO4 + HCO3 + NO3 ) (3)
All values from chemical analyses were presented as mean values and standard deviation
using Microsoft Office Excel 2018. Data presentations were made using tables and graphs.
Pearson’s correlation coefficient was used to test the relationship between hydrochemical parameters
and isotopic compositions at α = 0.05 level of significance.
4. Results and Discussion
4.1. Physiochemical and Hydrochemical Parameters of the Geothermal Springs
The chemical composition of groundwater was not uniform but varied over a wide range.
This implies that the groundwater was heterogenous in composition. Results show that geothermal
spring water was more mineralised than thermal boreholes. This phenomenon supports the previous
findings by Todd [36] and Olivier et al. [15]. This could be attributed to the rock-water interaction
in the deeper aquifer resulting in higher mineralisation. The water temperature of springs in the
study area ranged between 41.3 ◦ C and 67.7 ◦ C (Table 2). Based on Taylor and Phillips classification,Appl. Sci. 2019, 9, 1688 7 of 18
Siloam hot boreholes (SH1 and SH2), Mphephu, and Sagole springs are thermal (hot) waters with
temperatures ranging between 41 ◦ C to 49 ◦ C. Siloam and Tshipise geothermal springs can be classified
as scalding (hyperthermal) with temperatures ranging between 53 ◦ C and 69 ◦ C. There is approximately
1 ◦ C seasonal difference in the thermal property of the geothermal spring in summer compared
to winter. The high temperature in summer results in more transfer of moisture (evaporation and
evapotranspiration) to the atmosphere until the dew point is reached, hence there is potential to rain
more intensely in summer, resulting in more dissolution of minerals in the water. The statistical results
of the hydro-chemical and isotopic analyses for the studied geothermal springs and boreholes within
Soutpansberg Group are shown in Table 2.
Guidelines for Domestic Water Quality [37] delineate values of 7–9, except for Siloam geothermal
spring water (SAW) and Siloam hot borehole (SH2), which had pH values of 9.39 and 9.19, respectively.
The TDS values were generally less than 450 mg/l, ranging from 120.84 to 390.61 mg/l for all the samples
with a slight difference with respect to seasons. Therefore, the TDS values fell within the South African
Guidelines for Domestic Water Quality [37] value of 450 mg/L. However, previous studies showed that
the TDS values for Tshipise geothermal spring were higher than 450 mg/L [15,18], which is contrary
to the present findings. This could be a result of the decrease in water temperature (decreasing from
58 ◦ C from Olivier et al. (2011) to 55.7 ◦ C in the present study) of the spring and mixing of different
water types.
The dominant ionic compositions found in the studied site waters were sodium (Na+ ), bicarbonate
(HCO3 − ), sulphate (SO4 2− ), and chloride (Cl− ) (Table 2). That is, the water was rich (high concentrations)
in those dominant ions. The high Na+ concentrations probably originated from chemical weathering
processes of sodium-rich plagioclase feldspars in the sandstone and shale. The general order of
dominant cations is Na+ > Ca2+ > K+ > Mg2+ , and the sequence of the abundance of the anions are
in the order: Cl− > SO4 2− > HCO3 − > F− > NO3 − > PO4 3− . The Piper and Durov diagrams were
used to assess the water types and geochemical processes leading to the respective water types [38,39].
Piper diagram can classify into six fields, which are: 1) Ca-HCO3 type; 2) Na-Cl type; 3) Ca-Mg-Cl
type; 4) Ca-Na-HCO3 type; 5.) Ca-Cl type; and 6) Na-HCO3 type [38]. The Piper diagram revealed that
most of the geothermal spring water fell in the Na-Cl water type, except the Siloam geothermal spring
(SAW-WT29 and WT30) fell into the Na-HCO3 water type (Figure 4). Although this study supports the
recent findings by Durowoju et al. [18], it contradicts Olivier et al. [15], which reported NaHCO3 and
Na-Ca-HCO3 water types for Sagole and Mphephu springs, respectively.
The findings from the Piper diagram were further substantiated with Durov’s plot to understand
the geochemical processes leading to various water types. The discrepancy in the water type could be
attributed to sample size, sample preparation, and instruments used in the previous studies. Na-Cl
water type was dominated by Na+ and Cl- derived from Na-Cl brines in winter and summer seasons,
which were linked to the underlying geology emanating from gneissic rocks. Na-Cl and Na-HCO3
water types showed a typical marine and deeper ancient groundwater influenced by ion exchange.
The Na-HCO3 water type from Siloam geothermal spring showed that the spring emanated from basalt
rocks. It was the most evolved of the waters and derived their Na+ from cation exchange of Ca2+ for
Na+ and K+ as well as dissolution of rock mineral (plagioclase) [40].
The Durov diagram corroborated the findings from the Piper diagram (Figure 4). Most of the
geothermal springs/groundwater aquifer were dominated by Cl and Na, and the water could result
from reverse ion exchange of Na-Cl waters, consequently making the water type Na-Cl, as observed in
the Piper diagram. As observed from the Piper diagram, SAW had a Na-HCO3 water type, which was
formed as a result of the reverse ion exchange of Na-Cl waters, making Cl the dominant anion and Na
the dominant cation and resulting in the water Na-HCO3 (Figure 5). Hence, the major water types
were Na-Cl and Na-HCO3 , which are typical of marine and deep/deeper groundwaters influenced by
ion-exchange processes, as explained earlier.Appl. Sci. 2019, 9, 1688 8 of 18
Table 2. Statistical summary of hydrochemical and isotopic compositions of studied geothermal springs.
SAGOLE TSHIPISE MPHEPHU SILOAM
SGW SGS TSW TSS MPW MPS SAW SH1 SH2
Temp (◦ C) 42.4 ± 1.45 44.8 ± 2.12 54.6 ± 2.26 55.4 ± 2.21 41.3 ± 1.23 42.7 ± 1.01 67.7 ± 1.68 45.2 ± 0.00 48.4 ± 0.01
pH 8.82 ± 0.95 7.98 ± 0.22 8.46 ± 0.22 8.47 ± 0.21 8.05 ± 0.02 8.15 ± 0.07 9.39 ± 0.06 8.86 ± 0.00 9.19 ± 0.10
SAR 33.88 ± 546 19.20 ± 15.48 25.75 ± 0.98 25.45 ± 1.29 2.07 ± 0.06 2.18 ± 0.06 7.39 ± 0.04 17.25 ± 0.00 19.04 ± 0.02
EC (µS/cm) 330 ± 0.00 347.33 ± 16.17 746.67 ± 5.77 745 ± 7.07 335 ± 7.07 365 ± 21.21 340 ± 2.07 630 ± 0.00 330 ± 0.00
TDS (mg/L) 133.13 ± 1.85 196.70 ± 122.43 377.48 ± 5.36 390.61 ± 7.63 124.38 ± 1.41 120.84 ± 1.19 215.18 ± 9.25 305 ± 0.00 130.12 ± 0.00
Alkalinity (mg/L) 10.50 ± 4.24 6.50 ± 5.89 11.12 ± 0.54 10.75 ± 0.35 12.50 ± 0.00 6.00 ± 8.49 107.52 ± 1.36 10 ± 0.00 12 ± 0.00
Na (mg/L) 64.20 ± 1.84 57.13 ± 11.98 157.67 ± 4.51 154.50 ± 4.95 42.50 ± 1.27 42.35 ± 1.06 78.77 ± 7.54 118 ± 0.00 62.7 ± 0.00
K (mg/L) 1.98 ± 0.01 2.04 ± 0.05 4.55 ± 0.06 4.84 ± 0.05 2.06 ± 0.04 2.11 ± 0.01 2.61 ± 0.06 2.73 ± 0.00 2.21 ± 0.01
Ca (mg/L) 0.29 ± 0.11 4.27 ± 6.61 2.84 ± 0.07 2.79 ± 0.10 12.20 ± 0.00 11.90 ± 0.28 5.69 ± 0.05 3.53 ± 0.00 0.81 ± 0.00
Mg (mg/L) 0.00 ± 0.00 3.47 ± 6.00 0.00 ± 0.00 0.00 ± 0.00 10.50 ± 0.00 10.35 ± 0.07 1.04 ± 0.08 0 ± 0.00 0 ± 0.00
F (mg/L) 0.77 ± 0.15 2.60 ± 1.71 5.01 ± 0.63 5.98 ± 0.08 2.69 ± 0.01 4.16 ± 2.48 6.51 ± 0.08 4.55 ± 0.00 4.95 ± 0.00
NO3 (mg/L) 0.99 ± 0.36 1.71 ± 0.85 2.13 ± 1.80 5.85 ± 1.48 3.02 ± 0.40 6.25 ± 3.23 0.60 ± 0.03 0.17 ± 0.00 1.31 ± 0.00
Cl (mg/L) 41.34 ± 0.30 81.15 ± 75.10 151.86 ± 0.28 156.67 ± 0.02 33.90 ± 0.06 98.82 ± 86.34 24.11 ± 0.77 153.3 ± 0.00 38.9 ± 0.00
SO4 (mg/L) 16.95 ± 0.54 27.89 ± 27.23 45.81 ± 2.15 51.78 ± 0.42 9.21 ± 0.03 21.14 ± 18.31 8.99 ± 0.06 16.45 ± 0.00 10.55 ± 0.00
PO4 (mg/L) 0.92 ± 0.82 1.30 ± 2.14 1.38 ± 1.22 2.14 ± 1.46 1.28 ± 0.74 2.26 ± 3.09 0.42 ± 0.06 1.15 ± 0.00 1.52 ± 0.00
CO3 (mg/L) 1.50 ± 2.12 0.00 ± 0.00 0.58 ± 0.50 0.60 ± 0.42 0.00 ± 0.00 0.00 ± 0.00 16.13 ± 0.41 1.8 ± 0.00 2.4 ± 0.00
HCO3 (mg/L) 9.76 ± 0.86 7.93 ± 7.19 12.38 ± 0.37 11.90 ± 0.43 15.25 ± 0.00 7.32 ± 10.35 98.75 ± 2.08 8.54 ± 0.00 9.76 ± 0.00
δ18 O (%) −5.82 −5.08 −5.73 −4.98 −4.92 −4.82 −5.41 −5.34 −5.25
δ2 H (%) −30.7 −30.4 −33.5 −33.2 26.1 −24.6 −27.2 −27.14 −27.46
CAI-1 −0.6 0.27 −0.07 −0.02 −0.31 0.55 −2.38 0.21 −0.67
CAI-2 −0.85 0.59 −0.17 −0.04 −0.39 1.57 −0.46 1.21 −1.08
Sample codes: TSS -Tshipise spring summer (WT01, WT03, WT05), TSW-Tshipise spring winter (WT22, WT26), SAW-Siloam geothermal spring (WT29, WT30), SH1 and SH2—Siloam hot
boreholes, MPS-Mphephu spring summer (WT17, WT19), MPW-Mphephu spring winter (WT23, WT27), SGS-Sagole spring summer (WT09, WT11), SGW- Sagole spring winter (WT24,
WT25, WT28).summer seasons, which were linked to the underlying geology emanating from gneissic rocks.
Na-Cl and Na-HCO3 water types showed a typical marine and deeper ancient groundwater
influenced by ion exchange. The Na-HCO3 water type from Siloam geothermal spring showed that
the spring emanated from basalt rocks. It was the most evolved of the waters and derived their Na+
from
Appl. Sci. 2019,cation
9, 1688 exchange of Ca2+ for Na+ and K+ as well as dissolution of rock mineral (plagioclase)
9 of 18 [40].
5
3
1 2
4
6
Appl. Sci. 2019, 9, x FOR PEER REVIEW 2 of 19
Figure 4. Piper diagram of geothermal springs within Soutpansberg Group.
Figure 4. Piper diagram of geothermal springs within Soutpansberg Group.
The Durov diagram corroborated the findings from the Piper diagram (Figure 4). Most of the
geothermal springs/groundwater aquifer were dominated by Cl and Na, and the water could result
from reverse ion exchange of Na-Cl waters, consequently making the water type Na-Cl, as observed
in the Piper diagram. As observed from the Piper diagram, SAW had a Na-HCO3 water type, which
was formed as a result of the reverse ion exchange of Na-Cl waters, making Cl the dominant anion
and Na the dominant cation and resulting in the water Na-HCO3 (Figure 5). Hence, the major water
types were Na-Cl and Na-HCO3, which are typical of marine and deep/deeper groundwaters
influenced by ion-exchange processes, as explained earlier.
Appl. Sci. 2019, 9, x; doi: FOR PEER REVIEW www.mdpi.com/journal/applsci
Figure 5. Durov diagram of geothermal springs within Soutpansberg Group.
Figure 5. Durov diagram of geothermal springs within Soutpansberg Group.
There was no variation in the water type with varying seasons for the studied geothermal
springs/groundwater. The Na+in
There was no variation and
theHCO
−
3 ions
water typewere
withalso present,
varying making
seasons forthe
thewater typegeothermal
studied fall under
class C (temporary hardThe
springs/groundwater. carbonate
Na+ andwater)
HCO3[41], aswere
− ions reported by Olivier
also present, et al. [15].
making Hence,
the water the fall
type presence
under
class C (temporary hard carbonate water) [41], as reported by Olivier et al. [15]. Hence, the presence
of Na+ in groundwater in the area was due to water-rock interaction as a result of oxidisation and
evapotranspiration processes. These findings supported the previous studies by Olivier et al. [15]
and Durowoju et al. [18].
The processes controlling geothermal spring water/groundwater chemistry were demonstratedAppl. Sci. 2019, 9, 1688 10 of 18
of Na+ in groundwater in the area was due to water-rock interaction as a result of oxidisation and
evapotranspiration processes. These findings supported the previous studies by Olivier et al. [15] and
Durowoju et al. [18].
The processes controlling geothermal spring water/groundwater chemistry were demonstrated
by Gibbs [42]. The Gibbs plot provided vital information on the mechanism (precipitation, rock-water
interaction, or evaporation) controlling groundwater systems by plotting the EC against Na/(Na +
Ca) and Cl/(Cl + HCO3 ). Figure 6 shows all the geothermal spring water/groundwater samples in
the study area plot in the rock water interaction zone, as reported by Durowoju et al. [18], for Siloam
and Tshipise springs. It implied that the groundwater chemistry in the studied areas was controlled
mainly by the rock-water interaction process, leading to chemical weathering of the rock-forming
minerals. This implied that weathering of the aquifer material was the dominant process controlling
the chemistry of the springs, resulting in the chemical budget of this water [43]. Along the path of
groundwater movement from recharge to discharge areas, several chemical reactions took place with
the solid phase. These chemical reactions varied temporally and spatially depending on the chemical
Appl. Sci.of2019,
nature the9,initial
x FOR water,
PEER REVIEW
geological formations, and residence time. 3 of 19
Figure 6. Mechanism controlling chemistry of the geothermal springs and other
Figure 6. Mechanism controlling chemistry of the geothermal springs and other
groundwaters—Gibbs plot.
groundwaters—Gibbs plot.
In order to assess the major functional source of the dissolved solid in the groundwater, a plot
In order to assess the major functional source of the dissolved solid in the groundwater, a plot
of (Ca + Mg) against (HCO3 + SO4 ) was done to show the distribution of geothermal water between
of (Ca + Mg) against (HCO3 + SO4) was done to show the distribution of geothermal water between
silicate and carbonate weathering in the system (Figure 7). The plot distinguished between carbonate
silicate and carbonate weathering in the system (Figure 7). The plot distinguished between carbonate
and silicate weathering controlling factors. The water samples fell below and above the 1:1 line, which
and silicate weathering controlling factors. The water samples fell below and above the 1:1 line,
showed that they were in the field of silicate weathering and carbonate weathering, respectively
which showed that they were in the field of silicate weathering and carbonate weathering,
(Figure 7). This contradicted findings from Durowoju et al. [18], which reported that Siloam and
respectively (Figure 7). This contradicted findings from Durowoju et al. [18], which reported that
Tshipise geothermal springs fell in the silicate weathering zone. However, most of the samples fell
Siloam and Tshipise geothermal springs fell in the silicate weathering zone. However, most of the
above the 1:1 line due to the effects of the reverse ion exchange in the system (carbonate weathering),
samples fell above the 1:1 line due to the effects of the reverse ion exchange in the system (carbonate
which supported the Gibb’s diagram. The plotted results of Mphephu geothermal spring (MPW and
weathering), which supported the Gibb’s diagram. The plotted results of Mphephu geothermal
MPS) fell below the 1:1 line, demonstrating the minor ion exchange process. The fact that the ions
spring (MPW and MPS) fell below the 1:1 line, demonstrating the minor ion exchange process. The
exchange processes between groundwater and the aquifer materials were relatively high was in good
fact that the ions exchange processes between groundwater and the aquifer materials were relatively
agreement with the Gibb’s diagram.
high was in good agreement with the Gibb’s diagram.
Among chloro-alkaline indices, CAI-1 varied from (−2.38) to 0.55, and CAI-2 ranged from
(−1.08) to 1.57, which were negative in the majority of the samples (67%), suggesting the presence of
base-exchange process (Table 2). Ca2+ and Mg2+ exchanged Na+ sorbed on the exchangeable sites on
the aquifer minerals, resulting in the decrease of Ca and Mg and the increase of Na in the
groundwater by reverse ion exchange [44,45].Appl. Sci. 2019, 9, 1688 11 of 18
Among chloro-alkaline indices, CAI-1 varied from (−2.38) to 0.55, and CAI-2 ranged from
(−1.08) to 1.57, which were negative in the majority of the samples (67%), suggesting the presence of
base-exchange process (Table 2). Ca2+ and Mg2+ exchanged Na+ sorbed on the exchangeable sites on
the aquifer minerals, resulting in the decrease of Ca and Mg and the increase of Na in the groundwater
by reverse
Appl. Sci. 2019,ion
9, x exchange [44,45].
FOR PEER REVIEW 4 of 19
Figure 7. Relation between (Ca + Mg) and (HCO3 + SO4) in the geothermal springs within
Figure 7. Relation between (Ca + Mg) and (HCO3 + SO4 ) in the geothermal springs within Soutpansberg.
Soutpansberg.
This confirmed that Ca2+ , Mg2+ , and Na+ concentrations were interrelated through reverse
This confirmed
ion exchange. that Ca2+, Mg
The remaining
2+, and Na+ concentrations were interrelated through reverse ion
samples were positive with direct exchange occurrence due to the
exchange. The remaining
direct exchange of Ca2+ and samples
Mg2+ were
from positive with
the aquifer directwith
matrix exchange
Na+ and occurrence
K+ from due to the direct
the groundwater.
exchange of Ca the
This supported
2+ andfactMg
that from
2+ theearth
alkaline aquifer matrixwere
elements withabundant.
Na and K from the groundwater. This
+ +
supported the fact that
+ alkaline −earth elements were abundant.
The plot of Na against Cl was used to establish the role of evaporation for higher concentrations
of Na in plot
The of Na+ against
the groundwater. Cl− was
Gurdak et al.used to establish
[46] reported that the role of evaporation
the influence of semi-aridfor higher
climate as
concentrations
intercalation inoftheNasoil
in the
zone groundwater.
enhanced active Gurdak et al. [46]inreported
evaporation the study that the This
area. influence of semi-arid
implied that there
climate
was lossasofintercalation
groundwater in quantity
the soil zone
duringenhanced activeby
the summer evaporation
the action inofthe study area.resulting
evaporation, This implied
in an
that there was loss of groundwater quantity during the summer by the
increase in salt concentration in the groundwater. However, all groundwater samples plotted aboveaction of evaporation,
resulting in an increase in salt concentration in the groundwater. However, all groundwater samples
the freshwater evaporation line (Figure 8). This study showed that the molar ratios of Na/Cl for the
plotted above the freshwater evaporation line (Figure 8). This study showed that the molar ratios of
geothermal spring samples generally ranged from 0.4–3.11 compared to the seawater ratio of 0.86,
Na/Cl for the geothermal spring samples generally ranged from 0.4–3.11 compared to the seawater
which implied that 67% of the water had a Na/Cl ration higher than that of the seawater, while 33%
ratio of 0.86, which implied that 67% of the water had a Na/Cl ration higher than that of the
was lower than that of seawater [9]. The weathering of silicate minerals was thus confirmed as the
seawater, while 33% was lower than that of seawater [9]. The weathering of silicate minerals was
main source of Na in the groundwater within Soutpansberg. This indicated that evaporation was one
thus confirmed as the main source of Na in the groundwater within Soutpansberg. This indicated
of the processes controlling the geochemistry of the geothermal springs [46].
that evaporation was one of the processes controlling the geochemistry of the geothermal springs
[46].Appl. Sci. 2019, 9, 1688 12 of 18
Appl. Sci. 2019, 9, x FOR PEER REVIEW 5 of 19
Na+ + Cl- = 1:1
+ and Cl−− in the geothermal springs within Soutpansberg.
Figure8.8. Relation
Figure Relation between
between Na
Na+ and Cl in the geothermal springs within Soutpansberg.
4.2. Isotopic Composition
4.2. Isotopic Composition
The summarised data for δ22H and δ18 O values for the investigated geothermal spring water and
The summarised data for δ H and δ18O values for the investigated geothermal spring water and
boreholes are presented in Table 2. δ2 H 2and δ18 O 18values were plotted for groundwater samples, which
boreholes are presented in Table 2. δ H and δ O values were plotted for groundwater samples,
gave us a clear understanding of the origin and recharge processes (Figure 9). It was observed that
which gave us a clear understanding of the origin and recharge processes (Figure 9). It was observed
the groundwaters (geothermal springs at Tshipise, Sagole, and Mphephu) were more depleted in
that the groundwaters (geothermal springs at Tshipise, Sagole, and Mphephu) were more depleted
the winter compared to the summer season. This could be attributed to paleoclimatic effects, which
in the winter compared to the summer season. This could be attributed to paleoclimatic effects,
make the groundwater isotopically depleted with respect to modern waters. The paleoclimatic effect
which make the groundwater isotopically depleted with respect to modern waters. The
is manifested by the depletion of stable isotopes with respect to modern waters [47] and is shifted
paleoclimatic effect is manifested by the depletion of stable isotopes with respect to modern waters
along the TMWL towards negative values (Figure 9). That is to say, there is a possible evaporation of
[47] and is shifted along the TMWL towards negative values (Figure 9). That is to say, there is a
rainwater before infiltration mixing with groundwater, which would result in the slight enrichment
possible evaporation of rainwater before infiltration mixing with groundwater, which would result
in the summer. As mentioned earlier, most of the rainfall within Soutpansberg occurred during the
in the slight enrichment in the summer. As mentioned earlier, most of the rainfall within
summer season, but the groundwaters were more depleted in the winter than the summer season
Soutpansberg occurred during the summer season, but the groundwaters were more depleted in the
(δ18 O or δ2 H values were lesser). Hence, no amount effect was observed, but a high temperature effect
winter than the summer season (δ18O or δ2H values were lesser). Hence, no amount effect was
was observed that led to evaporation, resulting in seasonal effects, which were profound in the study
observed, but a high temperature effect was observed that led to evaporation, resulting in seasonal
and supported by other studies [47–49]. The isotopic signatures of the groundwaters were depleted
effects, which were profound in the study and supported by other studies [47–49]. The isotopic
isotopically in the winter compared to the summer, which negated the amount effects; that is, the lesser
signatures of the groundwaters were depleted isotopically in the winter compared to the summer,
the volume of rainfall, the higher the δ18 O or δ2 H content [50,51]. Figure 9 on isotopic data differentiates
which negated the amount effects; that is, the lesser the volume of rainfall, the higher the δ18O or δ2H
between the three possible types of origin of geothermal water, i.e., magnetic, oceanic, and meteoric.
content [50–51]. Figure 9 on isotopic data differentiates between the three possible types of origin of
Ranges of δ18 O and δD of all the geothermal water samples are −5.718to −4.8% and −33.5 to −24.6%,
geothermal water, i.e., magnetic, oceanic, and meteoric. Ranges of δ O and δD of all the geothermal
respectively (Table 2). These data showed no presence of any significant amount of magnetic water,
water samples are −5.7 to −4.8 ‰ and –33.5 to −24.6 ‰, respectively (Table 2). These data showed no
which generally has δ18 O: +6 to +9% and δD: −40 to −80% (Pearson and Rightmire, 1980; Giggenbach,
presence of any significant amount of magnetic water, which generally has δ18O: +6 to +9 ‰ and δD:
1992). The possibility of oceanic origin of these waters was ruled out because δ18 O and δD were not
−40 to −80 ‰ (Pearson and Rightmire, 1980; Giggenbach, 1992). The possibility of oceanic origin of
approximately 0% (Craig, 1961). The isotopic compositions of groundwater (δ2 H = −24.6 to −33.5%
these 18waters was ruled out because δ18O and δD were not approximately 0‰ (Craig,2 1961). The
and δ O = −4.82 to −5.82%) were significantly lighter than those of modern rainwater (δ H = −9.8%
isotopic compositions of groundwater (δ2H = −24.6 to −33.5‰ and δ18O = −4.82 to −5.82‰) were
and δ18 O = −2.7%) [35], indicating that such groundwater could possibly originate from seepage
significantly lighter than those of modern rainwater (δ2H = −9.8‰ and δ18O = −2.7‰) [35], indicating
that such groundwater could possibly originate from seepage of meteoric water in the past duringAppl. Sci. 2019, 9, 1688 13 of 18
Appl. Sci. 2019, 9, x FOR PEER REVIEW 6 of 19
of meteoric
colder water
climates in the
(Yeh andpast
Lee,during
2018).colder
Hence,climates (Yehofand
the origin Lee,
these 2018).isHence,
waters themeteoric.
possibly origin of The
these
waters is possibly meteoric. The isotopic ranges of the geothermal springs/groundwater
isotopic ranges of the geothermal springs/groundwater were relatively reflective of rainwater were relatively
reflective
signatureof(δD
rainwater
= −9.8‰signature
and δ(δD18O ==−9.8%
−2.7‰).andThis = −2.7%).that
δ18 Oindicated Thisthe
indicated that the came
groundwater groundwater
from
came from precipitation
precipitation that took
that took place place
in the in the
high high mountain
mountain of the Soutpansberg
of the Soutpansberg mountain mountain range.
range. Most
Most
groundwater samples might have derived from the infiltration of local precipitation with a a
groundwater samples might have derived from the infiltration of local precipitation with
significant
significant contribution of another typetype of
of water
water in
in the
thedeeper
deeperpart
partof
ofthe
theaquifer.
aquifer.
Figure 9. Seasonal variation of δ2H and δ18O values of the geothermal spring and boreholes.
Figure 9. Seasonal variation of δ2 H and δ18 O values of the geothermal spring and boreholes.
The plotted δ2H against δ18O diagram shows the geothermal springs and thermal boreholes plot
The plotted δ2 H against δ18 O diagram shows the geothermal springs and thermal boreholes
above/below and close to the local meteoric water line (LMWL) (Figure 9) indicative of meteoric
plot above/below and close to the local meteoric water line (LMWL) (Figure 9) indicative of meteoric
origin, which implied that modern rainfall was the fundamental component of these groundwaters.
origin, which implied that modern rainfall was the fundamental component of these groundwaters.
Groundwater samples such as TSW, TSS, and SGS fell below the LMWL, which implied they were
Groundwater samples such as TSW, TSS, and SGS fell below the LMWL, which implied they were
subjected to evaporation before or during their underground transit [52]. This phenomenon could
subjected to evaporation before or during their underground transit [52]. This phenomenon could
have been achieved by local processes such as selective infiltration, direct percolation through the
have been achieved by local processes such as selective infiltration, direct percolation through
faults, degree of differentiation both on land surface and in the unsaturated (vadose) zone, and
the faults, degree of differentiation both on land surface and in the unsaturated (vadose) zone,
mixing mechanism from surface water and irrigation processes [9]. Other samples plotted above the
and mixing mechanism from surface water and irrigation processes [9]. Other samples plotted above
LMWL, which indicated the average isotopic composition of rainwater resulting from the relatively
the LMWL, which indicated the average isotopic composition of rainwater resulting from the relatively
aquifer-mixed system. This was mostly experienced in the winter with low amounts of rainfall, and
aquifer-mixed system. This was mostly experienced in the winter with low amounts of rainfall, and this
this was mixed water from rainwater and other water bodies (rivers and lakes) in the aquifer. In
was mixed water from rainwater and other water bodies (rivers and lakes) in the aquifer. In aquifer
aquifer systems that were weathered and fractured, direct infiltration through faults and shearing
systems thatpossibly
could have were weathered andthe
conserved fractured,
isotopic direct infiltration
composition through
of the faults
original rainand shearing
[9,47, could the
52]. Hence, have
possibly conserved
groundwaters may the
not isotopic composition
have been affected by of isotopic
the original rain [9,47,52].
differentiation, Hence,
which thethem
made groundwaters
distinct
may not have been affected by isotopic differentiation, which made them distinct
from rainwater resulting in the depletion of heavy isotopes due to the Rayleigh fractionation from rainwater
resulting
processes,inwhich
the depletion of heavy with
was corroborated isotopes due from
findings to theGat
Rayleigh
[52]. fractionation processes, which was
corroborated with findings
The groundwater was from Gat [52].
classified into two groups according to the isotopic composition. Sagole
and Tshipise had similar signatures (Group 1), and Siloam and Mphephu had similar signatures
(Group 2). This could possibly have been due to the closeness in distance above the sea level
(altitude) (Siloam–835 m and Mphephu–890 m; Sagole–450 m and Tshipise–520 m) and hydraulicAppl. Sci. 2019, 9, 1688 14 of 18
The groundwater was classified into two groups according to the isotopic composition. Sagole and
Tshipise had similar signatures (Group 1), and Siloam and Mphephu had similar signatures
(Group 2). This could possibly have been due to the closeness in distance above the sea level
(altitude) (Siloam–835 m and Mphephu–890 m; Sagole–450 m and Tshipise–520 m) and hydraulic
connectivity [53,54]. Group 1 was recharged at a higher altitude compared to Group 2, and this
accounted for the slight enrichment of its isotopic compositions [47]. Also, Figure 1 shows two
distinctive geological formations leading to the water chemistry of these geothermal springs, which
corroborated the findings from the isotopic signatures. During the infiltration process, the water
interacted with the rock minerals with depth and made the water change isotopically from depletion
to enrichment (lower altitude to higher altitude). Interestingly, Siloam geothermal water and hot
borehole had very similar isotopic compositions, which could be attributed either to the hydraulic
connectivity between the deep and shallow aquifer that resulted from a minor fault or the fact that
they were from the same aquifer. The study inferred that the geothermal spring waters were from a
deep aquifer (thermal gradient) with more depleted isotopic signatures (light isotopic composition).
Apparently, the thermal borehole (shallow aquifer) had a similar isotopic signature as the geothermal
spring (deep aquifer), and it could be inferred that there was direct interconnectivity between the
two aquifer (shallow and deep) systems through the fault at Siloam. This could be attributed to the
geological formations and climatic factors of the area.
The Pearson correlation showed the relationship among physical, chemical, and isotopic
compositions of the geothermal springs/boreholes (Table 3). The temperature showed a positive
correlation with pH, alkalinity, K, F, CO3 , and HCO3 , and very weak negative correlation with Ca, Mg,
PO4 , δ2 H, and δ18 O. This implied that the increase in temperature increased the concentrations of the K,
F, CO3 , and HCO3 , and decreased the concentrations of Ca, Mg, and PO4 , thus accounting for the high
fluoride concentrations in the groundwater [2,54]. The high correlation between F− and Na+ was noted
because it was an indication of the possible source of F− . Dissolution of fluoride-bearing minerals, such
as cryolite (Na3 AlF6 ), was depicted as a source of F- in hard rock groundwater [55]. However, further
investigations are still required to deepen the existing knowledge on this issue in the studied areas.
Also, the increased temperature enhanced the evaporations, leading to isotopic depletion of δ2 H and
δ18 O in the groundwater [47–49]. Generally, δ2 H and δ18 O showed either strong or weak negative
correlations with all the measured parameters except for Ca and Mg (R2 > 0.5) (Table 3). This meant
that any change in the fundamental chemistry of the water would affect the isotopic compositions of
the groundwater.You can also read


