The Impact of a Fracking Ban on Shale Production and the Economy - Michael C. Lynch Distinguished Fellow - EPRINC
←
→
Page content transcription
If your browser does not render page correctly, please read the page content below
The Impact of       Michael C. Lynch
                    Distinguished
a Fracking Ban on   Fellow

Shale Production
and the Economy     January 2020
ABOUT THIS PAPER

      Oil and gas production from the U.S. petroleum resource base has experienced an unprecedented
expansion in output which has now positioned the U.S. as the world’s largest oil and gas producer. The
North American petroleum production platform is soon to become a net oil and gas exporter to the world
market. This rapid expansion in oil and gas production has enhanced U.S. energy security, provided
greater stability to the world oil market, and conveyed sustained economic benefits to the national
economy. The expansion in output has been possible through a series of advances in extraction technology
including the use of hydraulic fracturing which permits oil and gas production from so-called source rock.
      Concerns over carbon emissions from sustained increases in domestic oil and gas production has
now been reflected in the 2020 Presidential race, with some candidates and many public interest groups
calling for an end to hydraulic fracturing. Operationally, these initiatives would include a ban on oil and
gas development on public lands, prohibition of new infrastructure, such as pipelines, export terminals
and even refineries. This effort, championed by several Democratic candidates for President would include
features of so-called Green New Deal (GND) to quickly move that national energy complex to a fully
renewable fuel system.
      In this paper, EPRINC fellow Michael Lynch, explores the economic consequences of policies aimed
at severely reducing U.S. oil and gas production. Such an estimate is important because whatever the
merits (benefits) from reducing carbon emissions through oil and gas production constraints, policy makers
will have to confront the costs and public acceptance of such a policy.

© Copyright 2020 Energy Policy Research Foundation, Inc. 1031 31st Street, NW Washington, DC 20007
▶ +1 202.944.333 ▶ eprinc.org

                    EPRINC The Impact of a Fracking Ban on Shale Production and the Economy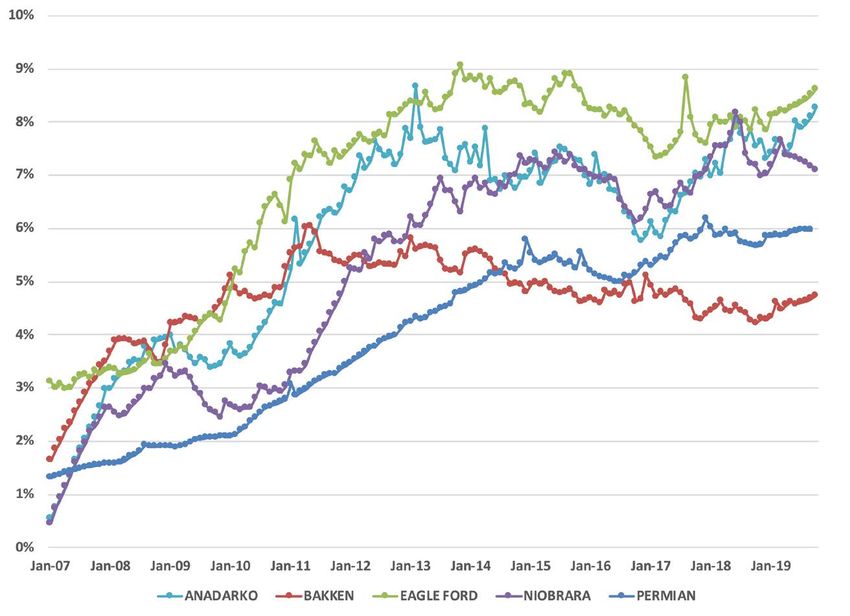
ABOUT THE AUTHOR

      Michael Lynch is a Distinguished Fellow at EPRINC, as well as the President of Strategic Energy &
Economic Research, a firm providing consulting services and analysis in the oil and gas industry. He also
has experience in providing consulting services on upstream policy, energy security, market forecasting,
and developments in the oil and gas industry. He has served as a Lecturer in the MBA program at Vienna
University and blogged for US News and World Report on energy issues. Prior to 2003, Mr. Lynch was
a Chief Energy Economist for DRI-WEFA, now part of IHS/Global Insight. Mr. Lynch’s previous work
has included computer modeling of the world oil market and estimation of the economics of supply for
both world oil and natural gas, including LNG supply, and market behavior under normal and disrupted
conditions. He has also given testimony and advice to committees of the U.S. Congress and the United
Nations, the World Bank and the International Energy Agency. He was Executive Director, Asian Energy
and Security, at the Center for International Studies, M.I.T., as well as a Lecturer in the Diplomatic Training
Program at the Fletcher School of Law and Diplomacy, Tufts University. He is a senior contributor for
forbes.com/sites/michaellynch. His book, “The Peak Oil Scare and the Coming Oil Flood,” was published
in July 2016.

ABOUT EPRINC
      The Energy Policy Research Foundation, Inc. (EPRINC) was incorporated in 1944 as a not- for-profit
organization that studies energy economics with special emphasis on the production, distribution, and
processing of oil and gas resources. It is known internationally for providing objective analysis of energy
issues.
      The Foundation researches and publishes reports on all aspects of the petroleum industry which are
made available free of charge to all interested organizations and individuals. It also provides analysis for
quotation and background information to the media. EPRINC has been called on to testify before Congress
on many occasions, and it briefs government officials and legislators, and provides written background
materials on request. Additionally, EPRINC has been a source of expertise for numerous GAO energy-
related studies and has provided its expertise to virtually every National Petroleum Council study of
petroleum issues. EPRINC receives undirected research support from the private sector and foundations,
and it has undertaken directed research from the U.S. government from both the U.S. Department of
Energy and the U.S. Department of Defense.

                    EPRINC The Impact of a Fracking Ban on Shale Production and the Economy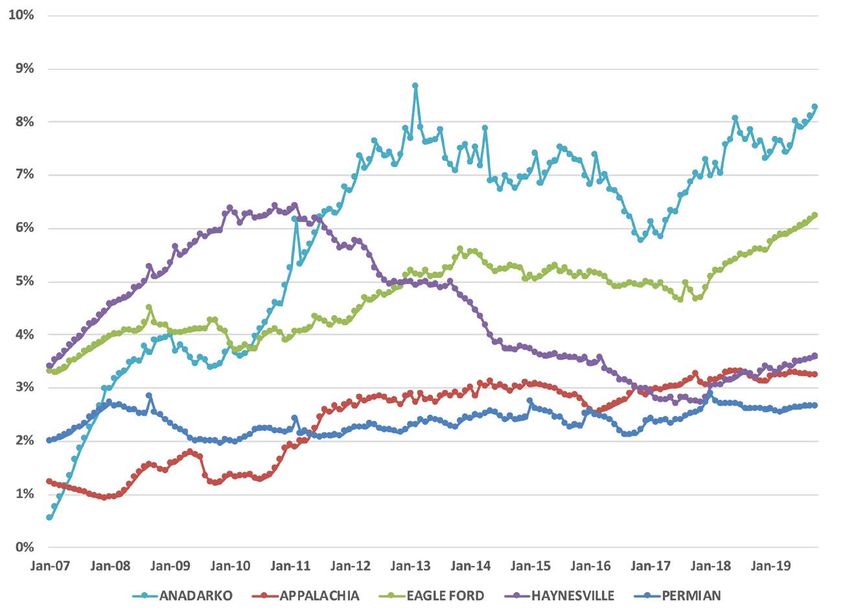
TABLE OF CONTENTS

Executive Summary                                                                               1
Introduction                                                                                    5
Production Trends after a Fracking Ban                                                          6
Post-Ban Production Trends                                                                     12
Conventional Petroleum Rebound                                                                 14
Impact of a Fracking Ban                                                                       15
Price Changes due to Fracking Ban                                                              16
Economic Impact of a Fracking Ban                                                              17
A Resurgence of Coal Use?                                                                      20
Stranded Assets                                                                                21
Conclusion                                                                                     21
Addendum: Impact of Declining Shale Gas Production on the Power Sector                         22
Appendix A                                                                                     23
        Basis of Calculations   				                                                           23
        NGLs 				                                                                              23
        Conventional Oil & Gas Rebound      				                                               24
        Price Impact     				                                                                  24
Endnotes                                                                                       25

FIGURES AND TABLES
      Figure ES-1: U.S. Crude Production (mb/d)				                                             1
      Figure ES-2: Shale Oil Production After a Fracking Ban (mb/d)				                         2
      Figure ES-3: Additional Call on OPEC with a Fracking Ban (mb/d)				                       3
      Figure ES-4: Shale Gas Production After a Fracking Ban (Mcf/d)				                        4
      Figure 1: Decline Rate for Shale Oil Basins				                                           6
      Figure 2: Decline Rate for Shale Gas Basins				                                           7
      Figure 3: Bakken Decline Rate After Drilling Decline				                                  8
      Figure 4: Eagle Ford Decline Rate After Drilling Decline				                              9
      Figure 5: Rigs Active in the Eagle Ford Basin				                                        10
      Figure 6: Haynesville Decline Rate After Drilling Decline				                            11
      Figure 7: Shale Oil Production After a Fracking Ban (mb/d)				                           12
      Figure 8: Shale Gas Production After a Fracking Ban (bcf/d)				                          13
      Figure 9: Call on OPEC Year-on-Year (mb/d)				                                           16
      Figure 10: Coal Consumption by Utilities and Price Differential Between Gas and Coal		   20
      Figure A-1: Natural Gas Liquids Production and the Impact of a Fracking Ban (mb/d)		     23

      Table 1: Impact of a Fracking Ban on Production				                                      13
      Table 2: Impact of Shifting Drilling to Conventional Petroleum			                        14
      Table 3: Production After Fracking Ban and Rebound in Conventional Drilling			           15
      Table 4: Global Petroleum Trade: Impact of a U.S. Fracking Ban				                       17
      Table 5: U.S. Oil Trade Balance After Fracking Ban				                                   18
      Table 6: Natural Gas Trade Deficit After Fracking Ban				                                18
      Table 7: U.S. Energy Expenditures Due to Higher Oil and Gas Prices				                   19
      Table 8: States Most Vulnerable to Higher Oil and Gas Prices				                         19

                     EPRINC The Origins of Resource Pessimism and its Consequences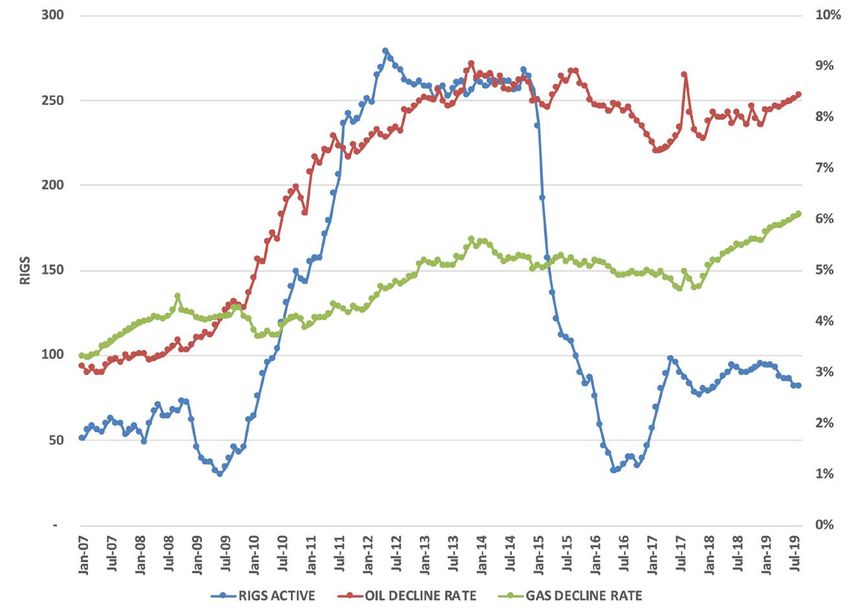
EXECUTIVE SUMMARY

      A number of presidential candidates have committed to banning the use of hydraulic fracturing
for the extraction oil and gas from U.S. petroleum production provinces. Given the importance of this
extraction technique, a large sustained decline in domestic oil and gas production would quickly follow.
The report concludes that a decline in oil liquids of 6 mb/d likely would occur by the end of 2022 and
natural gas production would fall by an estimated 11 bcf/d. Such a sharp decline would be difficult to
replace.
      Figure ES-1 shows the sharp rise in tight oil production as a result of fracking and demonstrates the
tight oil share of the total production. Figure ES-2 contains the projected trend in U.S. shale oil production
in the two years after such a ban takes place and would be accompanied by an increase of $150 billion
in U.S. oil imports in the unlikely event that the production loss would not bring about an increase in
world oil prices. In a more likely case of at least a $20/barrel increase in oil prices, the U.S. oil trade deficit
would grow by $200 billion over the current level and consumers would have to spend an extra $400
billion for their oil and gas.

                                              Figure ES-1
                                     U.S. Crude Production (mb/d)

                    EPRINC The Impact of a Fracking Ban on Shale Production and the Economy
                                                    Page 1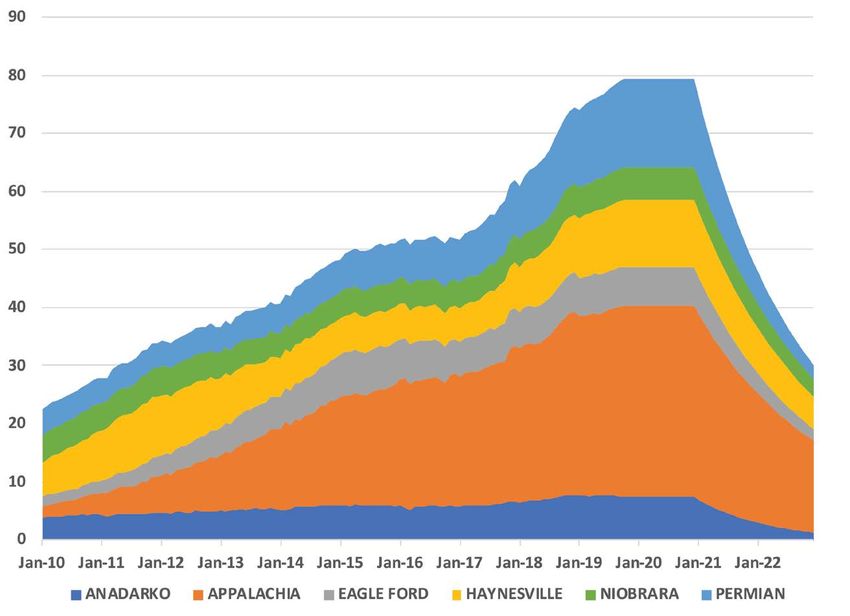
EXECUTIVE SUMMARY continued

                                          Figure ES-2
                        Shale Oil Production After a Fracking Ban (mb/d)

       Of course, world oil prices would certainly rise as there is not sufficient global capacity to replace
the lost supply. At present, only 3 mb/d of surplus capacity exists, almost all of which is in Saudi Arabia.
Figure ES-3 shows how the call on OPEC would grow rapidly, beyond the ability of anyone to compensate.
It is not out of the question for oil prices to rise beyond $100/barrel in such a situation.

                   EPRINC The Impact of a Fracking Ban on Shale Production and the Economy
                                                   Page 2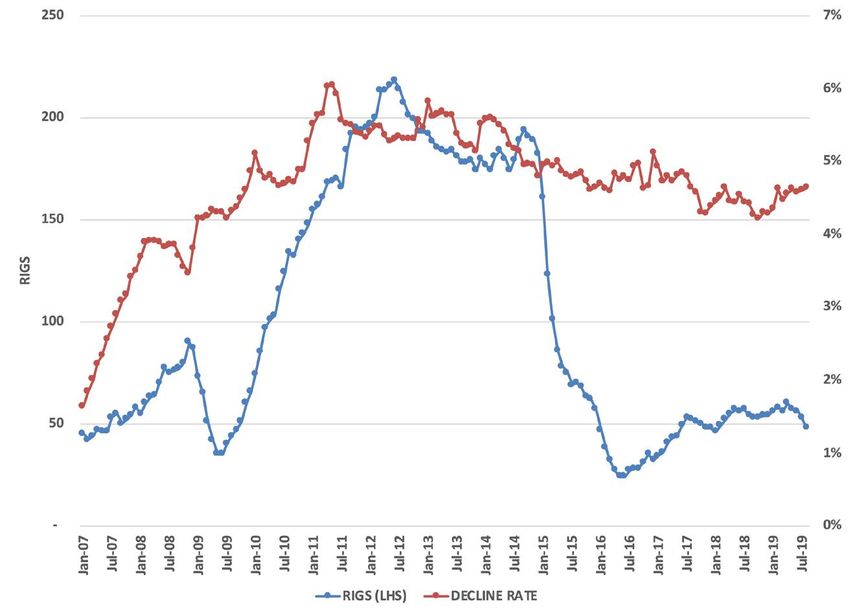
EXECUTIVE SUMMARY continued

                                         Figure ES-3
                     Additional Call on OPEC with a Fracking Ban (mb/d)

      Domestic natural gas output would not be as severely curtailed, partly because some of the loss can
be offset by increasing conventional gas supply. In the near term, substantial price risks would remain as
it would be difficult to expand imports given limited LNG import capacity. To attract imports, domestic
U.S. prices would probably triple; the gas bill for consumers would grow by over $100 billion. Figure ES-4
shows the trend in shale production in the two years after a fracking ban.

                   EPRINC The Impact of a Fracking Ban on Shale Production and the Economy
                                                   Page 3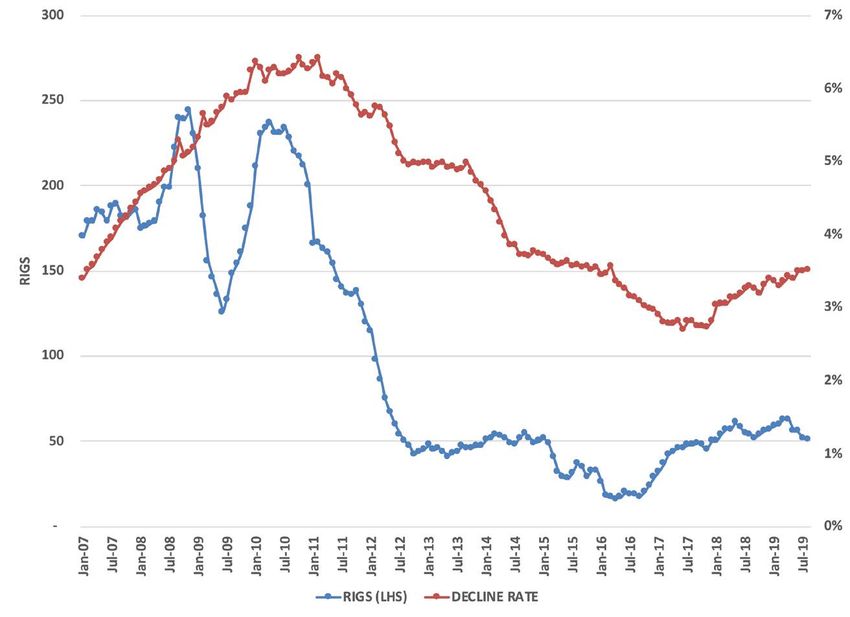
EXECUTIVE SUMMARY continued

                                Figure ES-4
              Shale Gas Production After a Fracking Ban (Mcf/d)

           EPRINC The Impact of a Fracking Ban on Shale Production and the Economy
                                           Page 4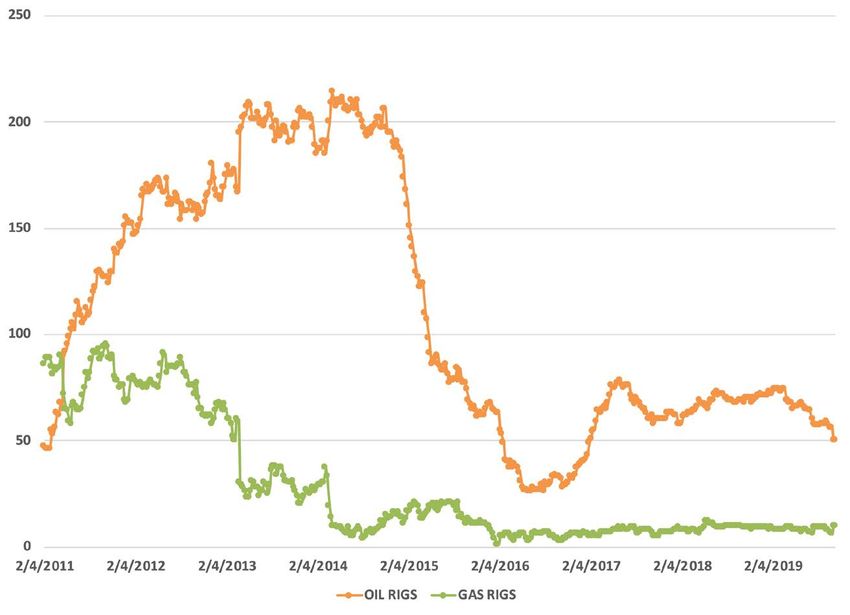
INTRODUCTION

      Hydraulic fracturing is a long-standing practice           Concerns that the North American oil and gas
to promote well stimulation and improve extraction         production renaissance will make the transition to
rates for the production of oil and gas. It has been       an energy future free of fossil fuels more difficult
in practice in the U.S. since the 1950’s. The process      has brought about calls from several candidates for
involves the high-pressure injection of ‘fracking fluid’   President of the U.S. to call for a full ban on the use
(primarily water, containing sand or other proppants       of the process. Political candidates often seek simple
suspended with the aid of thickening agents) into a        remedies for complex problems and in the end it
wellbore to create cracks in the deep-rock formations      may not be easy to engage a full ban of hydraulic
through which natural gas, petroleum, and brine            fracturing given current legal, political, and economic
will flow more freely. Although it was originally          conditions. Most U.S. production occurs on private
employed in conventional oil and gas production            lands and would be subject to a broad range of legal
using vertical wells, its introduction as a technology     protections from arbitrary and capricious policies.
to gain access to oil and gas in so-called “source         However, substantial production of oil and gas occurs
rock” (using horizontal drilling) has been the primary     on public lands and Presidential authority could
breakthrough technology that has allowed the U.S. to       clearly curtail future access to oil and gas resources on
become the largest oil and gas producer in the world.      those lands.
      The process remains controversial over concerns            A full ban on the technology is a somewhat
that it poses risks to water supplies and has been         new development in American politics given
accompanied by an increase in methane emissions,           that Democrats from President Barack Obama to
which are presumably contributing to climate change.       California Governor Jerry Brown have not opposed
Two U.S. states, New York and Maryland, along with         (but regulated) fracking. Putting aside for the moment
some foreign countries, have banned the technology.        the climate, health and safety merits of a full ban on
EPA has determined the process is safe and does not        hydraulic fracturing, or even the likelihood such an
threaten water supplies in the U.S. At the same time,      initiative could be fully implemented, this report
oil and gas production resulting from this process         examines the likely consequences of such a ban on
have soared, transforming U.S. and global energy           U.S. production and the resulting costs to consumers
markets while generating substantial economic and          and the national economy.
security benefits for the United States.

                    EPRINC The Impact of a Fracking Ban on Shale Production and the Economy
                                                    Page 5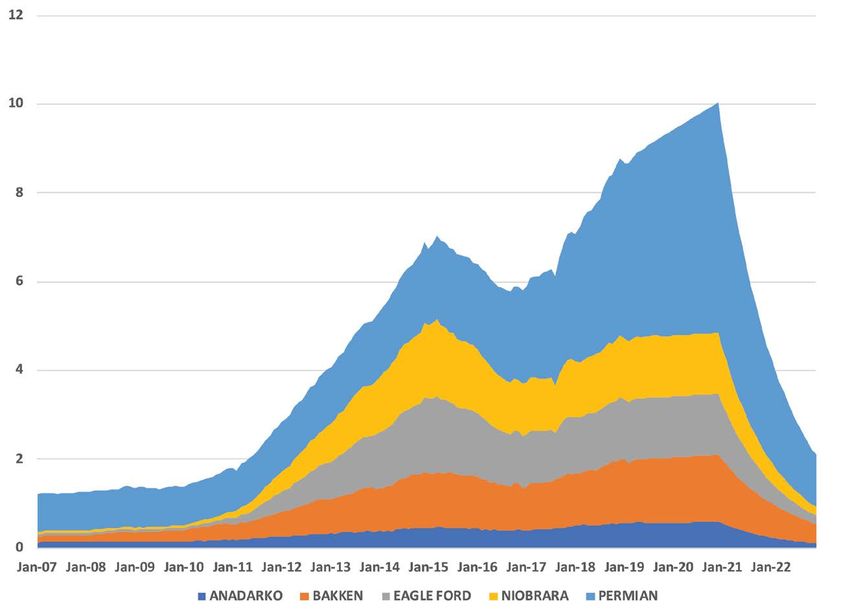
PRODUCTION TRENDS AFTER A FRACKING BAN

      Before the fracking revolution, U.S. oil and         per month. The rapid decline in production from
gas production had been performing poorly. Gas             fracked wells is a prominent factor of shale oil and
production grew about 10% from 1990 to 2000, but           gas production, although it is not necessarily a bad
that was inadequate to meet demand, and prices,            thing as it allows producers to recover their costs
which were consistently below $3/Mcf in the 1990s,         quickly.1 But it does mean that, without continuous
were often above $5/Mcf in the early 2000s and             drilling, production from a basin will drop much
sometimes above double-digit prices, before shale          more sharply than from a conventional oil field.
gas reached its prime. Oil production dropped 20%                The Energy Information Administration
from 1995 to 2005, nearly 1.5 mb/d even as global          reports regular data in its Drilling Productivity
oil prices soared. (Shale oil production only topped       Report that estimates the decline each month from
1 mb/d in 2011.)                                           older wells and these are reproduced for oil and
      What politicians appear to be overlooking is         gas in Figures 1 and 2 respectively, as a percentage
not just that shale oil and gas are the majority of        of total production in the basin. There is variance
U.S. petroleum production, but the wells decline           across regions, presumably reflecting primarily
much more rapidly than for conventional oil.               geological differences, but in each case the rate of
Conventional wells tend to decline by 6-10% per            decline is significant.
year, whereas shale oil wells decline by 5-8%

                                                Figure 1
                                    Decline Rate for Shale Oil Basins

Data from Drilling Productivity Report, Energy Information Administration, September 2019.

                     EPRINC The Impact of a Fracking Ban on Shale Production and the Economy
                                                     Page 6
PRODUCTION TRENDS AFTER A FRACKING BAN continued
Figure 2
Decline Rate for Shale Gas Basins
Data from Drilling Productivity Report, Energy Information Administration, September 2019.
It might be argued that an end to fracking in the past, some idea of the magnitude of change
would mean that aggregate decline rates would can be provided.
fall and the production decline be moderated The first case is the Bakken oil shale, where
as production in a basin would increasingly be the number of rigs dropped from 191 to 24 between
dominated by older wells with lower decline rates. October 2014 and June 2016. (Figure 3) During
Without access to per-well data for each basin, that period, the decline rate dropped from 5.0% to
the effect cannot be estimated precisely, but by 4.8%, a negligible change.
examining what happened when drilling dropped
EPRINC The Impact of a Fracking Ban on Shale Production and the Economy
Page 7PRODUCTION TRENDS AFTER A FRACKING BAN continued
Figure 3
Bakken Decline Rate After Drilling Decline
Data from Drilling Productivity Report, Energy Information Administration, September 2019.
The Eagle Ford basin is not as much of a by the DOE data. However, as Figure 4 shows, the
clear-cut case as the Bakken, because parts of it sharp decline in drilling from October 2014 to May
are gas-rich, parts liquid-rich, and the number of 2016—82%--had little appreciable effect on the
rigs and wells are not broken down by oil and gas decline rate for either oil or gas.
EPRINC The Impact of a Fracking Ban on Shale Production and the Economy
Page 8PRODUCTION TRENDS AFTER A FRACKING BAN continued
Figure 4
Eagle Ford Decline Rate After Drilling Decline
Data from Drilling Productivity Report, Energy Information Administration, September 2019.
However, Baker-Hughes provides weekly rig decline rate, from 4.9 to 5.4% over about two years.
utilization data by basin and split between oil and Oil drilling drops later, in early 2015, but just as
gas, which is presented below for the Eagle Ford severely (about 90%), however, the decline rate
(Figure 5). The collapse of gas drilling in 2012 rises from 8.2% to 8.7%, then drops to 7.3%
results in only a marginal increase in the reported after 2 years.
EPRINC The Impact of a Fracking Ban on Shale Production and the Economy
Page 9PRODUCTION TRENDS AFTER A FRACKING BAN continued
Figure 5
Rigs Active in the Eagle Ford Basin
Source: Baker Hughes.2
The final case is the Haynesville, a gas basin, after two years, it fell from 6% per month to 5%
where drilling dropped by 80% and production per month, although settling at 3% five years after
fell by 40% before recovering, probably the most drilling fell. This does suggest that decline rates can
extreme change for any major shale basin. As Figure moderate as fewer new wells come on-line, but only
6 shows, the decline rate did drop, but very slowly: with a significant lag.
EPRINC The Impact of a Fracking Ban on Shale Production and the Economy
Page 10PRODUCTION TRENDS AFTER A FRACKING BAN continued
Figure 6
Haynesville Decline Rate After Drilling Decline
Data from Drilling Productivity Report, Energy Information Administration, September 2019.
It is entirely possible that the relatively stable smoothing algorithm. Even so, it seems reasonably
decline rates during periods of sharply decreased safe to accept that a termination of all fracking will
drilling reflects some aspect of the data collection not see a significant reduction in the decline rate
and publication process, for example, the use of a over the course of only 24 months.
EPRINC The Impact of a Fracking Ban on Shale Production and the Economy
Page 11POST-BAN PRODUCTION TRENDS
Applying the observed decline rates to shale For the calculations, it was assumed the ban began
oil (Figure 7) and shale gas (Figure 8) yields a January 1, 2021 and that 2020 production followed
rather dramatic picture of the impact on oil and gas the EIA’s forecast in the Short-Term Energy Outlook.
production in the United States after a fracking ban.
Figure 7
Shale Oil Production After a Fracking Ban (mb/d)
EPRINC The Impact of a Fracking Ban on Shale Production and the Economy
Page 12POST-BAN PRODUCTION TRENDS continued
Figure 8
Shale Gas Production After a Fracking Ban (bcf/d)
Data from Drilling Productivity Report, Energy Information Administration, September 2019. Projection by the author.
Table 1 shows the projected trend for shale production is clearly severe. The 2020 numbers are
oil and gas, assuming a fracking ban takes effect roughly those projected by the EIA in its Short-Term
on January 1, 2021, including yearly averages and Energy Outlook October 2019. NGL estimates are
year-end and -beginning figures. These assume a somewhat less precise; Appendix A describes how
complete cessation of fracking, that is, no wells they were made.
or leases are grandfathered in, and the impact on
Table 1
Impact of a Fracking Ban on Production
Shale Oil mb/d Shale Gas bcf/d NGLs mb/d
Jan-21 9 75.9
Jan-22 4.2 45.8
Dec-22 2.1 30.1
2019 8.4 77.2 5.6
2020 9.2 79.4 6.2
2021 6.5 60.6 4.7
2022 3 37.3 2.9
Data and 2020 figures from EIA. Forecast from the author.
EPRINC The Impact of a Fracking Ban on Shale Production and the Economy
Page 13CONVENTIONAL PETROLEUM REBOUND
It only stands to reason that if fracking Marcellus are much more productive and natural
is banished, the industry will shift some of its gas production is constrained by consumption
resources to developing new, conventional oil and plus exports: surplus oil can always be exported in
gas production. (A ban on offshore drilling might theory, although the cost is sometimes high.3 Thus,
see investment funds move onshore, but obviously it is possible, even logical, that some current oil rigs
equipment would not.) An estimate of how much would target conventional natural gas instead of
can be expected is made in this section. conventional oil.
The first step is to understand what In Table 2, the impact of the rebound in
conventional drilling was like in the days before conventional drilling after a fracking ban is
the shale revolution. In Table 2, the average number shown under two assumptions. The number of
of rigs active and wells drilled from 1995-2000 is rigs operating will be the same as in 2018, just
shown, along with the capacity additions for oil and repurposed from shale, and in the first case, the
gas during that period. (The calculation of capacity oil/gas ratio of drilling rigs remains the same. In
additions is described in Appendix A.) Obviously, the second case, it is assumed natural gas drilling
the capacity additions over the six-year period are is emphasized, with roughly the same total rigs
well below what has been seen in the shale basins active. No adjustment is made for any difference in
in recent years. quality in the rigs in the 1995-2000 period versus
Also, recent development has emphasized oil the present.
wells over gas wells, partly because gas wells in the
Table 2
Impact of Shifting Drilling to Conventional Petroleum
Actual 1995-2000 Oil tb/d Natural Gas bcf/d
Avg Rigs Active 265 531
Development Wells Drilled 52,000 75,000
Wells/Rig Year 33 24
Capacity Additions 3,050 39
Cap/well 59 0.52
2018 Rigs Active 841 190
Potential Wells 27,504 4,473
Capacity 1,613 2.32
Assuming Gas Emphasis
Rigs Active 265 800
Potential Wells 8,667 18,832
Capacity 508 10
Data and 2020 figures from EIA. Forecast from the author.
Using the estimates in Table 1 for lower in conventional drilling, gives the modified
shale drilling and those in Table 2 for a rebound production estimates in Table 3.
EPRINC The Impact of a Fracking Ban on Shale Production and the Economy
Page 14CONVENTIONAL PETROLEUM REBOUND continued
Table 3
Production After Fracking Ban and Rebound in Conventional Drilling
Production shown is shale plus the amount of additional conventional production.
Shale Oil mb/d Shale Gas bcf/d NGLs mb/d
Jan-21 9 75.9
Jan-22 4.2 45.8
Dec-22 2.1 30.1
2019 8.4 77.2 5.6
2020 9.2 79.4 6.2
2021 6.5 60.6 4.7
2022 3 37.3 2.9
Assuming Switch to Conventional Drilling
2021 7.6 67.1 5.2
2022 6 43.8 3.4
With Gas Emphasis
2021 7 70.6 5.5
2022 4 47.3 3.7
In all likelihood, the scenario where natural the number of drilling rigs as occurred in 1995-
gas drilling rises is much more likely than that the 2000. It is also possible that, instead of switching
number of oil rigs operating remains constant after many shale oil rigs to conventional natural gas
a fracking ban, since the conventional oil resource targets they will be idled, so that the production
is much more mature than the gas resource. The estimate here is too optimistic. However, as will be
higher level of oil drilling in 2018 reflects the discussed below, U.S. natural gas prices are likely
richness of the Permian and other shale oil basins, to rise sharply, which would encourage more gas
and operators will not have conventional targets drilling than in 2018.
that would encourage them to run three times
IMPACT OF A FRACKING BAN
Such a sharp, indeed unprecedented decline, Some indirect impacts would be obvious: travel
in oil and gas production would have major effects and tourism would surely suffer, prices of energy
not only in the United States, but around the world. intensive materials would rise, and shipping costs
Oil prices would undoubtedly rise, along with for all goods would go up, with bulk goods naturally
international natural gas prices, boosting petroleum being damaged disproportionately.4 The much higher
exporting countries’ economies but doing serious consumer expenditure on energy would have a
damage to importers and almost certainly triggering a severely deflationary effect, and could conceivably
global recession. trigger a recession.
EPRINC The Impact of a Fracking Ban on Shale Production and the Economy
Page 15PRICE CHANGES DUE TO FRACKING BAN
Although there are no reliable methods for As of October 2019, the global spare crude oil
producing short-term oil price forecasts with any production capacity is estimated at 2.8 mb/d, mostly
degree of accuracy, the shift in market balances for in Saudi Arabia.6 The only two countries that are
oil and gas after a fracking ban implies significantly likely to be able to add significant amounts of capacity
higher prices are certain.5 In terms of world oil in such a short period of time are Iraq and Saudi
markets, the need to replace 5 to 6 mb/d of production Arabia, and doing so would require an emergency
in two years will clearly push prices higher. Figure 9 investment program, which seems unlikely to be
shows the current forecast for year-on-year change in enacted. This would leave the world oil market
demand for OPEC from the IEA, and impact of lower short of at least 3 mb/d of petroleum, possibly more
U.S. shale liquids production. depending on NGL production in the United States.
Figure 9
Call on OPEC Year-on-Year (mb/d)
Sources: Actual and IEA Forecast from IEA Oil Market Report; other from the author.
Of course, since a fracking ban would be and slow and it is very doubtful they could replace
initiated by a Democratic president, he or she might the lost 3 mb/d of supply in two years.
end the sanctions against Iran that have seen its At any rate, even in the most optimistic
production drop by over 1.5 mb/d. For Venezuela, scenario, there would be no spare capacity in the
an end to American sanctions might allow partial global oil market and post-2023 declines in U.S.
recovery of the roughly 2 mb/d of lost supply. Still, shale oil production would increase the pressure.
both are likely to find restoring production difficult As a result, it seems all but certain that prices
EPRINC The Impact of a Fracking Ban on Shale Production and the Economy
Page 16PRICE CHANGES DUE TO FRACKING BAN continued
would rise to between $80 and $100 per barrel and that market and bring the price for internationally
perhaps higher. traded natural gas close to parity with oil prices,
For natural gas, the situation is different. In in other words, over $10/MMBtu. Plus, it must be
recent years, the surge in U.S. LNG exports has assumed that the country would pay world prices
helped to create a global glut and depressed spot for imports, which means that domestic prices
prices at least to below $7/MMBtu in Asia and would rise sharply, from the current sub-$3/MMBtu
Europe. The shift from exporting 4 Tcf/yr to net to at least $7.5 and possibly $10/MMBtu.
imports of as much as 4 Tcf/yr would clearly tighten
ECONOMIC IMPACT OF A FRACKING BAN
The effects on a fracking ban on the wider prices that might result from a fracking ban. A
U.S. (and global) economy would be widespread significant amount of imported oil and gas is re-
and significant, but providing detailed estimates is exported, meaning the gross import figure in Table
beyond the scope of this study. A macroeconomic 4 is overstated by perhaps as much as one-third,
model of the economy could quantify the impact nevertheless, the impact is quite clear: the world,
in great detail, but even without it, some basic energy importing countries especially, would see
estimates can be made. a much larger bill for their oil and gas imports, by
Table 4 shows how the costs of traded oil and hundreds of billions of dollars. The natural gas
natural gas would change for the global economy, import cost would rise from $340 billion to $400-
using aggregate import data compared to actual 500 billion, while the oil import bill could be $200
2018 prices (both from BP) and the possible higher to $700 billion higher.
Table 4
Global Petroleum Trade: Impact of a U.S. Fracking Ban
2018 Imports 2018 Price Cost (trillion$)
mb/d $71.06/bbl $80.00/bbl $100.00/bbl
Petroleum 70 $1.82 trillion $2.04 $2.56
Natural Gas 28.42 Tcf $6.62/Mcf $8.00/Mcf $10.00/Mcf
Pipeline
LNG 15.21 Tcf $10.00/Mcf $12.00/Mcf $15.00/Mcf
Revenue $340.26 $409.90 $512.38
($billions)
Pipeline price is German import price; LNG is Japan cif price. Both from BP Oil price is Brent for 2018. (DOE)
Data from EIA. Forecast from the author.
The most clear-cut is the damage to the U.S. bbl. In the most extreme case, with no additional
trade balance, where the country will move from conventional oil drilling and an import price of
nearly net zero energy imports to very high levels $80/bbl., the U.S. import bill would increase by
of expenditures for both oil and gas. Table 5 shows $200 billion in 2022. In future years, the amount
the change in the U.S. trade deficit for petroleum would grow. As discussed above, increased
at different prices as shale oil production declines, conventional drilling would probably only mean a
including assumed prices of $50, $60 and $80/ difference of 1 mb/d by 2022, or 15%.
EPRINC The Impact of a Fracking Ban on Shale Production and the Economy
Page 17ECONOMIC IMPACT OF A FRACKING BAN continued
Table 5
U.S. Oil Trade Balance After Fracking Ban
U.S. Oil Balance
Shale Total Trade Deficit at Price:
Production Liquids Imports $50 $60 $80
2019 8.4 19.67 0.87 ($15.88) ($19.05) ($25.40)
2020f 9.2 21.25 -0.49 $8.94 ($10.73) ($14.31)
2021 7 1.71 ($31.21) ($37.45) ($49.93)
2022 4 4.71 ($85.96) ($103.15) ($137.53)
Data from EIA. Forecast from the author.
The economic impact of a fracking ban on assuming lost exports are at 2018 prices (section B),
the country’s natural gas trade is a more complex while higher imports are first assumed with 1 Tcf/
calculation, since it involves first, a loss of export yr from Canada at 2018 prices of $2.68, all others
revenue, followed by higher pipeline imports from at $8/Mcf (section C); and section D assumes all
Canada, and then LNG imports at much higher imports must be at $8/Mcf.
prices. In Table 6, the basic numbers are shown
Table 6
Natural Gas Trade Deficit After Fracking Ban ($billions)
A) Production B) Lost Export C) Higher D) Higher
Drop Revenue Imports Import Prices
Production Change Tcf/Yr 2021 2022 2021 2022 2021 2022 2021 2022
Basic ban 6.9 8.5 $15.6 $15.6 $2.1 $25.9 $6.4 $19.2
Ban with shift to 4.5 8.5 $15.6 $15.6 $1.3 $30.7 $4.0 $36.0
conventional drilling
Ban with emphasis on 3.2 4.8 $1.7 $4.2 $0.0 $2.1 $0.0 $6.4
conventional gas
C) is assuming pipeline imports remain at $2.68. LNG imports at $8 D) is assuming all imports are at $8.
Data from EIA. Forecast from the author.
A massive shift to conventional gas drilling rise, as discussed above, U.S. import prices will be
could mean that, while the U.S. loses billions higher and domestic prices would rise accordingly.
in export revenue, it would not have to import Consumer expenditures on oil and gas are
additional natural gas, at least for the first two another matter. While it is true that higher prices for
years. However, if gas drilling were at the average domestic production do not do the same degree of
rate of 1995-2000, then the U.S. would be importing damage to the domestic economy as higher prices
more gas by the end of 2022. (The assumption of for imports, nonetheless it represents a transfer of
drilling with an emphasis on gas would mean 50% wealth from consumers to producers. Much of it is
more rigs focused on gas than in 1995-2000, which recycled, but not efficiently. Table 7 shows
is possible but doubtful.) the additional amounts that would be spent on
The price assumptions here are quite modest. oil and gas given different assumptions about
Especially if the U.S. must import LNG, domestic price increases.
prices would certainly rise. And if world oil prices
EPRINC The Impact of a Fracking Ban on Shale Production and the Economy
Page 18ECONOMIC IMPACT OF A FRACKING BAN continued
Table 7
U.S. Energy Expenditures Due to Higher Oil and Gas Prices
Increased Expenditure ($billions)
Petroleum w/ price increase of: Natural Gas w/ price increase of:
$10/bbl $30/bbl 2/MMBtu $4/MMBtu
2021 $76.7 $230.0 $62.1 $124.1
2022 $78.5 $235.4 $63.0 $126.0
Estimates by the author.
Again, some of that revenue would flow which would tend to take place in other states.
into the hands of domestic producers, but the And producing states like Pennsylvania also
implication is that the U.S. consumers would see a receive tax payments that would ease and/or stop
bill equal to about twice the size of the Trump tax with a fracking ban. Pennsylvania receives $250
cut. The deflationary impact would be significant. million in ‘impact’ payments,8 whereas Texas, in
Geographically, it seems obvious that areas fiscal 2019, received just under $4 billion in oil
with shales under production would be hit first, production taxes.9 Again, higher prices and a switch
including Ohio, Pennsylvania, Colorado, North to conventional production might increase revenue
Dakota, Texas, Oklahoma and New Mexico. States in Southwestern states, but others would see major
in the Southwest might not lose too many jobs, as and sudden losses.
drilling switches to conventional resources, but that On the consumer side, not only will the
is less true for the Appalachian shales. For instance, national economy be affected by higher prices,
there are approximately 200,000 oil industry but some individual states will be hit harder than
workers in Ohio and Pennsylvania7, and a fracking others. Table 8 shows the top five U.S. states in each
ban would mean that most of those jobs would be category, their energy consumption per capita and
lost, even if workers moved to conventional drilling, per GDP.
Table 8
States Most Vulnerable to Higher Oil and Gas Prices
Natural Gas Petroleum
MMBtu/capita MMBtu/mln$ GDP MMBtu/capita MMBtu/mln$ GDP
Alaska 466.3 Louisiana 6675.4 Indiana 429.9 Iowa 7785
Louisiana 368.6 Alaska 6283.1 Alaska 304.0 Missouri 4304
Wyoming 231.9 Mississippi 4734.7 Dist. of Col. 273.3 Mississippi 4096
Mississippi 182.1 Wyoming 3425.5 Wisconsin 244.6 Dist. of Col. 4037
Oklahoma 175.4 Oklahoma 3414.9 Oregon 226.9 Colorado 3613
EPRINC The Impact of a Fracking Ban on Shale Production and the Economy
Page 19A RESURGENCE OF COAL USE?
One of the ancillary benefits of the shale natural gas prices were particularly high, and then
revolution has been the reduction in the usage of began declining almost immediately as the price
coal for power generation, as it has been displaced differential between natural gas and coal delivered
by cheap natural gas. Figure 10 shows how coal to utilities fell to $3/MMBtu and has remained
consumption by utilities peaked in 2008, when below that level since.
Figure 10
Coal Consumption by Utilities and Price Differential Between Gas and Coal
Source: Energy Information Administration
Given that coal prices have been below $2.50/ the competitive position of gas and coal would be
MMBtu for years, if a fracking ban resulted in reversed.
natural gas prices rising to $8/MMBtu or more, then
EPRINC The Impact of a Fracking Ban on Shale Production and the Economy
Page 20STRANDED ASSETS
Some of the oil industry’s investments in could effect at least $5 billion in investment and
recent years have been specific to the fracking perhaps five times that much.12
of shales, others are more general in nature, but The steel industry would obviously be hit,
due to specific issues such as location are de since both drilling and pipelines require significant
facto tied to the production of shale oil and/or amounts of steel. Just as an example, the 450 mile
gas. Declining shale production in various areas Kinder Morgan Wink pipeline, with 145 tb/d of
will mean underutilization and abandonment of capacity, needs 22,300 tonnes of steel.13 A recent
some pipelines, for instance, even though they news story described how the slower drilling levels
could theoretically carry conventional oil and gas of 2019 had seen significant damage to supporting
production. industries, from which the oil and gas producers
The most obvious impact will be on LNG purchased $48 billion of goods in 2018.14
export facilities, as the natural gas available for And while many rigs would continue
export will all but disappear. At present, there are operating, targeting conventional instead of shale
six facilities operating with 9 bcf/d of capacity10 resources, the fracking rigs would become largely
and 8 bcf/d of capacity under construction.11 Given unemployed. At present, there are an estimated
various estimates of capacity costs, there would 350 of these crews, which include a dozen or more
appear to be $25-50 billion of capital tied up in the trucks each.15 Repurposing them would be difficult
export terminals, most of which would be lost if at the least.
exports ceased, although some of the equipment In individual terms, perhaps the best
could be used to supply LNG imports. illustration of what would be lost is the Shell
A number of major pipelines would see Pennsylvania ethane cracker, which costs $6 billion
their utilization drop sharply with the result that and has 600 full-time jobs.16 An associated 100
much of their value would be lost. Some of the tb/d pipeline and rail capacity to ship the plastic
pipelines from the Marcellus and Utica shales manufactured would be lost in part; it is hard to
would be abandoned and it is unlikely that the imagine the ethane would be replaced by imports,
current expansion of Permian pipelines would be but not inconceivable.
operational for very long. At a rough estimate, this
CONCLUSION
The production process for unconventional oil even with a huge rise in conventional drilling. Job
and gas wells requires sustained investments as the losses in the U.S. petroleum and related industries
process is characterized by rapid decline rates. A would start with the layoffs of over ten thousand
ban on fracking (should the new administration be fracking crews and direct losses would be over
able to overcome a large array of legal and political 150,000 jobs, with indirect losses about three
obstacles) would result in large and sustained times that much. The bill in the first two years of a
declines in U.S. oil and gas output, with oil and fracking ban could be, by conservative estimates, an
natural gas liquids dropping by 7 million barrels extra $150 billion on the trade deficit and $300 to
per day in two years and natural gas falling by 11 $600 billion in additional consumer expenditures
billion cubic feet per day over the same period, for oil and gas.
EPRINC The Impact of a Fracking Ban on Shale Production and the Economy
Page 21ADDENDUM: IMPACT OF DECLINING SHALE GAS PRODUCTION ON
THE POWER SECTOR
The fact that gas production would decline billion kwhs, so an increase in capacity in two years
quickly also means significant stress on the U.S. of 40% would be needed.
electricity sector. Some, like Prof. Kassie Siegel However, the annual increases in production
of the Climate Law Institute have suggested for wind and solar have been running about 45
“Clean renewable energy solutions are available.” billion kwhs in the past few years, meaning that
Responding to Sam Ori’s comment on the difficulty production would have to increase five times faster
of such a rapid transition, she added, “We than the best years to date. The likelihood that this
transformed our economy far faster during World could be accomplished is negligible, given the time
War II than you propose.”17 This strikes me as lags for siting, permitting and construction, and the
disingenuous and misleading. bottleneck that lack of skilled workers will cause.
In 2018, the U.S. used 12 Tcf of natural gas to But it could easily require $100 billion a year of
generate 1469 billion kilowatt hours of electricity. investment just for the new capacity.
As shown in Table 3, an optimistic view of Further, it would mean substituting new
production would be a decline of 3.9 Tcf from 2020 construction for existing capacity, essentially
to 2022, this would most likely hit the power sector throwing away about 50-100 GW of gas capacity,
most. The implication is of a loss of about 480 which would cause massive financial losses for
billion kwhs. Given that in 2018, electricity from the utility industry. Further, even if solar and wind
solar was 63.8 billion kwhs, solar power capacity could replace the abandoned gas power, their
would have to be increased by a factor of seven in reliance on gas turbines for backup could mean that
two years. Solar and wind together generated 336 expensive batteries would be needed.
EPRINC The Impact of a Fracking Ban on Shale Production and the Economy
Page 22APPENDIX A
Basis of Calculations
In all economic analysis of this sort, there is a degree of uncertainty and almost any given calculation
will have at least a five to ten percent likely error. By providing this appendix, the reader can assess the
data used, the calculations made, and the assumptions employed, where necessary.
While a spreadsheet can generate answers to many decimal places, that is a false precision. The
results in this report are, however, significant enough that the margin of error is basically irrelevant.
NGLs
Natural gas plant liquids and lease condensate production data is not reported to the same degree of
detail that shale oil and gas are, however, as Figure A-1 shows, they are both closely related to shale gas
production. Lease condensate is from both associated and non-associated natural gas, so is partly related
to shale oil production, however, shale gas production statistics include the associated gas from shale oil
production, so that the correlation remains valid.
Figure A-1
Natural Gas Liquids Production and the Impact of a Fracking Ban (mb/d)
Data and 2020 figures from EIA. Forecast from the author.
EPRINC The Impact of a Fracking Ban on Shale Production and the Economy
Page 23APPENDIX A continued
Conventional Oil & Gas Rebound
The number of wells drilled from 1995-2000 is taken from the EIA database.. Development wells only
are used (exploratory wells make up less than 10% of the total and do not necessarily add to productive
capacity) and dry holes are allocated to oil and gas drilling proportionately.
The rig numbers are from the same source, and no correction is made for onshore and offshore as the
data does not permit it. Since offshore rigs are typically about 10% of the total, any resulting error will be
small.
Capacity added is calculated using the equations derived by M. A. Adelman (1993). It is assumed
that production in the United States equals capacity. After the Texas Railroad Commission ended its
practice of setting production quotas in 1972, producers have typically produced at full capacity except
when performing maintenance. Net capacity additions is thus the change in production from year to year
(sometimes negative). Gross capacity additions includes the replacement of capacity lost to depletion. The
depletion rate as calculated by Adelman is the percentage equal to the production in a year divided by the
average of the proved reserves number at the end of the previous and current years.
Price Impact
As I have described at length elsewhere, there is no valid pricing model for world oil markets, since
the many political variables affecting demand and especially oil supply make it impossible to provide a
specific oil price response to a given decline in oil supply from any particular source, in this case, shale
oil.
For natural gas prices, if the U.S. is going to import large-scale amounts of LNG, the import price has
to be equal to world price for LNG. Unfortunately, there is not yet a mature market for LNG where price
is set by supply and demand; in Asia, for example, 75% of LNG sales are linked to the price of oil, while
65% is so linked in Europe.18
EPRINC The Impact of a Fracking Ban on Shale Production and the Economy
Page 24ENDNOTES
1
Environmental Protection Agency, “Hydraulic Fracturing For Oil And Gas: Impacts From The Hydraulic Fracturing
Water Cycle On Drinking Water Resources In The United States,” December 2016
2
https://bakerhughesrigcount.gcs-web.com/rig-count-overview
3
The September 2019 Drilling Productivity Report from the EIA puts production per rig in Appalachia at 18 mcf/d, or
about 3 tb/doe, versus less than 800 b/d in the Permian.
4
Lynch, Michael C., “Investing for the Oil Price Collapse,” Marketwatch.com, May 30, 2008.
5
See Lynch, Michael C., “Drivers of Oil Price Volatility,” Journal of Energy and Development, vol. XXVIII, no. 1,
Autumn 2002.
6
International Energy Agency, Oil Market Report November 2019, p. 17.
7
https://www.api.org/news-policy-and-issues/american-jobs/economic-impacts-of-oil-and-natural-gas
8
https://stateimpact.npr.org/pennsylvania/2019/06/27/gas-impact-fee-revenue-rises-to-7-year-high-boosted-by-
stripper-wells/
9
Lynch, Michael C., “Why Rapid Shale Production is a Perk,” June 26, 2019.
10
https://www.eia.gov/todayinenergy/detail.php?id=37732
11
https://www.ferc.gov/industries/gas/indus-act/lng/lng-approved.pdf
12
The Cactus II pipeline in the Permian, carrying 670 tb/d of oil and condensate, cost $1.1 billion. Total additions to
Permian liquids capacity will have increased by roughly 3 mb/d from 2017 to end 2020, implying about $5 billion
in costs total. Other investment, such as storage tanks, would add to this. https://pubs.spe.org/en/ogf/ogf-article-
detail/?art=5828
13
https://pubs.spe.org/en/ogf/ogf-article-detail/?art=5806 and https://www.kindermorgan.com/pages/business/co2/
pipelines/wink.aspx.
14
https://www.wsj.com/articles/manufacturers-face-new-threat-from-fracking-slump-11574083303?mod=searchresults
&page=1&pos=6
15
https://www.houstonchronicle.com/business/energy/article/fracking-2018-american-crude-oil-production-12524642.
php
16
https://www.timesonline.com/news/20171108/shell-officially-starts-construction-on-6-billion-ethane-cracker-plant
17
Matthews, Christopher M., “What Would Happen if the U.S. Banned Fracking?” Wall Street Journal, 11/20/19, R6.
18
International Gas Union, Wholesale Gas Price Survey, 2018 edition, p. 25.
EPRINC The Impact of a Fracking Ban on Shale Production and the Economy
Page 25You can also read