Deloitte Economics' Coronavirus Impact Monitor - Despite renewed stock market volatility and indications of increasing loan defaults, CFOs remain ...

Page created by Samuel Nguyen
 
CONTINUE READING
Deloitte Economics' Coronavirus Impact Monitor - Despite renewed stock market volatility and indications of increasing loan defaults, CFOs remain ...
Deloitte Economics’ Coronavirus Impact Monitor
Despite renewed stock market volatility and indications of increasing loan defaults, CFOs
remain optimistic in the face of a second wave
14th edition, 30 October 2020
Deloitte Economics' Coronavirus Impact Monitor - Despite renewed stock market volatility and indications of increasing loan defaults, CFOs remain ...
Coronavirus outbreak
The second wave has arrived in Denmark, while previously affected countries lose infection
momentum
                                                                                                         7-day rolling average new daily confirmed COVID-19 cases for selected countries
 •    COVID-19 is continuing its spread across the world, with more
      than 44 million confirmed cases in 188 countries. About 1.2m                                               US and Brazil                          Spain and France                    Denmark and Sweden
      people have lost their lives.                                                                                                       40.000                                    1.400
                                                                                                70.000
 •    Cases of the disease are surging in this, the second wave                                                                           35.000                                    1.200
                                                                                                60.000

                                                                               # Daily cases
      across Europe, signalling that the relaxation of restrictions                                                                       30.000
                                                                                                                                                                                    1.000
      has been the determinant for the severity of this second                                  50.000
                                                                                                                                          25.000
                                                                                                                                                                                     800
      wave.                                                                                     40.000
                                                                                                                                          20.000
                                                                                                                                                                                     600
 •    Europe remains the epicentre of new COVID-19 outbreaks                                    30.000                                    15.000
      according to the WHO. As we witness the surge in cases from                               20.000                                    10.000
                                                                                                                                                                                     400
      the second wave in Europe, the defining feature of                                                                                                                             200
                                                                                                10.000                                     5.000
      transmission rates stems from the rapid action of each state.
      The United States, France, Denmark and Sweden all are                                         0                                         0                                        0
                                                                                                    1 Mar      1 May   1 Aug     28 Oct       1 Mar      1 May   1 Aug     28 Oct      1 Mar    1 May   1 Aug   28 Oct
      suffering from a vast increase in cases. In Denmark, 1,191
      new cases have been registered the last 24 hours, which is                                         7-day rolling average new daily confirmed COVID-19 deaths for selected countries
      the highest number so far.
                                                                                                                 US and Brazil                          Spain and France                    Denmark and Sweden
 •    Thankfully, there has not yet been a corresponding increase                                3.000                                     1.200                                     120
      in deaths for the most part. However, as the health system
      becomes more strained, this may affect disease management                                  2.500                                     1.000                                     100
      and patient care.                                                                          2.000                                      800                                       80
 •
                                                                               # Daily deaths

      As of 23 October, the Danish government has instituted
                                                                                                 1.500                                      600                                       60
      heightened measures of restriction. The new restrictions
      include face mask requirements and gathering                                               1.000                                      400                                       40
      restrictions and will be adopted until at least the 2
                                                                                                  500                                       200                                       20
      January 2021.
 •    This is likely to affect what is traditionally the largest retail                              0                                         0                                       0
                                                                                                     1 Mar     1 May   1 Aug     28 Oct        1 Mar     1 May   1 Aug     28 Oct      1 Mar    1 May   1 Aug   28 Oct
      shopping period of the year, as well as affecting many citizens
      in their winter travel and Christmas holidays.                                                                      US         Brazil            Spain     France             Denmark        Sweden

Source:   World Health Organisation (WHO), the Danish Health Authority (Sundhedsstyrelsen), Danske Bank, Deloitte analysis
Coronavirus Impact Monitor – 30 October 2020                                                                 Page 2                                                                            Deloitte Economics © 2020
Deloitte Economics' Coronavirus Impact Monitor - Despite renewed stock market volatility and indications of increasing loan defaults, CFOs remain ...
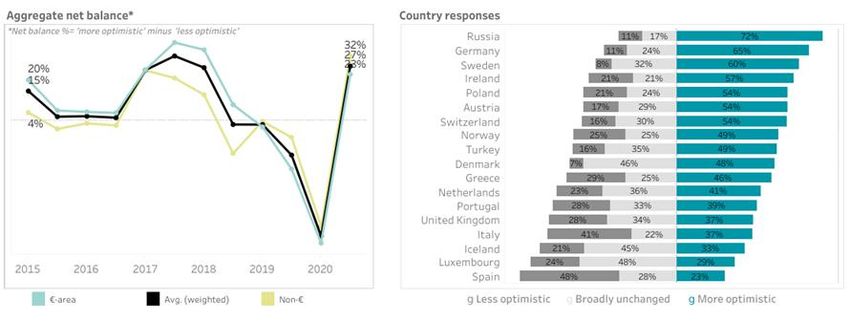
Impact on financial markets
A sharp rise in cases across Europe and elsewhere has been driving down stock prices over recent
weeks, while a large sector divergence continues
                                                                                                                                                  Equity markets: Sectoral indices in Europe1
 •      European equity markets continue to show sector divergence.
 •      Medical & Pharmaceuticals stocks, and especially Technology                                                                                          Major outbreak in Europe
        stocks, continue to hold high valuations compared to pre-                                                120
        outbreak levels.
                                                                                                                 110

                                                                                            (2 Jan 2020 = 100)
                                                                                                                                                                                                                                      105
 •      However, after the recent stock market falls, only the

                                                                                             Sectoral indices
                                                                                                                 100
                                                                                                                                                                                                                                      95
        Technology Sector is showing pricing levels higher than at the                                            90
        beginning of the year.                                                                                    80
 •      After regaining some ground over the summer, financial stocks                                             70                                                                                                                  71
                                                                                                                                                                                                                                      66
        since fallen back and are now 29% below January levels.                                                   60
                                                                                                                  50                                                                                                                  53
 •      The Transport industry, including airlines, continues to be
                                                                                                                  40
        affected by the virus-related travel restrictions, and an                                                  30 Dec
                                                                                                                    1 Jan   1 Feb       1 Mar        1 Apr        1 May     1 Jun       1 Jul     1 Aug       24 Sep      1 Oct    1 Nov
        accelerating number of cases across the globe is once again                                                 2019
        dampening industry outlooks – the Transport index is down by                                                        Transport           Energy          Medical & Pharmaceuticals         Financial        Technology
        34% since the beginning of 2020.
                                                                                                                                        OMX C25 Index, median quarterly net income, DKKm2
 •      For similar reasons, expected demand for energy is falling again,
        and gains made between March and July have largely been                                           2,000
        eroded – the index is now down by some 47% since the
                                                                                                          1,500
        beginning of the year.
                                                                                   Quarterly net income

 •      The lower right-hand chart shows the development in quarterly                                     1,000
        net income results for OMX C25 Index constituents.
                                                                                                                 500
 •      Following a sharp drop in Q1 2020, net income results for Q2
        2020 indicate that Denmark’s largest companies have made a                                                0
        swift recovery with expectations pointing to a continued
        recovery in Q3 and median quarterly net income above pre-                                          (500)
                                                                                                              Q1 2019A      Q2 2019A       Q3 2019A          Q4 2019A     Q1 2020A      Q2 2020A Q3 2020 A/E           Q4 2020E   Q1 2021E
        outbreak levels over the remainder of 2020.
                                                                                                                                                75th percentile           Median          25th percentile

Note:     1) Refinitiv European sectoral price indices measured by Refinitiv (Thomson Reuters), 2) A=Actuals; E=Expected. Q3 2020 numbers are a blend of actuals and estimates
Source:   Thomson Reuters Eikon
Coronavirus Impact Monitor – 30 October 2020                                                                           Page 3                                                                                   Deloitte Economics © 2020
Deloitte Economics' Coronavirus Impact Monitor - Despite renewed stock market volatility and indications of increasing loan defaults, CFOs remain ...
Danmarks Nationalbank survey – Denmark
Banks report decrease in loan demands from existing corporate customers while seeing increase in
proportion of impairments and losses
                                                                                                                                                       Quarterly lending survey
 •      The quarterly lending survey from Danmarks Nationalbank
        reports the loan demand and proportion of impairments from                                                     Loan demand from existing customers                              Proportion of impairments and losses

        existing corporate customers based on responses from Danish
        banks.                                                                                          100

 •      In Q3 2020, 13 out of 19 banks report that loan demand from
        existing corporate customers has decreased since Q2, while                                       50
                                                                                                                                                                  Increase
        eight banks report that the proportion of impairments and
        losses has increased.                                                                             0

 •      The decrease in loan demand contrasts with the expectations
        indicated by the banks in the previous quarter regarding their                                                                                            Decrease
                                                                                                        -50
        expectations for the current quarter, which indicate that the
                                                                                                                         Net figure                Expectation
        impact of the virus in the second wave has not yet manifested
                                                                                                       -100
        itself in terms of increased liquidity needs.                                                             Q1            Q2            Q3             Q4                    Q1             Q2           Q3              Q4

 •      The decrease in net figure, which indicates the banks’ answers
                                                                                                                          Annual repayment percentages on Danes' mortgage loans
        weighted by their respective market shares, is the largest
        decrease since Q4 2011, which the banks suggest to be due to                                                       All mortgage loans
                                                                                                                                                                             Mortgage loans with repayments
        governance assistance packages leading to a lower liquidity
        need, while companies have been more reluctant to invest.                                                                                                                                              5.1%
 •      The proportion of impairments and losses has increased from                                               3rd quarter                3rd quarter               4.4%
        Q2 to Q3, in line with expectations, and six out of the eight                                                2019                       2020                                        4.0%
        banks expect a further increase in impairments and losses in
        Q4.                                                                                                                           2.8%
                                                                                                                2.4%
                                                                                                                                                         2.1%
 •      This is combined with an increase in the proportion of mortgage
        repayments from households, as the low interest rate
        environment has attracted residential borrowers to invest more
        in their home equity.                                                                                 Total               Fixed              Variable        Total               Fixed             Variable
                                                                                                                                   rate                rate                               rate               rate

Note:     1) Corporate customers in the lending survey cover 'Private non-financial corporations' and 'Personally owned companies'
Source: Danmarks Nationalbank
Coronavirus Impact Monitor – 30 October 2020                                                             Page 4                                                                                          Deloitte Economics © 2020
Deloitte Economics' Coronavirus Impact Monitor - Despite renewed stock market volatility and indications of increasing loan defaults, CFOs remain ...
CFO survey – Europe
Autumn 2020 (Q3) – optimism on “financial prospects” improves drastically

 •    The optimism on financial prospects for CFOs who answered
      Deloitte's survey has largely increased since Q1, which
      coincided with the first global wave of COVID-19.
 •    The global economy witnessed a large selloff across most of the
      financial indices in March and April, which were based on a lot
      of uncertainty and gloomy forecasts.
 •    The relatively sturdy economy in Europe, backed by large
      government capital injections, has enable European businesses
      to maintain fairly stable operations throughout the wave of
      lockdowns and travel restrictions.
 •    Denmark itself has fared much better than average, compared
      with its European counterparts, on the back of a direct action
      COVID policy, and timely government fiscal intervention.
 •    CFOs surveyed in Denmark responded with more assurance on
      expectations due to the transparency from the government, as
      well as strong fiscal support from government aid programmes,
      and a larger reliance on service, rather than goods-based
      industries.
 •    Danish CFOs have also held the lowest levels of ”less optimism”,
      which provides a sense that there was adequate assessment of
      the financial fall-out from COVID-19 in Q1 this year; juxtaposed
      to Italian and Spanish CFOs who maintain very high levels of
      poor financial outlooks.

Source:   Deloitte CFO Survey 12th Edition
Coronavirus Impact Monitor – 30 October 2020                             Page 5   Deloitte Economics © 2020
Deloitte Economics' Coronavirus Impact Monitor - Despite renewed stock market volatility and indications of increasing loan defaults, CFOs remain ...
Development in national debt to GDP – Denmark
Q2 shows high increase in EMU debt-to-GDP ratio

 •    In Q2 2020, the national debt to GDP saw a high increase
      compared to recent years, which illustrates the impact of the                     Danish debt-to-GDP ratio since 2008
      virus in terms of both GDP and EMU debt levels.
 •    With a debt level of 41% of GDP, the ratio is approaching levels
      similar to those seen in the years after the financial crisis. This is
      an increase of 8% in a single quarter, just short of the 9% jump
      in Q3 to Q4 2008.
 •    This high increase in debt, directly attributable to COVID-19, is
      worrisome, as it may only be the beginning of financing needs
      for the Danish government should any further waves of COVID
      affect the broader economy.
 •    As a result of both the rapid increase in borrowing needs and
      the decline in GDP across OECD economies, the central
      government marketable debt-to-GDP ratio for the OECD area is
      projected to increase by 13.4 percentage points to around 86%
      in 2020, the largest increase in a single year since 2007.
 •    Nevertheless, Denmark is still well placed to cushion the impact
      of the COVID induced recession, particularly for small and
      medium businesses through many different types of aid
      packages and fiscal schemes.
 •    It should be anticipated that debt levels will continue to rise
      over the next one to two years at a minimum. It remains to be
      seen whether this will have any material impact on the Danish
      government's credit rating.

Source:   Danmarks Statistik, OECD
Coronavirus Impact Monitor – 30 October 2020                                   Page 6                                         Deloitte Economics © 2020
Coronavirus heatmap
Deloitte Economics’ view on the short-term outlook across selected sectors in Denmark

 Consumer                                                                                                                          Denmark
 • Hospitality and furnishings companies face a lower intended spend by
    consumers.                                                                                 Sector
 Energy & Resources                                                                                               Short term                      Outlook
 • Coronavirus continues to affect electricity prices, while coal and gas are at
    pre-crisis levels.
 Financial Services                                                                          Consumer          Moderate impact               Moderate recovery
 • Valuation recovery stagnates, and the sector contemplates long-term
    changes.
 Industrials                                                                          Energy & Resources       Moderate impact               Moderate recovery
 • Overall positive Manufacturing outlook with record-high PMI numbers and
    strong Q3 growth.
                                                                                       Financial Services        High impact                 Moderate recovery
 Life Science & Health Care (LSHC)
 • Medical & Pharmaceuticals stocks have been performing well and are well
     above pre-outbreak levels.                                                              Industrials       Moderate impact               Moderate recovery
 Real Estate
 • Despite COVID-19, the Real Estate M&A market is expected to drop only by
                                                                                      Life Science & Health
    10% in 2020.                                                                                              Neutral/Low impact         Growth opportunities
                                                                                               Care
 Technology, Media & Telco (TMT)
 • TMT sectors have shown relative resilient to COVID-19, as the world has
    gone digital.                                                                            Real Estate       Moderate impact               Moderate recovery

 Transport
 • The transport market is in recovery following the opening of several                      Technology,
                                                                                                              Neutral/Low impact         Growth opportunities
    markets.                                                                                Media & Telco

 Please note that variations in industries may occur. We refer to pages 10-17
 for in-depth coverage of developments in selected industries.                               Transport         Moderate impact                 Slow recovery

Coronavirus Impact Monitor – 30 October 2020                                       Page 7                                                     Deloitte Economics © 2020
Key messages
CFOs maintain optimism in the face of a second wave even if any durable economic recovery
strongly hinges on our ability to control the COVID-19 pandemic
 •    COVID-19 is continuing its spread across the world, with more than 44 million confirmed cases in 188 countries. About 1.2m people have lost their lives.
 •    In Denmark, the number of confirmed cases has increased rapidly during the last weeks, reflecting that a second wave has arrived in Denmark. 1,191 new cases have been
      registered the last 24 hours, which is the highest number so far. The positive percentage, however, is decreasing, which reflects the relatively large amount of tests being
      conducted.
 •    As a consequence, the Danish government has instituted heightened measures of restrictions. The new restrictions include face mask requirements and gathering
      restrictions and will be adopted until at least the 2 January 2021.
 •    The sharp rise in cases across Europe and elsewhere has been driving down stock prices over recent weeks, while a large sector divergence continues. After the recent
      stock market falls, only the Technology Sector is showing pricing levels higher than at the beginning of the year. Last month also Medical & Pharmaceuticals stocks hold
      high valuations compared to pre-outbreak levels.
 •    The quarterly lending survey from Danmarks Nationalbank reports a decrease in loan demands from existing corporate customers and an increase in proportion of
      impairments and losses.
 •    According to Deloitte’s recent CFO Survey, however, CFOs remain optimistic in the face of a second wave.
 •    To ease the severe impact of covid-19 on the economy governments all over the world have introduces major aid packages and credit measures, which have been
      extended in the wake of the second wave. This is reflected in the development in national debt, which in Q2 shows high increase in EMU debt-to-GDP ratio.
 •    Deloitte Economics will continue monitoring the impact of the coronavirus in Denmark and globally. Find our updates here

                                                                 For questions on the contents of this report, please contact:

                      Majbritt Skov                                                     Tinus Bang Christensen                                  Peter Lildholdt
                      Partner, Head of Deloitte Economics                               Partner                                                 Vice President
                                                                                             Mobile: +45 30 93 44 63
                            Mobile: +45 30 93 54 71                                                                                                  Mobile: +45 40 35 25 36
                                                                                            tbchristensen@deloitte.dk
                            maskov@deloitte.dk                                                                                                       plildholdt@deloitte.dk

Disclaimer: The information in this document is intended for knowledge sharing only.

Coronavirus Impact Monitor – 30 October 2020                                                Page 8                                                           Deloitte Economics © 2020
Industry outlook

                        Consumer                              Page 10

                        Energy & Resources                    Page 11

                        Financial Services                    Page 12

                        Industrials                           Page 13

                        Real Estate                           Page 14

                        Technology, Media & Telco (TMT)       Page 15

                        Transport                             Page 16

                        Public                                Page 17

Coronavirus Impact Monitor – 30 October 2020              Page 9        Deloitte Economics © 2020
Consumer         Energy &       Financial      Industrials      Real Estate        TMT       Transport        Public
                                         Resources      Services

                      Industry outlook: Consumer
                      Hospitality and furnishings companies face a lower intended spend by consumers

                                                                                            Highlights from the industry (as of 28 October 2020)

                                                                                                Based on top 10 companies
                                                                                                                                          Deloitte State of the Consumer Tracker
                      110.0                                                                                             105.7
                                                                                                                            97.7     Consumers’ intention to spend more during the next four weeks
                      100.0
Indexed share price

                                                                                                                                   Clothing/                                                       Household                       Restaurant/
                                                                                                                            89.2                 Electronics   Furnishings        Groceries                        Medicine
                       90.0                                                                                                        footwear                                                          goods                           takeout

                                                                                                                            81.2
                       80.0

                       70.0
                                                                                                                                    -15%          -16%           -27%              21%              17%             10%              -21%

                       60.0
                          28 Dec 28 Jan 28 Feb 28 Mar 28 Apr 28 May 28 Jun 28 Jul                     28 Aug 28 Sep 28 Oct           Consumers’ intended purchase channel
                            19     20     20     20      20      20   20       20                       20     20     20
                                             1                 2             3
                                       Retail       Hospitality     Consumer                           MSCI World
                                                                                                                                     59%            53%              66%                                                               64%
                                                                                                                                                                                    82%              79%             82%
                         Retail index has moved from index 105.2 to 105.7 (since last update).                                       12%            12%
                                                                                                                                                                            10%                                                                12%
                                                                                                                                     30%            34%              24%                      7%      7%     14%              8%       24%
                         Hospitality index has moved from index 82.7 to 81.2 (since last update).                                                                                   11%                              11%

                         Consumer index has moved from index 90.4 to 89.2 (since last update).
                                                                                                                                                          In store         Online - Pickedup          Online - Delivered

                                                                                                      Trading multiples and economic outlook
                                              Index: MSCI World Retailing Index (top 10 companies)                                        Latest consumer confidence index4 (as of September 2020) has increased to
                                         Historical averages                        Coronavirus impact
                                          (EV/FY0 EBITDA)                            (EV/FY0 EBITDA)                                      98.8, illustrating a positive development, but still indicating a somewhat
                                                                                                                                          doubtful attitude towards the future economic development.
                                                                                               -3.7x
                                                                                                                                   101
                               12,7x           14,2x          14,5x                    17,0x                                                                                                                                            98.8
                                                                                                        13,3x
                                                                                                                                     98

                                                                                                                                     95
                                                                                                                                      Sep-06      Sep-08       Sep-10         Sep-12      Sep-14           Sep-16     Sep-18          Sep-20
                              10y avg.        5y avg.        3y avg.                 Jan 1, 2020       Current
                                                                                                                                                                Consumer confidence index (OECD-Europe)

                      Note:     1) MSCI World Retailing Index; 2) MSCI World Consumer Services Index; 3) MSCI Consumer Staples Index; 4) Based on OECD – Europe region
                      Sources: Capital IQ; MSCI; European Parliament; Deloitte State of the Consumer Tracker
                      Coronavirus Impact Monitor – 30 October 2020                                                    Page 10                                                                                  Deloitte Economics © 2020
Consumer           Energy &          Financial           Industrials           Real Estate            TMT            Transport    Public
                     Resources         Services

Industry outlook: Energy & Resources
Coronavirus continues to affect electricity prices, while coal and gas are at pre-crisis levels

                                                                                        Highlights from the industry (as of 28 October 2020)

140                                                                                                                                   Hydropower generation
120                                                                                                                                   − Prior to Corona, electricity prices were already pressured in the Nordics due to
                                                                                                                                        a warm winter, which increased the generation capacity of Norwegian
100
                                                                                                                                        hydropower plants.
 80
                                                                                                                                      − Further, the mild winter decreased demand for electricity.
 60
                                                                                                                                      Lockdown affects demand
 40                                                                                                                                   − The coronavirus lockdown negatively affected the demand of public
 20                                                                                                                                     institutions, private individuals and corporations.
 1 jan 20            1 mar 20          1 maj 20                  1 jul 20               1 Sep 20            1 Nov 20
                                                                                                                                      Carbon market prices
               Natural gas TTF, spot       Coal API2, spot               Nordic electricity future, Q4-20                             − Lower emissions of CO2 and other greenhouse gasses led to a decrease in
                                                                                                                                        carbon prices.
   Mild winter puts pressure on Nordic electricity prices prior to Corona crisis.
                                                                                                                                      − Coal became cheaper, lowering overall prices, as coal is marginally price
   Electricity demand decreased marginally due to coronavirus lockdown.
                                                                                                                                        setting. This creates a self-enforcing effect, which drives down prices even
   Significant drop in carbon emissions resulting in lower prices.                                                                      further.

                                                                                                                 Economic outlook

                                                   Selected futures
                 -40.1%
                                                                                                                                      Both coal and gas prices are back to pre-COVID levels, however electricity prices
                                                        -41.7%
                                                                                                    -6.7%                             continue to be depressed. Q4 Nordic electricity futures were c. 40% lower at the
            35                                     33                                                                                 end of Q3 compared to the beginning of the year.
                          21                                     19                            25           23
                                                                                                                                      The impact on electricity producers continues to be significant, but we expect
                                                                                                                                      prices to rebound, as the marginal cost of conventional energy sources increases.
        Nordic power, Q4-20                  Nordic power, FY-21                               EUA, Dec-20
                                            Jan 1, 2020               Oct 28,   20201

Note:       1) As of end September for Nordic Power, Q4-20
Source:     Thomson Reuters Eikon
Coronavirus Impact Monitor – 30 October 2020                                                                           Page 11                                                                   Deloitte Economics © 2020
Consumer           Energy &            Financial        Industrials     Real Estate           TMT          Transport         Public
                     Resources           Services

Industry outlook: Financial Services
Valuation recovery stagnates, and the sector contemplates long-term changes

                                                                                Highlights from the industry (as of 22 September 2020)
120                                                                                                                      Banks and consumer finance
110                                                                                                       [97.8]         − Capital cushions among banks have proven to be adequate for most of the economic
                                                                                                                            scenarios for 2020, laid out by central banks. Regardless, they must rebuild, and in the
100                                                                                                       [82.3]
                                                                                                                            short-term, banks should expect credit losses on a scale not seen since the Global
 90                                                                                                       [82.3]            Financial Crisis (GFC). Going forward, banks may undertake overhauls of their business
 80                                                                                                                         models. In the current low-rate and low-growth environment, not all banks will succeed
                                                                                                          [81.5]
 70                                                                                                                         with such transformation, which may prompt consolidation in the industry.
 60                                                                                                       [76.4]
 50
                                                                                                                         Insurance
                                                                                                          [59.9]         − Allianz SE expects global insurance premium income to shrink by 3.8% in 2020, which is
 40
                                                                                                                             three times the pace witnessed in the GFC. However, insurers may benefit from greater
 30
                                                                                                                             risk awareness. Demand for more comprehensive and simpler health insurance may
              1/31/20 2/28/20         3/31/20 4/28/20     5/29/20 6/30/20         7/31/20 8/31/20
                                                                                                                             increase, and with travel expected to only gradually recover from the collapse during
               Nordic Banks                          Nordic Insurance        European AM                                     lockdowns, the industry may undertake product improvements and premium changes in
               Nordic Consumer Finance               Nordic DCA              MSCI World                                      several areas.
      While the average world market has almost returned to price levels that                                            Asset Management
      preceded the COVID-19 crisis, the Financial Services sector remains under                                          − COVID-19 caused a halt to a long and consistent annual growth trajectory for asset
      pressure from renewed concerns of new COVID-19 outbreaks.                                                             managers, presenting several imperatives for their businesses. These include developing
      Nordic banks and asset managers have seen market value stagnate, adding                                               differentiated product offerings (e.g., sustainable investing), providing advice supported
      pressure to the gains made over the summer. Consumer finance and DCA have                                             by strong digital capabilities, improved approaches to cost cutting, streamlined service
      shown the largest gains in market value since their mid-March low point.                                              deliveries and transformation of operating models.
                                                                                         Trading multiples and economic outlook
                                                  Index: S&P Capital IQ1
          Market capitalization (1 Jan = index 100)          Coronavirus impact (P/BV)3                                      Loan provisions related to COVID-19 were front-loaded in H1 2020, but with
                                       16-03-20        22-09-20                      -0.4x                                   government support schemes expired, and newly instituted lockdown measures in
                                                                                                                             place throughout the Nordic region, increases in actual losses are expected in the
             82          81           82                                 1,8x
        69          65                       67 76           60                                 1,4x                         coming quarters.
                                 52                     43                            1,1x
                                                                                                                             While not on the same scale as the GFC, the economic consequences of the pandemic
                                                                                                                             have proved to be severe. The effects of COVID-19 may restructure the Financial
                                                                                                                             Services sector in several dimensions, including competitive structure, sources of
        Nordic    European Nordic   Nordic              Nordic          Jan. 1,     Mar. 16,   Sep. 22,
        Banks        AM   Consumer Insurers             DCA2             2020        2020       2020
                                                                                                                             growth, innovation, customer interaction, and digital technologies.
                            Banks
Notes        1) Indices are from Stoxx Europe 600 Financial Services and MSCI World; 2) DCA: Debt Collection Agencies; 3) P/BV is measured as average of Nordic Insurers, banks, and DCA.
Sources: A. Allianz Insurance Report 2020: https://www.allianz.com/en/economic_research/publications/specials_fmo/01072020_Insurance_Report.html
Coronavirus Impact Monitor – 30 October 2020                                                                 Page 12                                                                        Deloitte Economics © 2020
Consumer          Energy &         Financial       Industrials     Real Estate          TMT             Transport           Public
                    Resources        Services

Industry outlook: Industrials
Overall positive Manufacturing outlook with record-high PMI numbers and strong Q3 growth

                            Share price development year-to-date                                                   Manufacturing PMI level for the Eurozone reaches 26-month high in October
                                                                            Indexed share price as of:                                                                         October          August
140
                                                                               29 Oct      24 Sep                                                     53.3
                                                                                                                                                      53.2                     September        July
120                                                                                                                    US                             53.1
                                                                                126.6           122.0
                                                                                                                                                     50.9
100                                                                             103.3           108.5                                                                    The two-speed economy
                                                                                 99.3              98.3                                                                  continues through October,
                                                                                                                                                        53.3
 80                                                                                                                                                     54.1
                                                                                 83.5              85.8
                                                                                                                       UK                                                with Manufacturing being
                                                                                                                                                         55.2
 60                                                                                                                                                     53.3             driven by strong order inflow,
                                                                                                                                                                         while the service sub-
 40
                                                                                                                                                         54.4            industry realises excess
 1 Jan 20      1 Mar 20    1 May 20       1 Jul 20       1 Sep 20   1 Nov 20
                                                                                                                                                         53.7            capacity, leading to ongoing
                                                                                                                  Eurozone                              51.7
            Industrials    Materials        Automotive         MSCI World                                                                               51.8             cut of employment.

        Indices have dropped in recent days driven by COVID-19 second wave and
                                                                                                                                                         58.0
        election uncertainties.                                                                                                                          56.6
                                                                                                                                                                      IHS Markit Manufacturing PMI:
                                                                                                                  Germany                             52.2            Index =50:           No change
        However, futures jumped on 29 Oct, as the US economy notches record growth in
                                                                                                                                                     51.0             Index 50:           Expansion

                                                                                                Trading multiples

                   MSCI World Industrials Index                                            MSCI World Materials Index                                      MSCI World Automotive Index

          Historical averages                Coronavirus impact                    Historical averages                  Coronavirus impact         Historical averages              Coronavirus impact
             (EV/EBITDA)                        (EV/EBITDA)                           (EV/EBITDA)                          (EV/EBITDA)                (EV/EBITDA)                      (EV/EBITDA)

                                                     -1.5x                                                                        +1.3x                                                     -0.2x

                  13.1x     14.0x                13.8x      12.3x               10.5x      11.7x          12.0x              11.8x     13.1x    10.2x        9.9x    10.0x            11.1x       10.9x
      11.7x

  10y avg.       5y avg.   3y avg.           Jan 1, 20 Current                 10y avg.   5y avg.     3y avg.           Jan 1, 20 Current      10y avg.    5y avg.   3y avg.        Jan 1, 20 Current

   Since last update (24 September 2020), the                                  Since last update (24 September 2020), the                      Since last update (24 September 2020), the
   EV/EBITDA multiple is down from 12.9x to 12.3x.                             EV/EBITDA multiple is down from 13.8x to 13.1x.                 EV/EBITDA multiple is up from 10.7x to 10.9x.

Note:       1) Data as of 29 October 2020
Source:     Capital IQ; MSCI World Indices; IHS Markit; Bloomberg
Coronavirus Impact Monitor – 30 October 2020                                                               Page 13                                                               Deloitte Economics © 2020
Consumer                         Energy &         Financial      Industrials        Real Estate              TMT    Transport                   Public
                                   Resources        Services

Industry outlook: Real Estate
Despite COVID-19, the Real Estate M&A market is expected to drop only by 10% in 2020

                                                                                              Highlights from the industry (as of 28 October 2020)

                             110                                                                                     2.0%                           General recovery from COIVD-19, but other thunderstorms are threatening
                             100                                                                                     1.8%                           − Except from certain sectors, such as Transportation, Hospitality and
                                                                                                                                                      Tourism, the industry as a whole is recovering.
        (2 Jan 2020 = 100)
         Stock price index

                              90                                                                                     1.5%

                                                                                                                            Interest rate
                                                                                                                                                    − However, there is still uncertainty about the potential change to taxation
                              80                                                                                     1.3%                             of properties from 2023, and recently the government has announced
                                                                                                                                                      that the new public valuation model of commercial properties will be
                              70                                                                                     1.0%
                                                                                                                                                      postponed, leaving even more uncertainty about taxation.
                              60                                                                                     0.8%
                                                                                                                                                    M&A market expected to drop by c. 10% in 2020
                              50                                                                            0.5%                                    − Despite a troublesome Q2, the first three quarters of 2020 are about at
                               Jan 20 Feb 20 Mar 20 Apr 20 May 20 Jun 20 Jul 20 Aug 20 Sep 20 Oct 20                                                  same level as 2019. However, Q4 will not be as good as 2019.
                                       STOXX 600 Real Estate Index             Danish long-term mortgage rates
                                                                                                                                                    − In total, the Danish RE M&A market will reach c. DKK 55bn in 2020
                             The leading real estate index has been fixed on 80 for a while, which may indicate that it will                          compared to DKK 60bn in 2019.
                             take some time before we are back at pre-COVID-19 level.                                                               − It seems that there is general consensus that housing prices will decrease
                             However, interest rates are now below pre-COVID 19 level, supporting the Real Estate M&A                                 in Q4. However, the supply of especially apartments in major Danish
                             market. However, due to uncertainty about the impact of second wave, we expect more                                      cities is back to pre-2007 level, while demand is still strong.
                             volatility.

                                                                                                      Trading multiples and economic outlook
                                                  Index: Custom weighted average index1                                                     Price multiples are almost at pre-COVID-19 levels, and in general the major listed RE
                        Historical averages (EV/EBITDA)                      Coronavirus impact (EV/EBITDA)                                 companies are well-positioned to handle the crisis.
                                                                                              -1.9x
                                                                                                                                            As interest rates may continue at a record low level, Real Estate assets will continue to be an
                  27.6x                  25.4x            27,8x                    30,7x               28,8x                                attractive asset class. The COVID-19 crisis proved the resilience of the asset class, and we
                                                                                                                                            expect this to continue.

                                                                                                                                            Despite COVID-19 and uncertainty about future taxation, the RE M&A market is almost at
              10y avg.                  5y avg.          3y avg.                 1 Jan 2020           Current                               2019 level. In case there will be a reasonable solution to the liquidity issue from the new
                                                                                                                                            proposed taxation model , we believe that 2021 will be at 2020 level.
Note:                1) Based on Collier International, Patrizia AG, Agate Ejendomme, Jeudan A/S, and Park Street Nordicom
Source:              Finans Danmark, Thomson Reuters Eikon, Capital IQ, Colliers International, Danmarks Statistik, Konjunkturanalyse 2019, and Cushman Wakefield RED
Coronavirus Impact Monitor – 30 October 2020                                                                           Page 14                                                                                 Deloitte Economics © 2020
Consumer          Energy &         Financial     Industrials       Real Estate                        Transport   Public
                    Resources        Services                                            TMT

Industry outlook: TMT
TMT sectors have shown relative resilient to COVID-19, as the world has gone digital

                                                                         Highlights from the industry (as of 29 October 2020)

130                                                                                                                      TMT perceived as a defensive sector, which has less to lose from COVID-19
120                                                                                               113
                                                                                                  108                 Telecom: Spend among consumers is often within a contract; demand is up; need
110
                                                                                                  106                 is not discretionary (new cars) or constrained (leisure).
100                                                                                               98
 90                                                                                                                   Media and Entertainment: Financial impact varies across sub-sectors. Media
 80                                                                                                                   consumption up (e.g., Netflix, Disney+), but willingness/ability to pay may be
 70                                                                                                                   constrained, as economic outlook exacerbates. Events (consumer, business)
 60                                                                                                                   mostly heavily restricted; cinemas, theatres, museums mostly closed. TV and
   1 Jan 20                                                                             29 Oct 20                     movie production mostly halted. Theme parks mostly closed.
       Information Technology1       Communication Services1        Media and Entertainment1           MSCI World
                                                                                                                      Technology: Some segments (e.g., robotics, communication software) seeing
      TMT companies are trading above the overall equity market.                                                      record demand; digital transformation being accelerated; companies catering to
                                                                                                                      SMEs may suffer from customer liquidity.
      Media and Entertainment quickly recovered after the shockwave on the stock market. As
      people stay home, the entertainment market is making records.2

                                                                                   Trading multiples and economic outlook
                                 Index: MSCI World Information Technology1                                            Forrester has revised its IT spending forecast downward and expects a 50%
              Historical averages (EV/EBITDA)                    Coronavirus impact (EV/EBITDA)                       probability that global tech markets will decline by 2% or more in 2020 if a full-
                                                                             -1.1x                                    fledged recession hits.
                          25.8x           28.3x                      28.0x
          21.1x                                                                      26.9x                            Gartner expects global IT spending in 2020 to decline by +6%.

                                                                                                                      Software spending is the subsector expected to show the highest resilience, while
                                                                                                                      computer equipment and IT consulting and systems integration services spending
        10y avg.         5y avg.         3y avg.                 Jan 1, 2020         Current                          is expected to show weaker growth.

Note:    1) MSCI World industry indices used (top 10 companies for sector indices), 01-01-2020 = index 100; 2) In EMEA and selected Asian countries, physical games sales are up by 63% according to
         GamesIndustry.biz.
Source: S&P Capital IQ, Gartner Market Databook (April 2020 update), Forrester Research (March 2020)
Coronavirus Impact Monitor – 30 October 2020                                                   Page 15                                                                       Deloitte Economics © 2020
Consumer          Energy &             Financial     Industrials       Real Estate                                        Public
                    Resources            Services                                               TMT            Transport

Industry outlook: Transportation
The transport market is in recovery following the opening of several markets

                                                                              Highlights from the industry (as of 25 September 2020)

 130                                                                                                                          Transport stocks indicate belief in the market’s recovery

 120                                                                                                                          − The rapid spread of COVID-19 has had a major impact on transport of global
                                                                                                             112.5              goods, with ripple effects from the shortfall in demand for goods from China.
 110                                                                                                         108.1
                                                                                                             105.0            − The growth in stock prices since the low point in mid-March indicates an
 100
                                                                                                                                expectation for a recovering demand, as global trade picks up after countries
  90                                                                                                                            have opened up, driving the recovery of physical retail.
  80
  70                                                                                                                          Airlines struggling to take off
  60                                                                                                                          − The MSCI Transportation Index has more or less recovered (it is now above
   Sep 19         Nov 19        Jan 20        Feb 20     Apr 20         Jun 20         Jul 20     Sep 20
                                                                                                                                pre-outbreak levels), which has been driven by the Railroads and Air Freight
                  MSCI World               MSCI Transportation            Danish Transportation Index                           and Logistics sub-industries, which hold a large weight in the index.
                                                                                                                              − This masks some of the other sub-industries’ fortunes, such as airlines, whose
   Transportation indices have largely followed the total market in recovering from lows around                                 stock prices are still well below pre-outbreak levels.
   March this year, implying an increased need for goods transportation.

                                                                      Trading multiples and economic outlook (as of 25 September 2020)
                                         Danish listed transport companies1                                                   The Shanghai Containerized Freight Index (SCFI) has risen by 39% since the
                    Historical averages                                   Coronavirus impact2
                     (EV/FY1 EBITDA)                                       (EV/FY1 EBITDA)                                    beginning of the year, having picked up markedly over the last few months.
                                                                                   +0.6x                                   1600
                                                                                                                           1400
          7,1x             7,4x               7,5x                     7,4x                           8,0x                 1200
                                                                                       4,6x                                1000
                                                                                                                            800
                                                                                                                            600
       10y avg.         5y avg.             3y avg.                  Last close    Trough         Current
                                                                                                                                  1      11       21        31     41       51       61        71       81
                                                                                                                                                    2019                                     2020
                                                                       2019
Note:      1) A.P. Møller-Mærsk, D/S Norden, DFDS, DSV Panalpina, NTG, TORM, 2) Lowest YTD was 4.6x on 20 March 2020
Source:    Capital IQ, Shanghai Shipping Exchange, Forbes, IHS Markit
Coronavirus Impact Monitor – 30 October 2020                                                                    Page 16                                                                   Deloitte Economics © 2020
Consumer           Energy &           Financial           Industrials      Real Estate                                               Public
                         Resources          Services                                                    TMT            Transport

  Industry outlook: Public
  Managing the society through the second wave

                                                                                       Highlights from the industry (as of 30 October 2020)
                                       A timeline for COVID 19 government response
                                                                                                                                           Reducing the severe impacts of the second wave
        Pre-
                         Initial response               Adapt                         Recover and thrive                                   − The government’s focus is on containing the second wave of the outbreak, while
      COVID 19                                                                                                                                minimising the severe economic consequences.
                                                                                                                      A new norm in        − The number of citizens tested has increased significantly and fewer people are
                                                                                                                        government
                                                                                                                                              hospitalised.
                                                                                                                      flexibility is set
Level of flexibility
  and speed in                                                                                                                             Reopening initiatives have been partially rolled back
  government
                                                                                                                                           − The second wave has imposed a need for new restrictions. Compared to the first
                                                                                                                                              wave, restrictions are more targeted and experience-based, which keeps the
                                                                                                                                              majority of businesses running.
                                        ∼4-6 months               ∼8-10 months          ∼12-18 months
                                                                                                                         TIME              − Requirements for face masks in public transport and other public spaces as well
       Act to promote safety and continuity                                                                                                   as restrictions on freedom of assembly have been introduced.
     • Ensure the safety of citizens
                                             Adapt measures through experience                                                             − Pressure on government to help industries affected by the restrictions.
     • Focus on essentials
                                            • Gradual reopening
     • Fast response to an unknown and                                               Recover and emerge stronger                           Deficit on public finances
                                            • Fast and specialised restriction
       unprecedented situation
                                              adaptations to changes in            • Responsible total reopening of                        − The aid packages and other initiatives amount to a total value of more than 12
     • Offer maximum flexibility              infection rates                        society
                                                                                                                                               billion DKK.
                                            • Learning from experience             • Long-term enhancements in the
                                                                                     public sector                                         − Public EMU debt is expected to increase from 33% of GDP in 2019 to
                                                                                   • A new level of flexibility                              approximately 46% of GDP in 2020.

                                                                                                                  Economic outlook

         Aid packages for certain industries and focus on mitigating impact of restrictions in the private sector through earlier start-up of planned investment and prepayment of suppliers are
         expected to ease the negative impact on the economy. For instance, infrastructure investments in the municipalities have increased.

         Aid packages and the economic setback will have an immediate negative impact on public finances and may challenge government spending in the long term.

         After a budget surplus in 2019, the Ministry of Finance expects a deficit of 4.5% of GDP in 2020. In 2021, the economy is expected to grow by 3.6%. This is an slight downward adjustment
         compared to the June 2020 outlook, primarily explained by restrictions imposed by the government relating to the second wave of infections.

         Digitalisation in the public sector may be boosted, as the crisis has reinforced virtual ways of working.

   Sources: Deloitte Insights, Government’s response to COVID-19. From pandemic crisis to a better future, April 2020, Ministry of Finance, August 2020, KL, Danmarks Nationalbank
   Coronavirus Impact Monitor – 30 October 2020                                                                         Page 17                                                                      Deloitte Economics © 2020
Industry outlook: Deloitte contacts
How Deloitte can help you
                                                                                      Consumer                       Energy & Resources
 •    Please use the contact details opposite to get in touch with our
      Financial Advisory industry group leaders and find out how we can          Mads Damborg                        Troels Ellemose Lorentzen
      assist you.                                                                Partner                             Partner
 •    We are well-positioned to assist in a range of tasks, such as those
                                                                                 Email: madsdamborg@deloitte.dk      Email: tlorentzen@deloitte.dk
      below.
                                                                                 Mobile: +45 30 93 54 81             Mobile: +45 30 93 56 90

                              Focus areas                                        Financial Services               Life Science & Health Care

                                                                                 Björn Lagerstam                     Mads Damborg
                           State aid packages
                                                                                 Partner                             Partner

                                                                                 Email: blagerstam@Deloitte.dk       Email: madsdamborg@deloitte.dk
                      Liquidity scenario analysis
                                                                                 Mobile: +45 30 93 48 30             Mobile: +45 30 93 54 81

                 Debt covenant advice and financing                         Government & Public Services                       TMT

                                                                                 Rikke Beckmann Danielsen            Kasper Svold Maagaard
                   Business restructuring and M&A                                Partner                             Partner

                                                                                 Email: rdanielsen@deloitte.dk       Email: kmaagaard@deloitte.dk
                Bankable business plan development                               Mobile: +45 30 93 56 92             Mobile: +45 30 93 54 54

           Stakeholder management and process control                                 Industrials                        Real Estate

                                                                                 Niels Stoustrup                     Tinus Bang Christensen
                          Impact assessment                                      Partner                             Partner

                                                                                 Email: nstoustrup@deloitte.dk       Email: tbchristensen@deloitte.dk
                Economic modelling and forecasting                               Mobile: +45 30 93 59 15             Mobile: +45 30 93 44 63

Coronavirus Impact Monitor – 30 October 2020                                Page 18                                              Deloitte Economics © 2020
Appendices

                        GDP Forecasts                                                 Page 20

                        Corporate sector expectations earning                         Page 21

                        Market volatility and European credit default probability     Page 22

                        Deloitte Government Response Portal                           Page 23

Coronavirus Impact Monitor – 30 October 2020                                Page 19             Deloitte Economics © 2020
GDP forecasts
Danmarks Nationalbank forecasts a recession of -3.6% growth for 2020, with a return to previous
levels of GDP by 2022
 •      In its ”Outlook for The Danish Economy — September 2020”, Danmarks Nationalbank has stated that the drop in growth will be -3.6% lower than expected for the year,
        with a rebound to 3.6% in 2021 and 2.3% in 2022.

 •      The OECD and the World Bank forecasts are still broadly consistent with those from the IMF in the sense that they paint a picture of a sharp downturn in 2020, followed by
        a recovery in 2021. The contractions of the economy are primarily due to major drops in Q1 and partly in Q2 2020. Economic activity is expected to increase continuously
        from Q3. The biggest question remains around further incidences of waves and shutdowns rippling through the world economy.

 •      A big risk is those countries which are reliant on tourism and travel-related business, as their recovery will be stalled until normal travel conditions can resume. Denmark
        remains decently diversified in its economic industries and risks, enabling a relatively positive comparison in terms of depth of recession, but a more subdued growth
        thereafter.

                                                                                    Eurozone: GDP growt h                                                 World: GDP growt h
                                                                       8%                                                                8%
                                                                       6%                                                                6%
                                                                                                                                 5.2%
                                                                       4%                                                                                                                           4.9%
                                                                                                                   1.2%                  4%                                            2.9%
                                                                       2%
                                                                        -                                                                2%

                                                                      (2%)                                                                 -
                                                                      (4%)                                                              (2%)
                                                                      (6%)
                                                                                                                                        (4%)
                                                                      (8%)
                                                                                                                                                                                               (5.4%)
                                                                    (10%)                                                    (9.8%)     (6%)

                                                                    (12%)                                                               (8%)

                                                                                                                                               2015
                                                                             2007

                                                                             2015

                                                                                                                                               2005
                                                                                                                                               2006
                                                                                                                                               2007
                                                                                                                                               2008
                                                                                                                                               2009
                                                                                                                                               2010
                                                                                                                                               2011
                                                                                                                                               2012
                                                                                                                                               2013
                                                                                                                                               2014

                                                                                                                                               2016
                                                                                                                                               2017
                                                                                                                                               2018
                                                                                                                                               2019
                                                                                                                                               2020
                                                                                                                                               2021
                                                                             2005
                                                                             2006

                                                                             2008
                                                                             2009
                                                                             2010
                                                                             2011
                                                                             2012
                                                                             2013
                                                                             2014

                                                                             2016
                                                                             2017
                                                                             2018
                                                                             2019
                                                                             2020
                                                                             2021
                                                                                   Historical (IMF)              Avg. forecast                         Historical (IMF)             Avg. forecast
                                                                                   IMF                           OECD                                  IMF                          OECD
                                                                                   World Bank                                                          World Bank

Note:     Labels shown in the charts represent average forecast. GDP forecasts as of June 2020, with the exception of IMF’s forecast for Denmark which was made as of April 2020.
Source:   IMF, OECD, World Bank
Coronavirus Impact Monitor – 30 October 2020                                                    Page 20                                                                       Deloitte Economics © 2020
Corporate sector earnings expectations
Corporate earnings expectations have been severely curtailed since the outbreak,
although analysts have become more optimistic
 •      The selloff in European equity markets, triggered by the                                                   Change in net income consensus estimates between
        COVID-19 pandemic and the associated economic slowdown,                                                         31 January 2020 and 28 October 20201
        differs across sectors, see page 3.
 •      To shed light on the underlying drivers of this selloff across                                                                                                Energy
        sectors, the chart opposite displays changes in expectations of
                                                                                                                                                                      Consumer discretionary
        stock analysts. In particular, the chart shows how stock
        analysts have downgraded consensus expectations for net                                                                                                       Financials
        income across sectors and time:
                                                                                                                                                                      Communications services
        − The Energy sector has seen its net income estimates being
          downgraded by 40%-70% in 2020-2021, likely due to sharp                                                                                                     Industrials
          declines in oil and gas prices.
                                                                                                                                                                      Utilities
        − Consumer Discretionary, Financials, and Communication
          Services are also expected to be severely affected. Their net                                                                                               Materials
          income estimates for 2020 are, on average, more than 20%
          below pre-crisis estimates.                                                                                                                                 Other consumer staples

        − Transportation shows significant divergences in the                                                                                                         Information Technology
          underlying data, with airlines in particular showing heavy
          expected losses in 2020, while other freight firms are                                                                                                      Real estate

          showing a strong improvement, and due to their weight in                                                                                                    Health care
          the index are pulling the sector into growth territory.
                                                                                                                                                                      Food & staples retailing
        − Only the Health Care and Food & Staples retailing sectors’
          2020 expectations have improved.                                                                                                                            Transportation
 •      In general, analyst expectations are improving (or becoming
                                                                                   (70%)   (60%)   (50%)   (40%)    (30%)   (20%)   (10%)     -    10%    20%   30%
        less negative) compared with our last analysis in September
                                                                                                                            2020    2021    2022   2023
        2020.

Note:      1) Based on analyst estimates for S&P Europe 350 Index constituent companies
Source:    S&P Capital IQ
Coronavirus Impact Monitor – 30 October 2020                                                  Page 21                                                                      Deloitte Economics © 2020
Market volatility and European credit default probability
Equity market volatility remains elevated and comparable to the levels observed during the GFC

                                                                                                                                                                  VSTOXX Index1
                                                                                                               100

                                                                                                               90
 •      The VSTOXX Index measures 30-day implied volatility of
                                                                                                               80                   81
        the EURO STOXX 50 equity index and reflects investors'                                                                                                                                                          74

                                                                                 Volatility index
                                                                                                               70
        uncertainty about future equity market moves.
                                                                                                               60
 •      As shown, the coronavirus induced an increase in volatility to a
                                                                                                               50
        level comparable to that experienced during the GFC in 2008.
                                                                                                               40                                                                                                            39
 •      Volatility fell back over the summer and through to September,                                         30
        but has increased in the most recent weeks, as accelerating
                                                                                                               20
        COVID-19 case numbers weigh on financial markets.
                                                                                                               10

                                                                                                                0
                                                                                                                2007     2008   2009       2010   2011   2012   2013   2014   2015   2016   2017   2018   2019   2020    2021

                                                                                                                                              iTraxx Europe Crossover index: Default probability2
                                                                                                                     %
 •      The chart opposite shows the development in the implied
                                                                                                               70
        default probabilities based on the 5Y iTraxx European                                                                      61.7%
        Crossover spread of Credit Default Swaps and an assumed                                                60
                                                                                                                                                     50.2%
                                                                                    Default probability in %

        recovery rate of 40%. It measures default probabilities on a
                                                                                                               50
        portfolio of sub-investment grade corporate debt in Europe.                                                                                                                                              43.3%

                                                                                                               40
 •      The default probability has fallen significantly from the peak
        reached in March 2020, and the current level (27%) is now                                              30
                                                                                                                                                                                                                             26.5%
        once again in line with long-term levels.
                                                                                                               20
 •      As the index reflects cost of debt, refinancing remains costlier
                                                                                                               10
        for leveraged companies compared to pre-outbreak, even
        though interest rates are very low.                                                                     0
                                                                                                                2007     2008   2009       2010   2011   2012   2013   2014   2015   2016   2017   2018   2019   2020    2021

Note:     1) VSTOXX as volatility index of EURO STOXX; 2) Default probability calculated based on 5Y iTraxx European Crossover CDS and a recovery rate of 40%
Source:   Thomson Reuters Eikon
Coronavirus Impact Monitor – 30 October 2020                                                                             Page 22                                                                      Deloitte Economics © 2020
Deloitte Government Response Portal
Database of financial, tax, business and social measures announced by governments globally

 •    To aid our clients in navigating the complex landscape of COVID-19 assistance programmes, we have developed a free digital portal that captures the latest financial, tax,
      business and social measures enacted by country.

                                                                           Access the portal!

Coronavirus Impact Monitor – 30 October 2020                                          Page 23                                                               Deloitte Economics © 2020
This communication contains general information only, and none of Deloitte Touche Tohmatsu Limited (“DTTL”), its global network of member firms or their related entities (collectively,
the “Deloitte organization”) is, by means of this communication, rendering professional advice or services. Before making any decision or taking any action that may affect your finances or
your business, you should consult a qualified professional adviser. No representations, warranties or undertakings (express or implied) are given as to the accuracy or completeness of the
information in this communication, and none of DTTL, its member firms, related entities, employees or agents shall be liable or responsible for any loss or damage whatsoever arising
directly or indirectly in connection with any person relying on this communication. DTTL and each of its member firms, and their related entities, are legally separate and independent
entities.

Deloitte is a leading global provider of audit and assurance, consulting, financial advisory, risk advisory, tax and related services. Our global network of member firms and related entities in
more than 150 countries and territories (collectively, the “Deloitte organization”) serves four out of five Fortune Global 500® companies. Learn how Deloitte’s approximately 330,000
people make an impact that matters at www.deloitte.com.

Deloitte refers to one or more of Deloitte Touche Tohmatsu Limited (“DTTL”), its global network of member firms, and their related entities (collectively, the “Deloitte organization”). DTTL
(also referred to as “Deloitte Global”) and each of its member firms and related entities are legally separate and independent entities, which cannot obligate or bind each other in respect
of third parties. DTTL and each DTTL member firm and related entity is liable only for its own acts and omissions, and not those of each other. DTTL does not provide services to clients.
Please seewww.deloitte.com/about to learn more.

© 2020 Deloitte Statsautoriseret Revisionspartnerselskab. For information, contact Deloitte Global.
You can also read