Schwab 2015 Market Outlook
←
→
Page content transcription
If your browser does not render page correctly, please read the page content below
Schwab
                               2015 Market
                                 Outlook
             Panelists

            Jeffrey Kleintop           Liz Ann Sonders            Kathy Jones    Randy Frederick
            Chief Global               Chief Investment           Fixed Income   Managing Director,
            Investment                 Strategist                 Strategist     Trading &
            Strategist                                                           Derivatives

                                                     Host

                                                    Mark Riepe
                                                    Senior Vice
                                                    President,
                                                    Schwab Center for
                                                    Financial Research
Lorem ipsum dolor sit amet, consectetuer                                                              Page 00
Our Outlook for 2015
Divergence in economic conditions and monetary policies appears to be the overarching
theme for the year ahead.

The U.S. Federal Reserve is moving toward an interest-rate increase while other central
banks are searching for ways to stimulate the economies of their respective countries.

U.S. stocks are expected to continue to outperform broad international benchmarks.
On the fixed income side, higher-quality bonds should continue to perform well. Riskier
assets, such as emerging market bonds, may underperform as investors demand higher
yields to offset risks.

               • Fiscal policy may be more important to investors than        Jeff
                                                                              Jeffrey
                 monetary policy.                                             Kleintop
                                                                              Kleintop
 Markets
 Global

               • The rapid drop in oil prices will likely bolster global
                 economic growth in the short term.
               • Emerging market stocks are at a turning point because
                 of attractive valuations.

               • This secular bull market is likely in a more mature          Liz Ann
                 phase.                                                       Sonders
 Equities

               • Fed tightening cycles tend to usher in volatility and
   U.S.

                 pullbacks but don’t typically upend bull markets.
               • Lower energy prices put downward pressure on overall
                 inflation, a plus for the U.S. economy and stock market.

               • A stronger dollar is likely to hold down inflation and       Kathy
                 long-term interest rates.                                    Jones
 Income
  Fixed

               • We expect a moderate rate hike by midyear and
                 increased volatility.
               • We are concerned about liquidity in the bond market as
                 banks and dealers cut back on their inventory of bonds.

                                                                              Randy
               • Options traders generally perceive more upside               Frederick
 Derivatives
  Trading &

                 for U.S. stocks.
               • While volatility has receded in the short term,
                 nothing lasts forever and volatility could increase.

Schwab 2015 Market Outlook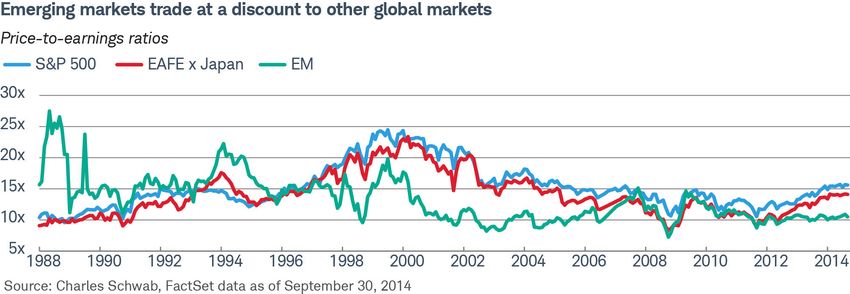
Global Markets

                     2015 Global Investment Outlook
                     For 2015, we forecast another year of gains for global stocks. Supporting factors
                     are revenue from slightly stronger global economic growth, boosted by central bank
                     stimulus, along with supportive fiscal policy — for the first time in a while. Also, global
                     growth could get a boost from the recent 25% decline in oil prices. The gains for stocks
                     may be accompanied by volatility stemming from a number of risks. These risks include
                     those posed by central bank actions that are complicated by varying levels of growth
                     around the world, flare-ups in geopolitical hot spots and the potential for natural
Jeffrey Kleintop
                     disasters, pandemics or other uncertain events to tip sluggish global growth into
Chief Global         a recession.
Investment
Strategist           Where will stocks offer investors the best potential return in 2015?
@JeffreyKleintop  Many factors influence the relative performance of U.S. and international stocks.
                  One indicator that has a solid track record of signaling when international stocks
may outperform U.S. stocks is the “current account.”
The current account is driven by trade and money flows in and out of the United States. In general over
the past 40 years, when the U.S. current account as a percentage of gross domestic product (GDP) was
improving, U.S. stocks outperformed international stocks. The opposite was true when the current account
worsened: International stocks outperformed U.S. stocks. Changes in the current account have led relative
stock market performance by about three quarters of a year.

The U.S. current account has flattened after improving steadily in recent years and could be near a change
in direction. The key to the direction in 2015 may be the dollar. If the U.S. current account were to deteriorate,
driven by a significant rise in the U.S. dollar, it would suggest that international stocks may finally begin to
outperform U.S. stocks in 2015.

The current account data for the third quarter will be released December 17, 2014. We will be watching this
closely for signs of a change in direction. But, given where the key drivers stand today, we expect developed
international stocks to lag those in the United States and emerging markets for several reasons: weaker
economies, slower application of stimulus in Europe and valuations that don’t account for the risks —
in addition to the trend in the current account.

Low oil prices could lead to upside surprises
The rapid drop in oil prices may act as a significant short-term boost to global economic growth. With the
amount spent on oil amounting to 4% of world GDP, the global price decline from around $110 in recent
years to about $80 is about 25%, which amounts to 1% of world GDP.

This does not translate directly into a 1% boost to global growth because the windfall to consumers is a cost
to producers. But it can have a sizable effect in the short term. Producers are unlikely to make major cuts to
their expenditures in the short term, while consumers have consistently proven to spend most of what they
save at the pump. Historically, moves in oil have tracked closely with economic-surprise indexes and may
point to some upside surprises in coming months that could help to lift stocks globally as 2015 gets off to
a solid start.

Policy is a key theme for 2015
The potential boost to global growth from lower oil prices may act like fiscal stimulus in a way that is similar to
a tax cut. Fiscal policy may be more important than monetary policy in 2015. Monetary policy may not change
all that much from 2014. The Fed and Bank of England may raise rates in 2015, but central banks in Europe,
China and Japan are ramping up stimulus for the year ahead. They are not alone.

Schwab 2015 Market Outlook                                                                                  Page 1
Global Markets

In the past month, central banks in South Korea, Sweden, Vietnam, Iceland and Romania all have cut
interest rates. While monetary policy garners a lot of attention, it is likely to remain broadly stimulative. More
interesting for investors may be the change in fiscal policy next year.

  • In light of the surprisingly weak Q3 GDP, Japan is set to delay the planned 2015 consumption-tax increase.
		 Elsewhere in Asia, China continues to provide targeted fiscal stimulus programs, including the most recent
		 announcement of new rail projects that are intended to keep the economy from slowing more sharply.
  • In Europe, the fight over the French and Italian budgets is pretty much over, with the EU not requiring the
		 nations to hit previously agreed upon budget targets for 2015 through significant tax increases and
		 spending cuts. In addition, Europe will likely approve and begin to implement some version of President
		 Juncker’s plan to provide 300 billion euros in spending initiatives.
  • Even here in the United States, Federal outlays have increased for five months, after being flat for five
		 years, and were up 5.5% year-over-year in October.

Globally, we are starting to see a shift from fiscal drag to fiscal stimulus in what is still going to be a very
stimulative monetary-policy environment. These policies are likely to continue to push asset prices higher
around the world in 2015 despite still-sluggish global growth.

Why are emerging market stocks attractive now?
Here are three key points on why now is the time for emerging market stocks:

  • Emerging market stocks — recent performance laggards — may be at a turning point
		 due to attractive valuations.
  • Despite the risks presented by the slowdown in Europe and geopolitical spillovers,
		 emerging market economies may benefit from an improvement in global growth.
  • If growth continues to be sluggish, low valuations on emerging market stocks and correspondingly
		 low expectations may limit their downside.

Valuations on emerging market stocks are relatively inexpensive when compared with stocks in the United
States and other developed markets. Emerging market stocks — as measured by the MSCI Emerging
Markets Index — are trading at a price-to-earnings (P/E) ratio of only about 10. In comparison, U.S. stocks —
as measured by the Standard & Poor’s 500-stock index — traded at a P/E of more than 15. Other developed
market stocks as represented by the MSCI EAFE Index (excluding Japan) had a P/E of about 14. The relatively
low valuation implies that investors have already priced in a pessimistic outlook for emerging market stocks,
making them better positioned than stocks of developed international markets.

Schwab 2015 Market Outlook                                                                                     Page 2

Global Markets

Also, emerging market stocks may benefit from an improvement in global growth.
                                                                                        Key Points:
Global exports appear ready to accelerate from the recent quarterly pace of about
1%. Emerging market stocks historically have outperformed their developed-              • Emerging market
country counterparts when global exports improve. Over the past 10 years, when            stocks can perform
global exports grew faster than 2.5% in a quarter, returns from emerging market           well even amid a
stocks were almost double than those of international developed country stocks.           rising dollar.

We may have reached a turning point for EM stocks. In 2014, we’ve seen solid          • Rarely have emerging
stock market gains from even the most economically challenged emerging market           market stocks been
countries. Stock markets in Venezuela, South Africa and Turkey have produced            much less expensive
positive total returns year-to-date through November 25, 2014. That’s despite           on a relative basis.
issues like a sky-high “misery index” – the sum of a country’s inflation rate and its
unemployment rate. After years of underperformance, EM stock markets appear
to have started to climb a “wall of worry” despite negative events, with the MSCI
Emerging Markets Index up 13% from this year’s February 5 low, as of November 25.

How can emerging market stocks perform well even amid a strong dollar?
Emerging market stocks often are considered at risk when the dollar rises and commodity prices fall. A strong
dollar, weak commodity prices and solid emerging market stock performance, however, can coexist in the
environment we foresee for a few key reasons:

  • There are now far more commodity consumers than producers among emerging market stocks. The
		 emerging market sector mix has changed over time. Nearly 50% of the value of the companies in the MSCI
		 Emerging Market Index is now in the financials and technology sectors. The materials sector, the largest
		 sector 20 years ago, now accounts for less than 10% of the emerging market universe and even combined
		 with the energy sector accounts for less than 20% of the index’s value. By and large, emerging market
		 companies are not the commodity producers they are often believed to be—or were in the past.
  • The China-driven commodity boom that coincided with strong emerging market performance is ending.
		 From the late 1990s through the late 2000s, the close relationship between commodities and emerging
		 market stocks was tied to China and its massive scale and rapid pace of construction activity. China
		 became the importer of nearly half of the world’s supply of copper and other materials. This period, often
		 referred to as the commodity super-cycle, is now ending as China refocuses its growth. The
		 transformation of where growth is coming from in China has been dramatic. Resource-heavy State Owned
		 Enterprises now represent only about 25% of China’s GDP. Resource-light companies, including some
		 world-class e-commerce firms, are thriving and becoming decoupled from state control as they go global
		 in raising capital. A testament to the decoupling of Chinese stock market performance from commodity
		 prices is the fact that over the past three years ending November 25, 2014, commodity prices, measured
		 by the Commodity Research Bureau index, are flat to down while the Hang Seng Index of Chinese stocks
		 is up about 50% on a total return basis. So while the commodity super-cycle may be ending,
		 emerging market stocks have moved on.
  • Lessons have been learned and put into practice since the dollar-driven disasters of the 1990s. Emerging
		 market countries have made structural changes. Smaller trade and budget deficits, larger foreign currency
		 reserves, debt denominated in local currencies, and flexible exchange rates are leaving these countries
		 much less vulnerable to an extended rise in the dollar than they were in the past.

The effect of a rising dollar on any nondollar investment can act as a drag. But low valuation accounts for
much of the risk and leaves plenty of room for solid performance.

Schwab 2015 Market Outlook                                                                                Page 3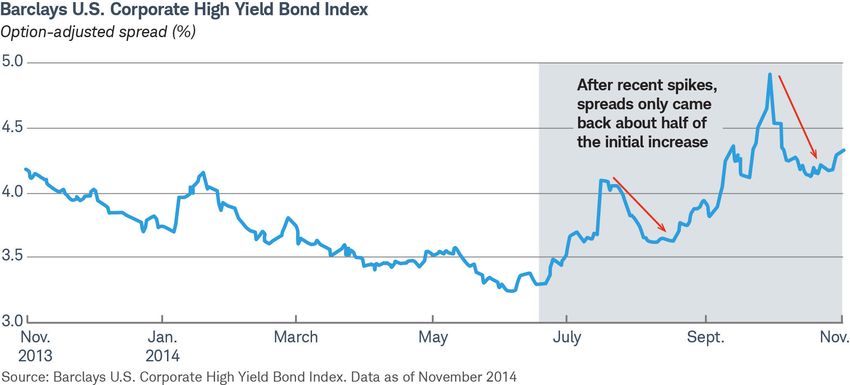
U.S. Equities
2015 U.S. Stock Market and Economic Outlook
Our view, which we have held since the market bottomed in 2009, is that the current bull
market is secular, not cyclical. Secular bull markets—like from 1949 to 1968 and 1982 to
2000—are extended bull markets characterized by above-average annualized returns and
generally less-dramatic downside risk.
This does not mean this market is immune to corrections, but it shares characteristics
of past secular bull markets. For one, the Standard & Poor’s 500-stock index has posted
Liz Ann Sonders an annualized return of 22% in the first four years of this bull market. This closely mirrors
Chief Investment the first four years of prior secular bull markets, which had similar annualized S&P 500
Strategist returns. Economic characteristics of past secular bull markets at their outset include
secular valuation lows, secular unemployment rate highs and negative real interest rates.
All three characteristics also were in place at the beginning of the current bull market.
Since we put the bull market in an economic context, we will share a high-level outlook for the U.S. economy.
Unique in this recovery is the large spread between the average quarterly real growth of gross domestic
product (GDP), which has been a relatively paltry 2.3%, and that for the private sector, which has been a
healthier 3.2%. We believe this spread is set to narrow, with the overall growth rate catching up to the private
sector’s growth rate, due to waning fiscal drag.
Consumer spending is picking up
The “deleveraging” period since 2008, when consumers were focused on paying off debt, is largely over. This
is why consumer spending has been recovering. It is not likely to reach prior lofty levels due to the lingering
memory of the debt crisis and a general increase in frugality. But with consumer free cash flow on the rise,
due in part to lower energy prices, consumer spending (accounting for 68% of U.S. GDP) should remain
relatively healthy and could even accelerate more than income growth.
In addition, the economic expansion appears to be in a phase of higher capital expenditures, or capex.
Investment-led expansions tend to last longer than those that are led by consumer spending. Since the
mid-2000s, corporate cash has tended to be used for stock buybacks and dividend payments rather than
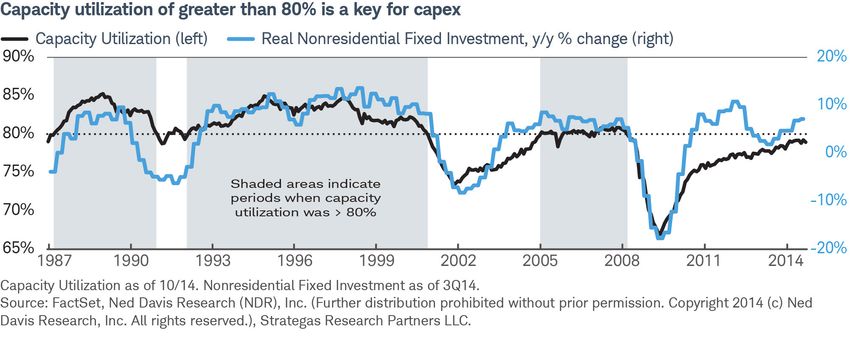
capital expenditures. But the tide appears to be turning toward a greater focus on capex. Capacity utilization,
a capex leading indicator, is nearing the critical 80% level, which has historically meant demand is sufficiently
high to warrant the expansion of capital investments. And, prior underinvestment in fixed assets and the old
age of those assets also suggest a sustained expansion in capex.
Schwab 2015 Market Outlook Page 4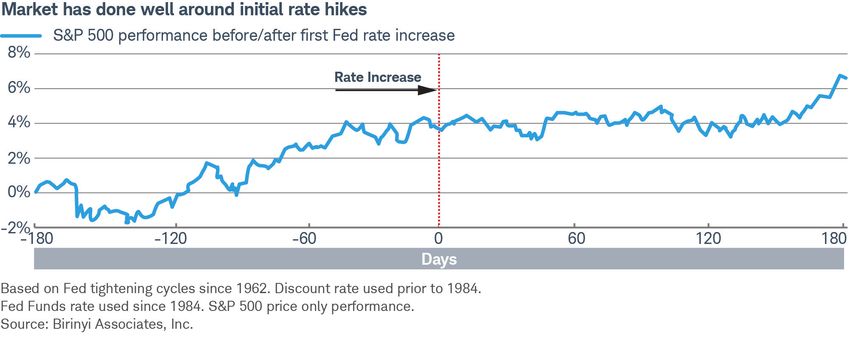
U.S. Equities
But every bull market—secular or cyclical—has stages and we are likely in a more mature phase.
What is remarkable about this bull market is that euphoria hasn’t set in, even after a 240% appreciation
in stock prices since March 2009. Investors remain skeptical of this bull market.

Earnings growth is outpacing rise in valuations
We can also look at the market’s underlying fundamentals. S&P earnings have tripled since March of 2009,
while the stock market is up a lesser 240%. On both a trailing and forward basis, the market is about at
historic median P/Es while most of the macro conditions supporting higher valuations remain in place. These
include a “not-too-hot, not-too-cold” economic environment of trend growth and subdued inflation and the
stronger dollar. In addition, the market’s best performance historically has come when earnings growth is
positive, but not too hot.

Many have argued that multiples have risen “artificially,” meaning they have been pushed up by risk-seeking
investors and record-low interest rates. Interestingly, though, multiple expansion in this bull market has been
about average for bull markets since 1957. So why have stock market returns been so high? Earnings.
Earnings growth in the current bull market has been 20% above the average level of growth for all bull
markets since 1957.

What could spark volatility?
Investor sentiment is a shorter-term factor that will likely drive the market’s ups and downs in 2015. Much
like when attitudinal measures of investor sentiment indicated high levels of optimism and complacency in
September, the market is vulnerable to negative catalysts when sentiment is optimistic.

One catalyst in 2015 could be interest-rate uncertainty as the Fed moves toward an initial rate increase. The
onset of Fed tightening cycles has not upended bull markets historically—quite the contrary—but it does often
usher in bouts of volatility and pullbacks. Case in point would be the two most recent tightening cycles during
the mid-1990s and mid-2000s. The stock market performed admirably, but with five corrections (or pullbacks)
during each cycle. The corrections averaged -12% in the mid-1990s cycle, while the average pullback was
-7% in the mid-2000s cycle.

Consider every initial rate increase since the early 1960s and the stock market’s behavior in the six months
before and after that increase. The market’s weakest period tends to occur several months in advance of the
initial increase but the trajectory of the market’s performance is largely higher over the full year.

Schwab 2015 Market Outlook                                                                                 Page 5

U.S. Equities

How do falling oil prices affect                                                       Key Points:
the U.S. economy and stock market?
                                                                                       • A stronger dollar
Consumer spending represents 68% of the U.S. economy. Oil and gas capex                  means lower
represents about 1% of U.S. GDP and less than 9% of U.S. total capex (which in           commodity
turn represents about 12% of U.S. GDP). Therefore, the benefit of lower energy           prices, which is good
prices to the consumer and many businesses greatly outweighs the significant hit         for consumption-
to energy companies and/or energy-oriented capex, especially in energy-oriented          oriented economies
states.                                                                                  like ours.
U.S. domestic capex has grown by more than $600 billion over the past four             • Lower energy
years, with $100 billion of that being energy-oriented. One can argue that much          prices put downward
of non-energy capex would benefit from reduced operating costs courtesy of               pressure on overall
lower energy prices.                                                                     inflation.
Lower energy prices also hold down overall inflation, which is a plus for both the
U.S. economy and stock market. Lower inflation has historically meant higher equity valuations. In fact, there
is a direct inverse correlation between the energy sector’s weight in the S&P 500: a lower weight, typically as
a result of lower energy prices, has led to higher overall S&P 500 P/E ratios, and vice versa.

Is a strong dollar good for the U.S. stock market and economy?
The conditions supporting the U.S. dollar resemble those that drove the dollar bull market of the 1990s, most
of which also had a positive effect on the stock market; i.e., stocks and the dollar were positively correlated.
The correlation between the dollar and stocks recently moved back into positive territory and we think it will
likely remain there.

This is in contrast to the dollar bull market in the early 1980s when runaway inflation and double-digit interest
rates drove the dollar higher—not positive conditions for the stock market. During the 2008 financial crisis,
a higher dollar was the result of its safe-haven status amid a crumbling global financial system—also not a
positive condition for the stock market. During these phases of dollar strength, the stock market was inversely
correlated to the moves in the dollar.

As far as economic impact, while a stronger dollar makes exported goods more expensive, exports represent
only 13% of U.S. GDP, compared with 68% for consumer spending. Since many commodities —
notably oil—are priced in dollars, a stronger dollar means lower commodity prices, which is good for
consumption-oriented economies of countries like the United States.

Could too much dollar strength be a bad thing? The answer probably rests with the bond market.
The negative implications—the tightening effect—of a stronger dollar can be offset by a decline in longer-term
interest rates. So far this year, the U.S. Dollar Index (DXY) has appreciated by about 10%, while the 10-year
Treasury yield has fallen by about 70 basis points. As such, the bond market is at least partly doing its job
as an offset to the negative implications of a stronger dollar.

Schwab 2015 Market Outlook                                                                                Page 6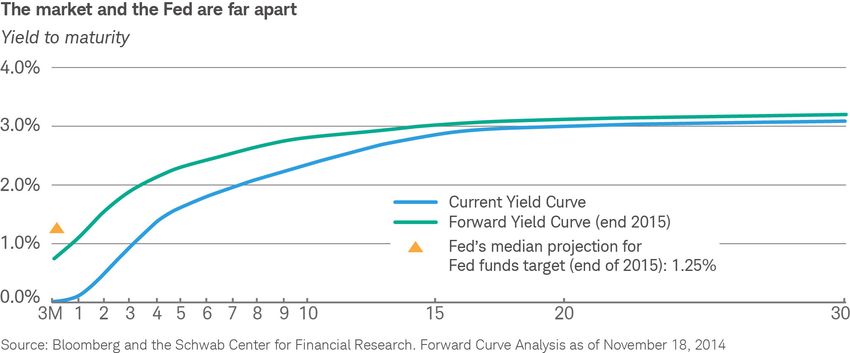
Fixed Income
                     2015 Fixed Income Outlook
                     In 2015, we expect moderately higher interest rates, a stronger dollar, a flatter yield curve
                     and heightened volatility.

                     Interest rates
                     The focus of attention in the fixed income markets is likely to be on the Federal Reserve’s
                     move toward tighter monetary policy, which we think will have significant effects on the
                     markets, but not perhaps in the way most people think. It’s not just about interest rates –
Kathy Jones
                     but more about volatility and valuation.
Fixed Income
Strategist            The Fed has already exited quantitative easing (QE) and assuming the economy continues
                      to perform reasonably well, as we expect, then a rate hike seems likely midyear. But we
                      think that the rate of Fed tightening will be slower than the Fed has indicated and more
in line with the trend implied by the forward market. While we believe the domestic economy will continue
to improve, there are strong disinflationary pressures coming from Europe and Asia, which could hold down
inflation and bond yields. Additionally, we expect the dollar to continue to rise as the Fed shifts policy.

It is not clear that QE has been solely responsible for the drop in interest rates. We think falling inflation and
inflation expectations have been a big contributor. In fact, the evidence suggests that during periods of QE,
long-term rates have risen along with inflation expectations. When periods of QE have ended, rates and
inflation expectations have generally trended lower. Therefore, the absence of QE doesn’t necessarily mean
rates will rise by much unless there is stronger growth and/or an increase in inflation expectations. So our
rate expectations would be for a moderate rise from current levels.

Stronger dollar
A stronger dollar is likely to hold down inflation and long-term interest rates as well. With the U.S. economy
likely to outperform the economies of other developed countries, especially Europe and Japan, we’re
expecting the dollar to continue to advance. It’s up about 8% on a trade-weighted basis since last summer
and the diverging trends in growth and monetary policy between the United States and other major countries
should mean the dollar gets stronger.

Schwab 2015 Market Outlook                                                                                   Page 7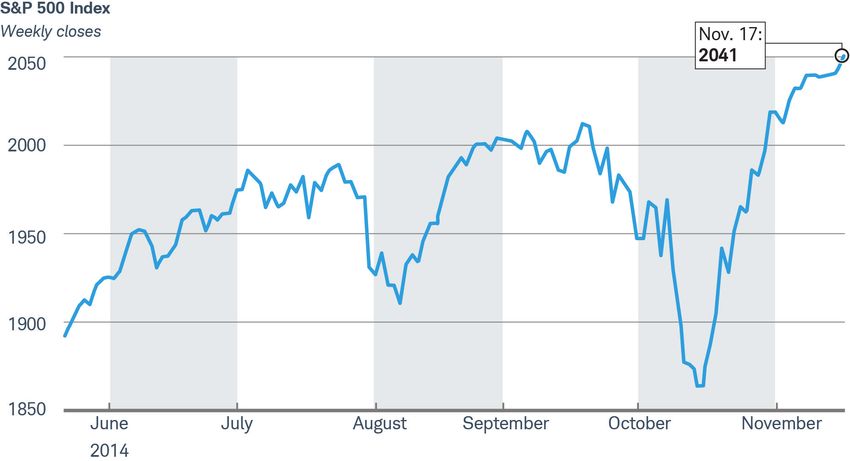
Fixed Income
Higher relative interest rates make the dollar more attractive to hold. For example, two-year note yields in
Germany and Japan are near zero or even negative, so even at current rates there is a positive cost of carry
in holding dollars versus euros or yen. With the prospect of easier monetary policies in Europe and Asia, that
spread is likely to widen even further. The upshot is that as long as U.S. growth remains on track and the Fed
is still shifting away from the loose monetary policy of the past six years, the dollar should continue to rise and
that should keep inflation and interest rates in check.

Yield curve
Our expectation is that as the Fed raises rates, the major trend will be a flatter yield curve, particularly if
inflation remains below the 2% target level. The yield curve has already flattened quite a bit from the 5-year to
30-year maturities. With rate hikes, the front end of the curve – from 3-month bills to 5-year notes – should
flatten. The market has already priced in a lot of the increase in rates. A flatter yield curve would be consistent
with the pattern of the 2004 cycle, which was signaled in advance and unlike the early response to the 1994
tightening cycle, which was not.

Volatility
While the Fed’s impact on long-term interest rates can be debated (and will be) it does seem clear that the
Fed’s various programs have suppressed volatility in the fixed income markets. Between the zero interest rate
policy and the Fed’s messaging, volatility has been quite low by historical standards. The Merrill Lynch index
of bond market volatility – the MOVE index – shows that current volatility readings of about 65 to 70 are well
below the long-term average of 100-110. We don’t expect a spike on the magnitude of the 2008-09 time
period, but we do think it is likely to rise from here.

Without the strong Fed backstop, we think investors will demand more risk premium to hold bonds, causing
volatility to rise. Therefore, we expect some widening of credit spreads – more in high yield than in investment
grade. Between rising volatility, a stronger dollar and tighter Fed policy, the riskier sectors of the markets –
high yield, bank loans and emerging market bonds – may underperform as investors demand higher yields
to offset these risks. Some spread widening has already occurred and we would expect that to continue.

Schwab 2015 Market Outlook                                                                                  Page 8
Fixed Income
What should investors do if liquidity                                                    Key Points:
is a concern in the bond market?
                                                                                         • We expect further
We are concerned about liquidity in the bond market. With banks and dealers                widening in credit
cutting back on the inventory of bonds they hold, there are fewer market makers            spreads, which
now than there were a few years ago before the financial crisis. Consequently,             makes the risk/
when the markets get volatile, there are more price gaps – there is just no one            reward in high yield
there to provide a reasonable price. We’re also concerned that vehicles like funds         bonds unattractive.
and ETFs, which are liquid structures, may give the impression that the underly-
ing markets are more liquid than they really are and investors may not realize it.       • Investors need to
                                                                                           understand the risks
Our advice to clients is to make sure that they understand liquidity risk.                 that declining
Investors should not keep funds that they need available in the near term in               liquidity in the fixed
investments that may not be that liquid. Secondly, when investing in individual            income markets pose
bonds, it may make sense to invest in larger issues which are going to have more           for their investments.
liquidity. Finally, we think they should go over their portfolios with a bond special-
ist or their financial consultant and understand the liquidity risk.
If they are buy-and-hold investors, it may not matter to them, but for many
it probably will make a difference.

Why are you critical of junk bonds?
We have thought since last summer that the risk/reward in high yield just wasn’t that attractive. The yields
are low – last summer yields dropped to record lows on the Barclays U.S. Corporate High Yield Bond Index
– and credit quality was deteriorating. There are far more “covenant lite” bonds now, increasing leverage and
fewer protections for investors. An additional factor recently has been the drop in oil prices. About 15% of the
Barclays U.S. Corporate High Yield Bond Index is now comprised of energy companies. That compares to just
7% a few years ago. With oil prices dropping, it’s likely to put a strain on some of those companies that are
highly leveraged and it may mean higher defaults or at a minimum more stress in the sector. That warrants
a higher risk premium than exists in the market. Over the past few years, a lot of money has moved
into the high yield market – into both bank loans and traditional high yield bonds – as yields have dropped.
The trend is beginning to reverse. If the outflows continue or pick up, it could cause a drop in prices.

Schwab 2015 Market Outlook                                                                                Page 9
Trading & Derivatives
2015 Trader Outlook
As discussed earlier in this 2015 outlook, there are a number of more positive
economic indicators for investors to consider. The four-week moving average for weekly
jobless claims, for example, remains near a 14½ year low. Other employment relat-
ed data, such as the monthly unemployment rate, the labor-participation rate and the
labor-turnover rate, all indicate continued improvement in the labor markets. Retail sales
posted a solid advance in October.
Randy Frederick We believe this trend will continue, resulting in a very strong holiday shopping season.
Managing Consumer sentiment has also reached a seven-year high. When consumers feel good and
Director, Trading lower gasoline prices are leaving money in their pockets, they are likely to go shopping.
and Derivatives
Technically, the Standard & Poor’s 500-stock index (SPX) remains on solid ground, at or
near record highs. While many market watchers were quick to call the September 18,
2014, reading of 2011.36 as the year high, the SPX has blown solidly past that level. The rebound from the
Ebola-induced scare has been astounding. The SPX has gained more than 9.5% in only 19 trading days.
Keeping an eye on put/call ratios
There has been a lot of discussion recently regarding put/call ratios. The SPX OIPCR (open interest put/call
ratio) shows that the total number of outstanding puts on the SPX now outnumber the total outstanding calls
by a margin of less than 2 to 1. This is the lowest level since mid-June and indicates that SPX option
traders generally perceive that the SPX has more upside ahead. This ratio and the index often move in the
same direction, but that has not been the case for the past 3 weeks. The ratio is very close to a six-month
low. The last two times the ratio was this low, the SPX remained in an uptrend for several weeks.
The VIX OIPCR (open interest put/call ratio) indicates that the total number of outstanding call contracts just
barely outnumbers the total outstanding puts by a margin of more than 2 to 1. While this might sound high,
it is important to note that calls outnumbered puts by a ratio of more than 4 to 1 before the October
volatility spike. This is not only down sharply from the 12-month high of .53 on 10/23/14, we believe it illus-
trates that many traders see little risk of another sharp spike in the VIX in the near term. To further emphasize
this point, the last time the VIX was at its current levels (before the October spike) this ratio was at .25. So
while we are at the same level VIX, we are at a much lower put/call ratio.
While we are somewhat surprised by how quickly the VIX has dropped since the Ebola-induced increase,
it does help to illustrate how that sharp rise was likely an irrational panic. Irrational panics not only are
typically short-lived, they often represent excellent entry points for traders looking to buy on dips. While there
are other put/call ratios, these two have some of the most reliable track records, and both are clearly bullish
in the near term.
With very low expectations for the lame duck session in Congress and no real threat of higher interest rates
until at least March or April of 2015, the United States should be able to remain decoupled from the problems
in Europe and continue to be the investing location of choice for at least the next few months. That doesn’t
mean there won’t be another small pullback or two before the end of the year, but traders should view them
as buying opportunities.
Schwab 2015 Market Outlook Page 10Trading & Derivatives
What are some market factors to watch for in the short term? Key Points:
Since we are in a mature phase of this bull market, the consumer discretionary
• Irrational panics often
sector, which gained 30% in 2013, may not be a great long-term investment.
represent excellent
But with low gasoline prices, consumer sentiment at a seven-year high and a fair
entry points for
amount of pent-up demand, we believe short-term gains in consumer
traders looking to
discretionary stocks may continue over the holiday season. With the two big
buy on dips.
catalysts behind us – the end of the Fed’s tapering process and the midterm
elections – the seasonally strong period from November through January looks • Rising volatility can
like it may provide opportunities this year. be beneficial if you
know how to use it
In 20 of the past 28 years when December finished higher, the subsequent to your advantage.
January also finished higher. A notable exception, however, was that this did not
happen in December 2013/January 2014, so as with any other statistical pattern,
it is not completely reliable.
It is also worth noting that as we are approaching the end of the sixth year of this bull market, the historical
averages suggest a total gain in the range of 15% to 20% for the 12-month period ending in mid-March 2015.
That is about double the current gain of 8.6% since mid-March 2014. A move of this magnitude would put the
S&P 500 in the range of 2160 to 2250.
On The Rise
The S&P 500 Index is up 9.5% over the past month.
Schwab 2015 Market Outlook Page 11Important Disclosures not suitable for all investors. Commodity- the overall market performance in Hong
Past performance is no guarantee of related products may be extremely Kong. These 48 constituent companies
future results. Forecasts contained volatile, illiquid and can be significantly represent about 60% of capitalization of
herein are for illustrative purposes, may affected by underlying commodity prices, the Hong Kong Stock Exchange.
be based upon proprietary research and world events, import controls, worldwide
The Merrill Lynch Index of Bond Market
are developed through analysis of competition, government regulations, and
Volatility (MOVE) index is a yield curve
historical public data. economic conditions, regardless of the
weighted index of the normalized implied
length of time shares are held.
The information here is for general volatility on 1-month Treasury options.
Investments in commodity-related
informational purposes only and should products may subject the fund to Barclays U.S. Corporate High-Yield Bond
not be considered an individualized significantly greater volatility than Index covers the USD-denominated,
recommendation or personalized investments in traditional securities and non-investment grade, fixed-rate, taxable
investment advice. The type of securities involve substantial risks, including risk of corporate bond market. Securities are
and investment strategies mentioned may loss of a significant portion of their classified as high-yield if the middle
not be suitable for everyone. Each principal value. rating of Moody’s, Fitch, and S&P is Ba1/
investor needs to review a security BB+/BB+ or below.
International investments involve
transaction for his or her own particular additional risks, which include differences Chicago Board Options Exchange Market
situation. Data here is obtained from in financial accounting standards, Volatility Index (VIX) a popular measure
what are considered reliable sources; currency fluctuations, geopolitical risk, of the implied volatility of S&P 500 index
however, its accuracy, completeness, or foreign taxes and regulations, and the options. Often referred to as the fear
reliability cannot be guaranteed. potential for illiquid markets. Investing in index or the fear gauge, it represents one
All expressions of opinion are subject to emerging markets may accentuate these measure of the market’s expectation of
change without notice in reaction to risks. stock market volatility over the next 30
shifting market, economic or geopolitical day period.
conditions. Index definitions
Options carry a high level of risk and are MSCI Emerging Markets Index is a free Trade Weighted U.S. Dollar Index: Other
not suitable for all investors. Certain float-adjusted market capitalization index Important Trading Partners is a an
requirements must be met to trade that is designed to measure equity market average of the exchange rates of a
options through Schwab. Please read the performance in the global emerging country’s currency with the currencies of
Options Disclosure Document titled markets. This index is a float-adjusted its most important trading partners,
“Characteristics and Risks of market capitalization index that consists weighted to reflect each trading partners’
Standardized Options” before considering of indices in 21 emerging economies: importance to the country’s trade. A
any option transaction. Call Schwab at Brazil, Chile, China, Colombia, Czech currency’s trade weighted index is also
1-800-435-4000 for a current copy. Republic, Egypt, Hungary, India, known as its effective exchange rate. The
Supporting documentation for any claims Indonesia, Korea, Malaysia, Mexico, currencies in the U.S. dollar index are the
or statistical information is available upon Morocco, Peru, Philippines, Poland, euro, the yen, sterling, the Canadian
request . Russia, South Africa, Taiwan, Thailand, dollar, the Swedish crown and the Swiss
and Turkey. franc. It was launched in 1973 with a
Indices are unmanaged; do not incur value of 100.00.
management fees, costs, or expenses; CRB (Commodity Research Bureau)
and cannot be invested in directly. Continuous Commodity Index is a Barclays Emerging Markets USD Index
commodity index based on the futures includes USD-denominated debt from
Fixed income securities are subject to
prices of various commodities. emerging markets in the following
increased loss of principal during periods
regions: Americas, Europe, Middle East,
of rising interest rates. Fixed-income S&P 500® Index is a market- Africa, and Asia. As with other fixed
investments are subject to various other capitalization weighted index that income benchmarks provided by
risks including changes in credit quality, consists of 500 widely traded stocks Barclays, the index is rules-based,
market valuations, liquidity, prepayments, chosen for market size, liquidity, and
early redemption, corporate events, tax allowing for an unbiased view of the
industry group representation. marketplace and easy replicability.
ramifications and other factors.
Hang Seng Index is a free float-adjusted Barclays International: Sovereign Index is
Investments in currency involve additional a sub-index.
market capitalization-weighted stock
special risks, such as credit risk and
market index in Hong Kong. It is used to U.S. Dollar Index (DXY) is an index (or
interest rate fluctuations,
record and monitor daily changes of the measure) of the value of the United
Commodity-related products, including largest companies of the Hong Kong States dollar relative to a basket of
futures, carry a high level of risk and are stock market and is the main indicator of foreign currencies.
The Schwab Center for Financial Research is a division of Charles Schwab & Co., Inc.
©2014 Charles Schwab & Co., Inc. All rights reserved. Member SIPC.
Compliance number for this project is 1214-8150Contacts
Please reach out to the contacts below if you would like additional information or to
schedule an interview with an expert from the Schwab Center for Financial Research.
Schwab Public Relations
Michael Cianfrocca
michael.cianfrocca@schwab.com
415-667-0344
Erin Montgomery
erin.montgomery@schwab.com
212-403-9271
Alissa Carter
alissa.carter@schwab.com
212-403-9240
Hibah Yousuf
hibah.yousuf@schwab.com
415-667-0507
LoremSchwab 2015sit
ipsum dolor Market
amet,Outlook
consectetuer Page 00You can also read