Directions A QUARTERLY PUBLICATION OF CLS WINTER 2020 - CLS Investments
←
→
Page content transcription
If your browser does not render page correctly, please read the page content below

Directions A QUARTERLY PUBLICATION OF CLS WINTER 2020

Market Review
As another quarter and year enter into the history books, the market is in a far stronger
position than it was a year ago. In the fourth quarter of 2019, the theme seemed to be
“clarity” as several market headwinds became tailwinds. Brexit uncertainty was lifted as
Boris Johnson’s Conservatives secured enough seats to push through Britain’s departure
from the European Union by the end of January. A “phase one” deal between the U.S. and
China brought trade relationships into clearer focus, and the U.S. Federal Reserve (Fed)
signaled it will stay out of the market’s way in 2020. The clarity on all points led to a strong
fourth quarter and a nice setup for 2020.

As market sentiment ticked higher, yields rose as well, after bottoming in the third quarter.

The fourth quarter saw a weaker U.S. dollar. The dollar’s strength is a key indicator
when seeking out diversifying asset classes, such as commodities and emerging
market stocks. A weaker dollar typically pushes those assets higher.

The news continued to generate sensational headlines during the fourth quarter, and as one
particularly consequential news item develops in 2020, investors may be wondering what a
presidential impeachment could mean for the stock market. Our answer: The stock market
does not particularly care who is president. Markets are getting more global by the minute,
and they are primarily driven by fundamentals of corporate earnings and valuations in the
long term, which is what we at CLS care most about. However, in the short term, markets can
be driven by sentiment, and as the impeachment process moves through the U.S. Senate, it                              MARC PFEFFER
may weigh heavily on investors. Except, it hasn’t so far. Markets consistently marched higher                         Chief Investment
                                                                                                                      Officer
in the fourth quarter. Also, during the impeachment trial of President Clinton, the stock
market moved higher, and it moved lower before President Nixon’s resignation as he faced
almost certain impeachment. We believe it’s likely that the markets were influenced more
by other factors than the political news. We urge our investors to keep politics and investing
completely separate.
                                                                                                   Marc Pfeffer serves as CLS’s Chief
Now, let’s review the numbers for the quarter:                                                     Investment Officer. In his role, Marc is
                                                                                                   responsible for leading CLS’s Portfolio
Overall, most major asset classes moved higher in the 4th quarter, with only REITs posting a       Management Team and overseeing all
negative return. Emerging market stocks led the rise, gaining close to 12%, and global stocks      investment operations at CLS, including
were up over 9%. The Santa Claus rally was on full display to close out the decade.                investment       philosophy,     process,
                                                                                                   positioning, and performance.
Bonds were about flat for the quarter as treasury yields rose across the spectrum and the
yield curve ended at the steepest spread in over a year. Note that even though yields rose,        Connect with Marc on LinkedIn.
affecting bond prices, they still had a positive return due to the yield they produce.

Diversified commodities also saw gains of more than 4% for the period ending 12/31/19.

The outlook for the economy remains bright as recession fears appear to have waned,
market participant sentiment is climbing into year-end as short-term optimism is
approaching excessive levels. We maintain a positive outlook, but a short-term pullback
would not be a surprise.

                                                                                                              2
You May Be Taking More Portfolio
Risk Than You Think
Risk can be defined in different ways, but the ultimate risk is not meeting one’s investment
objectives. The biggest reason investors do not meet their goals is an inability to stick with an
appropriate investment plan.

There are two primary reasons investors get off course. One is that an investment portfolio                   From Rusty Vanneman,
                                                                                                              Chief Investment Officer,
didn’t behave as expected. The second is that an investor’s return expectations were unduly
                                                                                                              Orion Advisor Solutions
influenced by recent performance. Let’s discuss both.

Investments Not Performing as Expected
Risk Scoring of Investors
In the investment profession, investor risk tolerance (the financial and emotional capacity to
take stock market risk) is typically profiled with risk scores from zero to 100. If an investor
scores a zero, they are very conservative and probably shouldn’t be investing! If an investor
scores a 100, they are very aggressive, suggesting they have a long-term investment horizon
and are very knowledgeable and comfortable with stock market risk. The 100-score investor’s
portfolio would then assume 100% (or more) total market risk, and a zero-score investor’s
portfolio would assume zero stock market risk.

(“Total market risk” should be defined by the global stock market, which is the broader
investment opportunity set, not a subset of the global market, such as U.S. large-cap stocks
listed on the S&P 500.)

To drive the point home: If an investor scores a 100, they would be comfortable with 100%
market risk. If they score an 80, they would be comfortable with 80% market risk; with a score
of 50, they’d be comfortable with 50% market risk, and so on.

For an investor’s expectations to be met, they need an investment portfolio with a risk level that
matches their risk score.

Risk Scoring of Investments
Investments, meanwhile, have a wider range of risk scores and will often score outside the zero
to 100 range. An easy way to understand this is if the “total market risk” is defined by the entire
global stock market, then it’s obvious that some stocks are riskier than the overall index and
others are less risky.

It’s rare that two total equity portfolios have identical risk. For example, one all-equity portfolio could
comprise all volatile, small-cap technology stocks, while another all-equity portfolio could be entirely
invested in stable, large-cap consumer staples stocks. These portfolios might both be all-equity, but
their risk scores will differ significantly from the overall market.

Yet another example is an investment portfolio that may be leveraged, perhaps taking three
times the risk of the market. Obviously, its risk score should not be 100; it should be closer to
300, depending on what it’s leveraging.

                                                                                                                  3
Risk Changes All the Time
Another crucial consideration for investors when building investment portfolios is the fact that
investment risk scores change over time. In fact, they can change a lot over relatively short
periods of time, and that can make a big difference to how portfolios behave. Risk-scoring
methodologies should reflect that, ideally being updated as frequently as possible.

The table below is an example of why more frequent risk scoring is important. When we review
the global market and break down standard investment risk statistics over the last one- and 10-
year periods, we see significant changes.

This may surprise many investors, but non-U.S. stocks have been less risky/volatile than U.S.
stocks over the last year. For instance, the one-year beta, which is a measure of relative risk, for
non-U.S. stocks, is only 0.76. That means non-U.S. stocks have had a bit less than 80% of the
risk of the global equity market over the last year. Over the last 10 years, however, international
stocks were more volatile, with a beta of 1.08.

U.S. stocks, meanwhile, have had 118% of the risk, while the 10-year average beta has been a bit
less than 1.00. (The total U.S. stock market is defined by the total market Russell 3000. Note that the
S&P 500 excludes small-capitalization companies and most mid-cap stocks, too.)

 BENCHMARK                        TICKER             1-YR. BETA        10-YR. BETA
 Global (60% US, 40% Non-US)      TSM                1.00              1.00

 Vanguard S&P 500 ETF             VOO                1.16              0.93

 iShares Russell 3000 ETF         IWV                1.18              0.96

 iShares MSCI ACWI ex US ETF      ACWX               0.76              1.08

Source: CLS Risk Budget Scores

Why have these risk characteristics changed? The biggest reason is price volatility has sharply
risen for U.S. stocks relative to non-U.S. stocks, at least for the indices that represent them. That
is clearly different from historical market behavior. Investment portfolios should be managed
accordingly, given this information, to match investor expectations.

Wrong Benchmarks
Another reason portfolios don’t behave as expected is investors may be matching them against
the wrong benchmark. This is a common problem in the investment industry. An investment’s
return and risk expectations need to be based on the typical asset classes the portfolio invests
in. For instance, if a portfolio is balanced with a blend of assets classes, then simply matching it
against an index of U.S. large-cap stocks, such as the S&P 500, doesn’t make practical sense.

If portfolios of different asset classes are being judged together, then a risk-based benchmark
is a preferred way to understand risk and measure portfolio performance over time. In other
words, if a portfolio has exhibited 50% of the risk of the global equity market (and assuming no
change in investment philosophy or process), then it should be expected to have approximately
50% of the risk of the global equity market moving forward.

                                                                                                          4
What Causes a Bear Market?
        105 years old, he hung in there, didn’t he?” —Peter Venkman
        “He didn’t die of old age, either. He was poisoned, stabbed, shot,
        hung, stretched, disemboweled, drawn and quartered.” —Ray
        “Ouch.” —Venkman
        -Ghostbusters II (1989)                                                                          Kostya Etus, CFA
                                                                                                         Co-Director of Research &
The chart I’ve included later in this article, familiar to those who have read CLS’s Reference Guide,
shows that markets generally move up slower than they drop, but the “up” periods are longer and          Senior Portfolio Manager
stronger than the “down” periods – more evidence for the benefits of staying invested long-term.
But bear markets do happen; what is often unclear is what causes them. There are many great
quotes that start with “Bull markets don’t die of old age…” but they all end differently:

“…they are killed by higher interest rates.”

“…they get murdered by the Fed.”

“…they die of excess.”

“…they die of exhaustion.”

“…they are killed by recessions.” (Note: you can see in the chart below that a recession is
not a requirement for a bear market.)

“…they die of fright.” This is my favorite one, and the one I think holds the most merit.

Often, this “fright” is caused by an extreme event that may not have much to do with investments,
such as war. I evaluated some interesting bear markets that have occurred post World War II to
get a better idea of what caused them. After all, history is a great teacher.

1946-1947
Geopolitics. As WWII came to an end, industrial production plummeted and investors feared a
second Great Depression.

1961-1962
Geopolitics. A failed Bay of Pigs invasion in Cuba sparked Cold War fears while unions demanded salary
increases, angering President John F. Kennedy and creating fears of an anti-business administration.

1966
Geopolitics. As the Vietnam War was heating up after the U.S. bombing of Hanoi, the Federal
Reserve signaled the economy was overheating, sending interest rates and inflation higher.

1968-1970
Geopolitics. The murder of Martin Luther King, Jr., the murder of President Kennedy, and massive
anti-war demonstrations led to widespread riots, kicked off by the Detroit race riots in 1967.

1973-1974
Geopolitics. An Arab Oil Embargo in 1973 led to price spikes and endless lines at the gas pump. The
Watergate scandal and resignation of President Richard Nixon pushed stocks down even further.

1980-1982
High Rates/Inflation. Paul Volcker became chairman of the Federal Reserve in 1979; he believed
that raising rates to unprecedented heights was the best way to calm soaring inflation. By the end
of 1979, interest rates were at 21.5%, and by 1982, unemployment rose to 10.5%.

                                                                                                            5
1987
High Rates/Inflation. More inflation-related fears sent the 10-year Treasury yield from 7%
at the start of 1987 to more than 10% by October, leading to a flight to safety.

2000-2002
Market Panic. This is about the only bull market that did actually die of investment-related
concerns. Stock prices reached astonishing heights, and some of the highest fliers didn’t
have any actual earnings to speak of. Selling led to more selling led to more selling.

2007-2009
Housing Crisis. In 2006, all you needed to buy a $1 million home was a bright smile and a
fast-talking mortgage broker. By 2008, it was determined that bundles of bad loans were
just as bad as individual bad loans – obscured by the power of financial engineering, that
apparently was not common sense at the time. As mortgage defaults started, they crippled
some of the biggest institutions on Wall Street.

Upon evaluation of these bear markets, what we find is that geopolitics is generally the
culprit and is generally unpredictable. Additionally, high rates, high inflation, and housing
could be a cause, none of which are an issue right now. Our advice, as always, is to stay
balanced, diversified, and invested for the long term to improve the chances of reaching your
financial goals.

S&P 500 Index Bull and Bear Markets
 2.00

 1.50
                                         4.8 Yrs
                                          321%                                                                                                                       5.0 Yrs                                                10.2 Yrs
                                                                                                                                                                      229%          12.3 Yrs                                 307%
                                          35%                                                                                                                                        582%
                                                                                                                                                                       27%                                                   14.7%
                                                                                                                                                                                      17%
 1.00
                             1.7 Yrs                                                7.1 Yrs                                                                                                                  5.0 Yrs
                               78%                              4.1 Yrs             265%                                               2.6 Yrs                                                                100%
                                                                 157%                                   4.1 Yrs    3.6 Yrs 2.1 Yrs                   6.2 Yrs
                              40%                                                    20%                 86%        79%     47%         74%           126%                                                     15%
                                                                 26%                                                                    23%
                                                                                                         16%         17%    20%                        14%
 0.50
         Logarithmic Scale

 0.00

                                                                                              1.2 Yrs                    0.7 Yrs                         1.7 Yrs          0.3 Yrs
                                                                                               -21%                       -21% 1.5 Yrs                    -27%             -34%
                                                                          3.0 Yrs              -18%        0.5 Yrs                                                        N/A%
                                                                           -28%                             -28%          -31%   -36%                     -17%                                  2.5 Yrs
 -0.50                                                                     -10%                            N/A%                  -26%                                                            -49%
                                                                                                                                                                                                 -23%
                                                                                                                                           1.7 Yrs
                                                      5.1 Yrs                                                                               -48%                                                                  1.4 Yrs
                                                      -60%                                                                                  -32%                              DURATION                             -57%
                                                       -16%                                                                                                              % CUMULATIVE RETURN                       -45%
 -1.00                                                                                                                                                                   % ANNUALIZED RETURN
                                         2.7 Yrs
                                          -86%
                                          -52%

 -1.50

 -2.00
                       1928            1933        1938         1943      1948        1953          1958          1963          1968     1973        1978     1983      1988        1993       1998       2003     2008     2013       2018
                                                                                                                         Bull          Bear          Recession

Source: S&P 500 price data is from Morningstar, Recession data is from nber.org, 1/3/1928 – 12/31/2018

                                                                                                                                                                                                                                              6
What if Economists Are Wrong?
There seems to be a consensus out there that a U.S. recession is just around the corner or at least
likely to occur within the next couple of years. That has probably been the prediction for the last
several years, but the length of the current cycle has many assuming it’s bound to come to an end.
It’s true that we are seeing some late-cycle behavior. Yield curve inversions, non-cyclical stocks
outperforming, and the Federal Reserve (Fed) cutting rates all seem to point in that direction. But
with any prediction, you must always think about the risks. What if the consensus doesn’t come
to fruition and the cycle continues? How prepared are investors for that possibility?

The length of economic cycles in the United States has increased as the Fed has become much             From Grant Engelbart, CFA,
more involved in controlling inflation and managing interest rates. Since 1945, economic
                                                                                                        CAIA, Director of Research
expansions in the U.S. have averaged just under five years (58 months). The three previous
                                                                                                        & Senior Portfolio Manager
expansions have averaged nearly eight years (95 months), and we are currently more than 10
years into the current cycle. I think it’s fair to say that expansions don’t die of old age. As the
adage goes, the Fed usually “kills them” by hiking rates. Well, the Fed recently finished cutting
rates in what it called a “mid-cycle adjustment.” Interesting language choice.

Source: Factset

Has any country or region around the world seen expansions last this long? Absolutely. Australia
is currently 28 years into its economic expansion! The pace of growth hasn’t been spectacular, but
it has been stable. Australia’s economy has changed over this expansion, and it really isn’t all that
different from ours. Services make up the majority of the economy, and household consumption
is by far the biggest end use. One difference may be Australia’s large supply of natural resources,
but the shale oil growth in the U.S. offers a comparison. To be fair, much of the sustainability of
GDP growth in Australia has come from expanded population and immigration. Something for
other developed economies (U.S. included) to keep in mind if they want to sustain long-term
growth.

I’m certainly not saying that we are Australia and this cycle will never end. But as long as business
and consumer confidence remains supportive, and you and I keep buying stuff, the cycle can last
longer than people think. That’s why it’s always so important to evaluate and revaluate your Risk
Budget. Take on the risk you are comfortable with, regardless of where you think we are in the
cycle. Doing this will keep you from missing gains in strong years like this one.

                                                                                                            7
All Your Eggs in One Basket
One of the fastest ways to become wealthy also happens to be one of the fastest ways to financial
ruin. Investing predominantly in one stock is like walking a tight rope between wealth, fame, status,
sleepless nights, family turmoil, and financial disaster. However, investors of all socioeconomic
levels will venture into this precarious situation out of blind confidence, ego, or pure ignorance.

Is putting all or most of your proverbial eggs in one basket a successful strategy? Let’s look at the
facts and have you decide.

First, I’ll share a recent conversation I had with an investor about this topic.
                                                                                                                                         From Jeovany Zelaya
The investor – let’s call him Charlie – started a company from his basement in his 20s. He is now a
                                                                                                                                         Client Portfolio Manager
millionaire in his early 30s. Charlie has found success in every entrepreneurial ring he has thrown
his hat into. His next conquest: his financial portfolio.

Charlie tells me, “Getting double-digit returns is easy. I just invested in a company that had steady
revenue growth, and I’ve seen my money double.”

I respond, “Interesting. How do you know this company will continue to do well into the future?”

Charlie tells me how this company has some groundbreaking technology that’s going to reshape
the industry. The story he told was absolutely hypnotizing. It truly sounded like the next Apple. It
wasn’t hard to see why he invested a large portion of his money in this one company.

The stories single-company investors tell themselves and share with others about their
investments come to define them as investors. These narratives are the bacon-wrapped smokies
of everyday conversations. They’re so tempting and irresistible, it’s hard not to want to eat them
all up and dream that everything will pan out as expected.

The truth is that very few of these companies will provide the riches investors hope to achieve.

Hendrik Bessembinder, author of the paper Do Stocks Outperform Treasury Bills?1, examined the
25,300 stocks held in the Center for Research in Security Prices (CRSP) database over the time
period 1926-2015 and revealed some key information that investors should know.

• The average stock traded for seven years and lost
  money (including reinvested dividends).
• The most common return for an individual stock was a
  loss of 100%.
• Only 48% of stocks delivered a positive gain.
• Just 86 stocks – of the 25,300 – were responsible for half
  of the gains during this time period.
• Only 4% of stocks outperformed the return of a one-
  month Treasury bill.
The accompanying chart shows the return distribution for
the constituents of the S&P 500 between 1998 and 2018.

The chart shows that half of the companies in the S&P 500
returned 50% cumulatively during this time, which is only
a 2% annualized return. The average return of the 500
stocks was 228% or 6.1% annualized. This shows that each
stock has less than a 50% chance of producing above-
average returns.

If you were lucky enough to invest in one of these stocks that returned fabulous returns, then
holding onto them would have been a true test of conviction and will power. These individual
stocks provide a roller coaster of returns. For example, if an investor had held onto Apple since
inception, they would have seen their money lose more than 70% of its value at some point
during its life cycle. Amazon? 80%! Microsoft? More than 60%!

1
 Bessembinder, Hendrik (Hank), Do Stocks Outperform Treasury Bills? (May 28, 2018). Journal of Financial Economics (JFE), Forthcoming.
Available at SSRN: https://ssrn.com/abstract=2900447 or http://dx.doi.org/10.2139/ssrn.2900447
                                                                                                                                             8
The asset manager, Alpha Architect, conducted a study of the largest 3,000 U.S. companies during
the time periods 1983-2006 and 2007-2014 and how far their stock prices fell. They found the
following eye-opening results:

• Between 1983 and 2006, about 73% of stocks saw their stock prices fall by more than 50%.
• Between 2007 and 2014, this number increased to 82% of stocks.
Investing in individual companies means taking on a lot of risk. The type of risk that makes your
stomach turn.

Peter Bernstein, author of Against the Gods, once said, “Diversification is the only rational
deployment of our ignorance.” Diversifying our portfolios properly may help us reach our ultimate
financial aspirations with less headache, heartache, and stomachache.

Our financial advisor partners can provide guidance to mitigate this risk and help your basket of
eggs hatch into the realization of your financial goals.

                                                                                                    9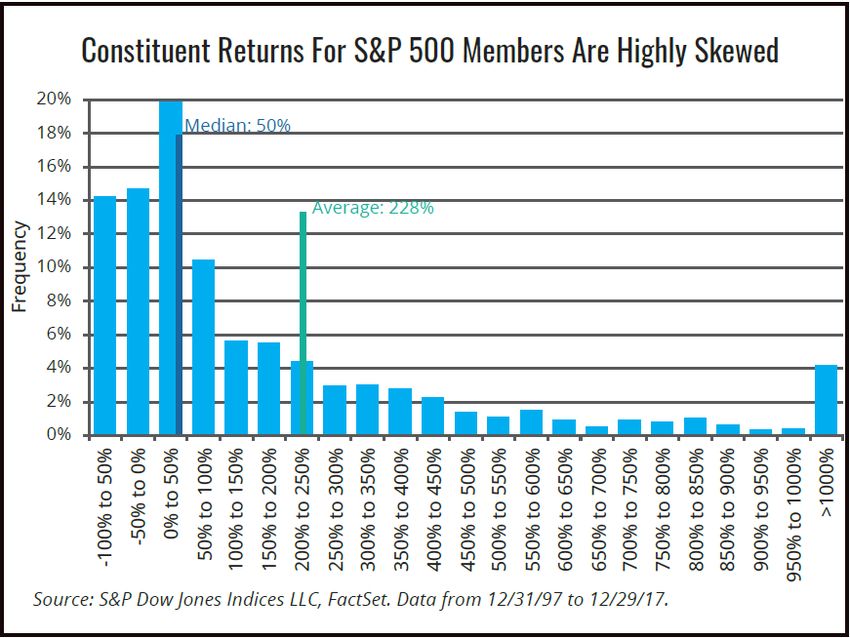
Direct Indexing’s Biggest Edge: Tax Alpha
Since launching our direct-index offering on the Orion Portfolio Solutions TAMP Platform in May
2019, the top question we hear from internal colleagues and advisors alike is: “What exactly is
tax alpha?” As one of the most obvious benefits of direct indexing, I thought it made sense to
highlight what tax alpha is and how it can be maximized through direct-index portfolios.

What is Tax Alpha?

At its most basic level, tax alpha is simply after-tax excess returns minus pre-tax excess returns.
In other words, tax alpha means finding ways to reduce a client’s tax bill using strategies such as      From Shana Sissel, CAIA,
tax-loss harvesting, capital-gains budgeting, and tax-transition management.                             Director of Investment Due
                                                                                                         Diligence & Senior Portfolio
Maximizing Tax Alpha                                                                                     Manager

The size of tax alpha depends on two key factors: the direction of the overall equity market and
the magnitude of individual stock volatility. A falling market is the most obvious way to realize
losses and generate tax alpha, simply because there will be more opportunities. However, market
volatility can also play a role, allowing for portfolio managers to harvest losses even in rising
markets. This is made possible because volatile markets usually result in above-average return
dispersion between stocks.

Tax Alpha Through Tax-Loss Harvesting

This technique involves continuously monitoring a client’s portfolio to identify capital losses,
which can offset capital gains in other parts of the portfolio. Offsetting capital gains taxes reduces
the amount of taxes an investor pays at the end of the year. For our direct-index strategies, we set
a minimum-loss threshold of 10% in a share lot to trigger a tax-loss harvesting review. Below is an
example of an active account on our direct-index platform illustrating the potential performance
benefit a client might achieve by leveraging this approach.

How Does Direct Indexing Create Tax Alpha?

By employing three primary tax-management techniques listed earlier, direct indexing can
customize the management of a client’s individual account to contribute to a better after-tax
experience versus the benchmark.

While our current offering is still limited in what tax-management techniques we can employ, it’s
easy to see how the simple use of tax-loss harvesting can have a big impact on the client’s after-
tax returns. By leveraging this tax-efficient approach to client portfolios, advisors can help clients
keep more money in their pockets while adding more value to clients as advisors.

                                                                                                             10
The Year’s Best Stocks:
Global Edition
Are you surprised by how well the stock market performed in 2019 Don’t be. More than half of the
time, the market is up double digits, and a little over a third of the time, it is up more than 20%!
12-MONTH ROLLING RETURNS LONG-TERM AVERAGE Case Eichenberger, CIMA
Returns > 20% 34% Senior Client Portfolio
Returns between 10 and 20% 23% Manager
Returns between 5 and 10% 11%
Returns between 0 and 5% 8%
Returns between 0 and -5% 6%
Returns between -5 and -10% 5%
Returns < -10% 13%
According to the S&P 500 index
With two market sessions remaining in 2019 at the time of this writing, four stocks in the S&P
500 index were up more than 100%.
STOCK RETURN (%)
ADVANCED MICRO DEVICES 150.16
LAM RESEARCH CORP 120.29
KLA CORP 104.39
TARGET CORP 101.71
Pretty solid returns, no doubt. But can we find higher-returning stocks if we expand our
opportunity set? The answer is typically yes, which is why we believe it is a good idea to invest
with a global mindset.
Below is a sampling of developed international stocks’ performance, via the Vanguard
FTSE Developed Markets index:
STOCK RETURN (%)
ARROWHEAD PHARMACEUTICALS IN 422.79
VARTA AG 374.87
LASERTEC CORP 312.47
DOOSAN SOLUS CO LTD 272.96
STRIKE CO LTD 246.50
The top five stocks more than doubled the best performers of the S&P 500, and 42 stocks on
the index returned more than 150%!
11Below is a look at emerging market stocks, via the MSCI Emerging Markets index:
STOCK RETURN (%)
IMPALA PLATINUM HOLDINGS LTD 301.30
SIBANYE GOLD LTD 251.84
PIRAEUS BANK S.A 249.89
QUALICORP CONS E CORR SEG SA 231.35
PUBLIC POWER CORP 219.94
Pretty stellar returns, too.
My point is not that it’s easy to pick the winners each year, but that an expanded investment
universe presents more opportunities.
The last decade was dominated by the U.S. stock market. Some investors would say that
is always the case. But, as the table below shows, it was a different story just 20 years ago.
10 Year Performance Ranks
Region Rank 1999-2009 Rank 2009-2019
MSCI USA 10 -20% 1 282%
MSCI ACWI 9 -2% 2 181%
MSCI Emerging Asia Index 4 100% 3 163%
MSCI Emerging Markets 2 137% 4 125%
MSCI ACWI ex USA 5 21% 5 106%
MSCI EAFE 7 8% 6 102%
MSCI Europe 8 4% 7 101%
MSCI Pacific 6 20% 8 92%
MSCI Emerging Europe 3 123% 9 77%
MSCI Emerging Latin America 1 288% 10 68%
Where do you want to be invested now? Markets do not run on 10-year cycles, but we believe
the more valuations get stretched in countries, regions, and stocks, the more investors should
expand opportunities to grab the up-and-coming winners of the next 10 years.
12CLS Investment Themes
At CLS, we manage various investment strategies which differ depending on investors’ Risk
Budgets, investment objectives, and other considerations. What connects each of the strategies,
however, are the CLS Investment Themes. These themes are the common threads between all
of our portfolios. They are specific enough to articulate what makes CLS portfolios different,
but they are broad enough for each portfolio manager at CLS to express her or his views. These
themes, which are approved by the CLS Investment Committee, may be held for years or for
months depending on market conditions.
Marc Pfeffer
Chief Investment Officer
BE ACTIVE
We believe investors need to be active, not passive, when building investment portfolios due to
continuous changes in the expected risks and returns of various global stock and bond markets. For
example, CLS portfolios are different from the broad market as some markets are more expensive
and carry more risk than others. Examples include emphasizing value oriented stocks (companies
that can be bought for a lower multiple of sales or earnings) and international stocks (as U.S. stocks
are the most expensive they have been versus international stocks in decades). In addition, when
building portfolios of exchange-traded funds (ETFs), CLS will emphasize smart beta ETFs (rules-
based funds, such as those that only buy securities with the lowest price-to-sales ratios) and actively
managed ETFs (funds that try to be different from their underlying benchmarks).
BE RESILIENT
This theme essentially has two parts. First, the bull market in stocks (now a 10-year increase in
price without a 20% pullback) and the economic expansion are mature. It doesn’t mean that the
demise of either is necessarily imminent, but CLS is nonetheless making the portfolios more
resilient in anticipation of late-cycle market behavior. This means that CLS portfolios will be
putting more emphasis on non-cyclical sectors that should perform better in this anticipated
environment. These sectors would include consumer staples and healthcare. The second part
of this theme is that fixed income (i.e. bonds) remains vital to helping stabilize and manage
portfolio risk. Nonetheless, interest rates are low by historical standards. Thus, investors need
to be creative in diversifying equity risk. CLS will do this by putting more emphasis on alternative
investment strategies, such as merger arbitrage which has low volatility like the bond market,
and real assets such as commodities and real estate investment trust (REITs). Real assets tend
to be more volatile like the stock market, but since they often have a different rhythm to price
movement, they help reduce overall portfolio volatility. They also provide some insurance against
changes in inflation and inflation expectations.
BE INNOVATIVE
Despite what we anticipate to be slower growth in the immediate year(s) ahead, we believe that
the future remains especially bright for the global economy and markets. Due to innovative
technologies, the economy is being reshaped and new opportunities are being presented
in a variety of industries, including cybersecurity, clean energy, healthcare, FinTech, artificial
intelligence, robotics, biotech, and much more.
13Disclosures:
The views expressed herein are exclusively those of CLS Investments, LLC, and are not meant as investment advice and are subject to change. No part of
this report may be reproduced in any manner without the express written permission of CLS Investments, LLC. Information contained herein is derived
from sources we believe to be reliable, however, we do not represent that this information is complete or accurate and it should not be relied upon as such.
This information is prepared for general information only. It does not have regard to the specific investment objectives, financial situation and the particular
needs of any specific person. You should seek financial advice regarding the appropriateness of investing in any security or investment strategy discussed
here and should understand that statements regarding future prospects may not be realized. You should note that security values may fluctuate and that
each security’s price or value may rise or fall. Accordingly, investors may receive back less than originally invested. Past performance is not a guide to future
performance. Investing in any security involves certain systematic risks including, but not limited to, market risk, interest-rate risk, inflation risk, and event
risk. These risks are in addition to any unsystematic risks associated with particular investment styles or strategies. The graphs and charts contained in this
work are for informational purposes only. No graph or chart should be regarded as a guide to investing.
The S&P 500 Index is an unmanaged composite of 500-large capitalization companies. This index is widely used by professional investors as a performance
benchmark for large-cap stocks. An index is an unmanaged group of stocks considered to be representative of different segments of the stock market in
general. You cannot invest directly in an index.
At certain places we offer direct access or ‘links’ to other Internet websites. These sites contain information that has been created, published, maintained
or otherwise posted by institutions or organizations independent of CLS Investments, LLC (CLS). CLS does not endorse, approve, certify or control these
websites and does not assume responsibility for the accuracy, completeness or timeliness of the information located there. Visitors to these websites should
not use or rely on the information contained therein until consulting with their finance professional. CLS does not necessarily endorse or recommend any
product or service described at these websites.
The CFA® is a globally respected, graduate-level investment credential established in 1962 and awarded by CFA Institute — the largest global association
of investment professionals. To learn more about the CFA charter, visit www.cfainstitute.org.
The CAIA® is the globally-recognized credential for professionals managing, analyzing, distributing, or regulating alternative investments. To learn more
about the CAIA, visit https://caia.org/.
CIMA® professionals integrate a complex body of investment knowledge, ethically contributing to prudent investment decisions by providing objective
advice and guidance to individual investors and institutional investors. To learn more about the CIMA, visit https://www.imca.org/cima.
CLS Investments, LLC and Orion Portfolio Solutions, LLC are affiliated companies through their parent company Orion Advisor Solutions, LLC.
Contact Us Today
17605 Wright Street | Omaha, NE 68130
0028-CLS-1/7/2020
14
888.455.4244 | CLSinvest.comYou can also read