Sovereign CDS Market: The Role of Dealers in Credit Events - Federal Reserve Bank of Richmond
←
→
Page content transcription
If your browser does not render page correctly, please read the page content below
Economic Quarterly— Volume 106, Number 3— Third Quarter 2020— Pages 97–113

Sovereign CDS Market: The
Role of Dealers in Credit
Events
                  Lawrence Jia, Bruno Sultanum, and Elliot Tobin

A
           credit default swap (CDS) is a credit derivative that can be
          used as insurance against a reference entity’s credit risk, where
          a reference entity is either a government or corporation that
has issued debt. It is formally a bilateral contract between a protection
seller and protection buyer. The former is taking a short position in the
CDS, while the latter is taking a long position. The protection seller
compensates the protection buyer if there is a credit event with respect
to any of the bonds issued by the contract’s reference entity. Credit
events include bankruptcy, failure to pay, and restructuring, among
other items. In exchange, the protection buyer makes periodic interest
payments to the protection seller until the contract expires.
     As a result of their role in the 2008 …nancial crisis and in the sov-
ereign debt crises in Europe, credit default swaps are among the most
controversial derivative instruments. In both corporate and sovereign
contexts, proponents of CDS attest to their bene…cial e¤ects in provid-
ing and transferring liquidity risk during times of distress.
     Critics view CDS as speculative bets, especially since CDS holders
may hold more CDS than bonds with respect to the reference entity.
That is, if a party owns equal amounts of bonds and CDS for a par-
ticular reference entity, then the party is completely insured against a
negative credit event. In this way, a CDS works pretty much like an
insurance policy on a car, house, or any other asset. However, unlike
insurance, it is possible to own more CDS protection than the under-
lying bonds. As a result, CDS contracts make it possible to trade on

   The views expressed in this article are those of the authors and do not necessarily
   represent those of the Federal Reserve Bank of Richmond or the Federal Reserve
   System.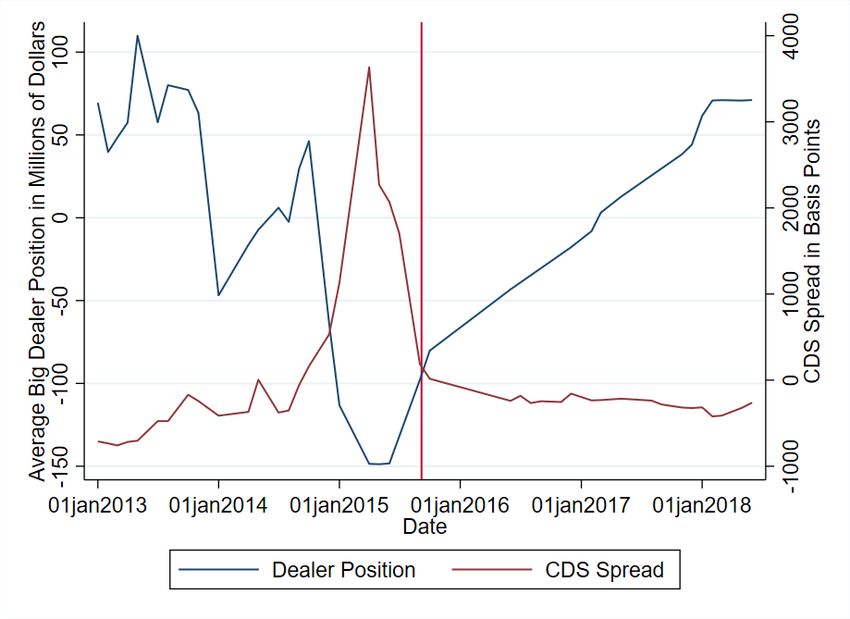
98                 Federal Reserve Bank of Richmond Economic Quarterly

a reference entity’s credit risk without having any exposure to the un-
derlying credit, which can be interpreted as a bet on the deterioration
of the reference entity’s ability to repay its creditors.
     In the sovereign CDS market, the reference entity is a country; as
a result, increases in default risk could have signi…cant economic im-
pact and ethical considerations. Since CDS markets tend to be more
liquid and larger than the corresponding bond market, some academics
and members of the media have argued that speculative bets from
large traders can arti…cially drive the price of a CDS contract up. In
turn, market participants observe the risk of the underlying bonds to
be higher than it actually is, increasing the cost of borrowing for the
distressed countries. Thus, this increases the chances of default arti…-
cially. In this scenario, buying CDS is functionally equivalent to short
selling the bonds. Short selling bonds is nearly impossible due to the
lack of liquidity in bond markets; as a result, the presence of a CDS
contract allows the sovereign bond’s pessimists and optimists to enter
the market, increasing price stability of the underlying bond.
     Previous literature has examined the role of sovereign credit de-
fault swaps and speci…cally the ban of “naked” CDS in the European
Union. In Du¢ e et al. (1999), research has also been conducted on the
endogenous liquidity risk of CDS. However, in the context of distressed
countries, the dealer-provided liquidity that this paper introduces is
a new area of study. Using our regulatory data from the Depository
Trust and Clearing Corporation (DTCC), we are able to see the CDS
position of market participants over time.
     This paper uses a case study approach to suggest that the critics’
conclusion that sovereign CDS markets drive the cost of capital up for
countries may be incorrect, or at least the pressure from short positions
on CDS does not seem to be coming from large dealers. To better
understand the net e¤ects of sovereign CDS markets, we examine the
CDS positions of major CDS dealers as risk changes.1 Speci…cally, we
use Venezuela, Ukraine, and Argentina as case studies. These three
countries have experienced credit events and therefore CDS payouts
since 2008.
     We observe that the large CDS traders in each market, de…ned as
the top ten traders of each country’s CDS, tend to sell (buy) CDS as
risk increases (decreases). This is the opposite direction of change one
would expect if the large dealers were taking speculative bets. We leave
a formal model of this mechanism to a later paper, but the basic logic of
how we tie these changes in positions to market liquidity is as follows.

     1
         We use both CDS spread and bond yield as a measure of risk.
Sultanum et al.: Sovereign CDS Market: The Role of Dealers             99

Large and risk-neutral dealers can take CDS positions that may result
in a large loss with a nonnegligible probability so long as they perceive
the position, combined with the dealer fee, to have a positive expected
value. Smaller and risk-averse institutions that may not be able to
sustain a large loss, rush to buy protection from the large risk-neutral
dealers.
    In this way, dealers provide endogenous liquidity in distressed times
by market making. This may imply that sovereign CDS trading by CDS
dealers can lower endogenous liquidity risk and potentially lower bond
spreads during unstable …nancial periods relative to what they would
have been had the sovereign CDS market not existed.

1.   RELATED LITERATURE

Many analysts and regulators blamed the severe and widespread na-
ture of the 2008 …nancial crisis on CDS, contending that CDS exac-
erbated the housing asset bubble They speci…cally argued that major
…nancial institutions were using CDS for speculation and manipula-
tion with global consequences. These criticisms of CDS were extended
during the European sovereign debt crisis beginning in 2009 (Augustin
et al., 2014). Sovereign CDS are insurance contracts issued against a
country’s public bonds. This new wave of criticism on sovereign CDS
centered on the sovereign CDS market’s role in price discovery and
monitoring, spillover liquidity in the underlying sovereign bond mar-
kets, and hence, adjustments in borrowing costs for the country in times
of distress.
    Studies following the Great Recession and European sovereign debt
crisis have produced mixed results on the practical uses and risks of
CDS markets. We …rst discuss the structure of sovereign CDS mar-
kets and their theoretical role in bond markets. Then, we discuss the
capacity of general (corporate and sovereign) CDS in contagion risk,
the potential for spillover e¤ects, and price discovery/monitoring. Fi-
nally, and most relevant to this paper, we will discuss the potential for
sovereign CDS to provide liquidity in their associated sovereign bond
markets and what that means for a country’s borrowing costs.
    As insurance, CDS markets perform two basic functions. First,
they allow …nancial institutions to hedge their credit risk, thereby free-
ing up regulatory capital to further lend. Second, they let …nancial
institutions take more liquid short positions on bonds (Czech, 2019).
The …rst function is of primary importance to this paper. Theoreti-
cally, by purchasing CDS contracts as hedges, …nancial institutions are
potentially able to lend more capital, increasing liquidity in underlying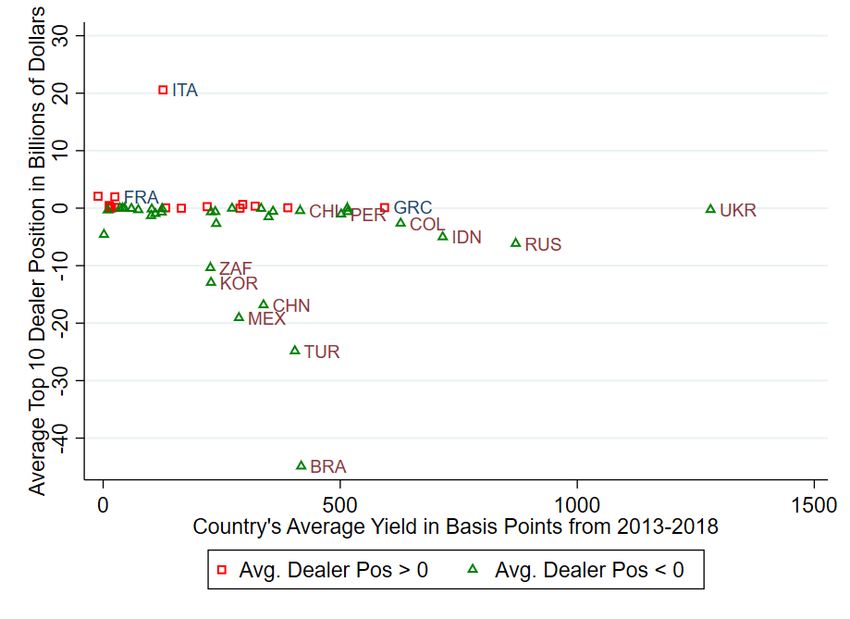
100           Federal Reserve Bank of Richmond Economic Quarterly

bond markets and lowering equilibrium borrowing costs for the bond
issuer in question.
     However, concerns regarding the practical uses of CDS in the wake
of the …nancial crises have marred their reputation. The …rst concern
of CDS use is its contagion potential and spillover e¤ects into global
markets. In Longsta¤ et al. (2011), the authors observe that global
information shocks result in sovereign CDS spreads increasing or de-
creasing together. If one CDS market responds to new information,
this comovement e¤ect can introduce contagion risk to other CDS mar-
kets. However, a subsequent study by Caporin et al. (2013) …nds that
spillover e¤ects of reactions to large CDS spread changes in one CDS
market are largely regionally contained, not global in nature. When it
comes speci…cally to spillover liquidity risk, Bai et al. (2012) also did
not …nd a change in the country’s fundamentals.
     However, having an insurance market can also provide a useful vehi-
cle for price discovery for the underlying entity. For instance, Augustin
et al. (2014) found di¤erences in CDS spreads to be useful in predicting
options pricing and exchange rates up to one week in advance. A trader
has a naked CDS position if it has a larger position in the CDS than
the underlying bonds. Du¢ e (2010) …nds that the use of naked CDS
trading data is also bene…cial to the underlying asset information and
therefore increases the e¢ ciency of the bond market. This information
e¢ ciency was later supported by Coudert and Gex (2013), who recog-
nized that the derivative market provided better information than the
bond market because of higher participation in CDS markets during
recessionary periods. In times of distress, bond traders are likely to
run from the bond market, while CDS traders stay in the market and
provide pricing information.
     In addition to price discovery, CDS have also been found to pro-
vide valuable information for price monitoring. Ismailescu and Phillips
(2011) found CDS to be e¢ cient monitoring tools that increase the
overall informational and pricing e¢ ciency in the market of the un-
derlying entity. This can also propagate greater market participation.
Portes (2012) also found CDS to be accurate, although not perfect,
in pricing credit risk in the long run. However, this same relationship
does not hold in the short run.
     Most relevant to this paper, the presence of a CDS market on the
liquidity of the associated bond market is currently being debated.
Historically, a valuable instance in which the use or disuse of CDS
impacted liquidity in bond markets is the European Central Bank’s
(ECB) gradual ban of naked CDS. A market participant owns a naked
CDS if she owns more CDS than bonds in a given reference entity. It has
been described by Portes (2012) as taking out life insurance on someone
Sultanum et al.: Sovereign CDS Market: The Role of Dealers 101
else’s life. While this paper does not di¤erentiate between naked and
nonnaked CDS trades, studying bans of general CDS can provide useful
literature on CDS’s role in capital markets. In the wake of the European
sovereign debt crisis, the ECB temporarily banned the trade of naked
CDS in 2010. The ECB later permanently banned naked CDS trading
in 2011. A study by Sambalaibat (2013) found that the temporary
ban increased liquidity in underlying sovereign bond markets, citing a
temporary migration of CDS traders to the bond market. However,
the same study found that the permanent ban of naked CDS decreased
liquidity in the underlying sovereign bond markets.
This paper focuses on countries that have experienced severe default-
risk episodes. When countries are low on cash, speculation in a CDS
market, according to Che and Sethi (2011), can divert much-needed
capital away from potential borrowers. The resulting rise in CDS pre-
miums sends information to potential lenders to increase the cost of
funding to the government. The government, which is unlikely to a¤ord
the higher interest, will become more cash-strapped and only increases
long bets in its CDS market: a self-ful…lling prophecy.
But, other literature suggests that the use of CDS can lower the
probability of default. Goderis and Wagner (2011) argue that the use of
nonnaked CDS can reduce risk for ex-ante default. The authors cite the
existence and ownership of insurance policies on sovereign debt as an
incentive for the insurance holder to reject any restructuring o¤er made
by the government. Similarly, Salomao (2017) has a similar …nding: in
distress, the existence of insurance contracts can increase the lender’s
borrowing power, which incentivizes the borrower to default less often.
The author also argues that the existence of insurance contracts can
raise debt levels and lower borrowing costs in equilibrium.
The liquidity bene…ts and risks of CDS have only been studied in
the case of the ECB’s ban of naked CDS and in theory. We try to
contribute to the discussion of CDS as liquidity-providers in under-
lying bond markets, by analyzing how dealers trade sovereign CDS
in both stable and risky time periods, to better understand how the
sovereign CDS market can a¤ect liquidity in the underlying sovereign
bond market. We …nd that in times of distress, big CDS dealers act
as market-makers by taking shorter (longer) CDS positions as risk in-
creases (decreases). These …ndings suggest that large dealers provide
liquidity to the underlying bond market.102 Federal Reserve Bank of Richmond Economic Quarterly
2. HISTORICAL BACKGROUND OF SOVEREIGN
CREDIT EVENTS
Prior to describing the trading patterns, we review the historical and
economic events that a¤ect the risk of the three countries we use as
case studies: Argentina, Ukraine, and Venezuela. All three countries
have defaulted on their debt in recent years; however, the reasons and
economic conditions di¤er.
Ukraine
From 2001 to 2008, Ukraine experienced moderate economic growth
that coincided with a global economic boom. A longstanding relation-
ship with the former Soviet Union allowed Ukraine to import oil from
Russia at approximately half the price per barrel that Western Euro-
pean suppliers were charging in order to power its mineral and natural
resources industries, which comprise most of Ukraine’s economic out-
put. This dependency on foreign oil amounted to approximately 70
percent of its total oil usage by the mid-2000s. During this time, the
Ukrainian economy averaged 7.4 percent annualized growth and large
capital in‡ows from foreign investors.
However, Ukrainian economic woes began in 2006 when cheap ac-
cess to Russian oil began to diminish, limiting domestic production and
exports. This period of supply instability was exacerbated by the 2008
…nancial crisis, in which the International Monetary Fund (IMF) gave
two stand-by disbursements that greatly helped Ukraine weather the
crisis. However, increasingly unstable debt loads reached 91.5 percent
of the Ukrainian GDP in 2009, and that proved critical in the coming
default.
In 2013, new Russian trade restrictions and an inability to increase
industrial production led to foreign investors rating default probabili-
ties at approximately 50 percent in the swap market. Moody’s Investor
Service in 2013 also gave Ukraine’s credit a rating of Caa1, which lim-
ited foreign investment and economic growth. Ensuing political in-
stability, with the ousting of sitting President Viktor Yanukovych in
2014 and the annexation of Crimea by Russia, coincided with a 6.8
percent and 10.4 percent decline in GDP in 2014 and 2015, respec-
tively. Ukraine also experienced a currency crisis in February 2014
when the government began using the hryvnia as a ‡oating currency,
which caused a 70 percent depreciation against the U.S. dollar.
In December 2015, Ukraine missed interest payments on a $3 billion
loan to Russia, which the International Swaps and Derivatives Asso-
ciation (ISDA) determined was a credit event. The IMF then o¤ered
a $17.5 billion, four-year loan program in 2016 that helped stabilizeSultanum et al.: Sovereign CDS Market: The Role of Dealers 103
the hemorrhaging economy. With a positive global economic output,
a small recovery in oil prices, stronger worker productivity, and a gov-
ernment corruption reform program, Ukraine has experienced positive
economic growth since 2016.
Venezuela
Despite having the largest proven oil reserves in the world and being
the sixth largest member of the Organization of Petroleum Exporting
Countries (OPEC), the Venezuelan economy has undergone signi…cant
stresses in the past two decades. Petroleum accounts for approximately
95 percent of Venezuela’s total exports, and its economic growth largely
depends on oil prices.
The Venezuelan economy experienced signi…cant in‡ation in the
late 1990s, peaking near 100 percent in 1996. In‡ation after the elec-
tion of Hugo Chavez calmed to approximately 35 percent from 1996–
2001. Further political and social unrest after the ascension of Chavez
in 1998 have only exacerbated Venezuela’s economic crisis. For in-
stance, the 2002 attempted coup and the 2002–03 labor strike returned
economic growth to pre-Chavez levels. The economic decline continued
into the late 2000s, with a chronic housing shortage, further unsustain-
able in‡ation, political unrest, and high poverty rate. In 2009, the IMF
categorized the Venezuelan recovery as “weak and delayed,”especially
in relation to the relative economic growth of other South American
countries and its largest trading partner, the United States.
Tremors of Venezuelan economic stress occurred in early 2014 with
a global depression in crude oil prices. Although Venezuela has the
world’s largest proven oil reserves, its economy’s heavy reliance on pe-
troleum exports makes its economic growth and prosperity largely de-
pendent on oil prices. Preceding the mid-2014 oil glut, 96 percent of
Venezuela’s …scal revenue originated from oil production. An interna-
tional oil glut formed after a production boost in the North American
shale oil industry, lesser demand from China, and a lack of OPEC pol-
icy uniformity. At its peak, the global economy was outputting over
two million barrels of oil per day. The price per barrel of Venezuelan
oil fell from over $100 in 2012 to approximately $30 in 2015. As a re-
sult, Venezuela ended almost half a decade of steady economic growth
with a 5 percent decline in GDP in the …rst quarter of 2014. The Na-
tional Assembly of Venezuela reported in‡ation to be approximately
4,000 percent in 2017. On December 30, 2017, ISDA declared a credit
event after the Venezuelan government missed two interest payments
amounting to a combined $200 million. Since the selective default,
Venezuela has defaulted on eighteen other sovereign bonds.104 Federal Reserve Bank of Richmond Economic Quarterly
Argentina
Within thirteen years, Argentina has experienced two di¤erent types
of default. First, Argentina defaulted in 2001 on $83 billion of debt.
Second, Argentina defaulted in 2014 on $132 billion of debt after a U.S.
Supreme Court ruling in Republic of Argentina v. NML Capital Ltd.
said that Argentina must repay investors in full from their 2001 default.
The Argentinian economy has struggled with stag‡ation, hyperin-
‡ation, capital ‡ight, and corruption beginning with a military dic-
tatorship that started in 1976. After a brief period of rapid eco-
nomic growth under a democratic government and Minister of Economy
Domingo Cavallo’s anti-in‡ation campaign, Argentina experienced an-
other recession beginning in 1998. Regional economic crises in Brazil
and commodities pricing shocks contributed to slow growth, high un-
employment, and de‡ation. The 2001 Argentinian default was framed
by massive political riots in December 2001 and a struggling export
economy. Consequently, the Argentinian government defaulted on $83
billion in debt after which 93 percent of investors agreed to the restruc-
turing terms, which involved a 70 percent haircut on repayment.
Although the 2014 default was preceded by relative economic growth
between 2002 and 2013, the export-dominated Argentinian economy
struggled again with a sluggish world economy. Further, a unilateral
devaluation of currency, as evidenced with a 1,300 percent increase in
M3 money supply since 2002, has also contributed to the world’s third
highest in‡ation rate in 2014 at an o¢ cial rate of approximately 10 per-
cent. However, news sources speculate the actual in‡ation rate more
realistically hovers at 25 percent.
In this context, the remaining 7 percent of investors who did not
accept the restructuring agreement in 2001 demanded to be repaid in
full. Following the 2001 default, the Argentinian government declared
all debt repayments to be pari passu, that is, repaid with no preference
to investors. The remaining 7 percent of investors then sued in the
U.S. Supreme Court, which upheld lower court rulings in Republic of
Argentina v. NML Capital Ltd. that Argentina’s foreign assets were
not immune from discovery, which resulted in the obligation to pay all
debts in full, valued at approximately $132 billion. As a result, the
Argentinian government declared it would “imminently be in default”
on July 30, 2014, after missing a $529 million interest payment. Stan-
dard and Poor’s then declared Argentina to be in selective default in
the autumn of 2014.Sultanum et al.: Sovereign CDS Market: The Role of Dealers 105
3. DATA
We obtained the dealer CDS positions using the DTCC. The Dodd-
Frank Wall Street Reform and Consumer Protection Act requires real-
time reporting of all swap contracts to a registered swap data repository
(SDR). The DTCC operates a registered SDR on CDS. The Dodd-
Frank Act also requires SDRs to make all reported data available to
appropriate prudential regulators. (See Sections 727 and 728 of the
Dodd-Frank Act.) As a prudential regulator, members of the Federal
Reserve System have access to the transactions and positions involving
individual parties, counterparties, or reference entities that are regu-
lated by the Federal Reserve. Using the DTCC data, we recover a
time series of the average CDS positions of the top ten dealers in three
di¤erent countries from 2013 through 2017.
To get a measure of risk, we use both bond yields and CDS spreads.
To obtain bond prices, a list of deliverable obligations from the CDS
auction was obtained from the Credit Derivatives Determinations Com-
mittee for each country. These bonds were listed with a maturity date,
coupon value, and CUSIP/ISIN number. Bloomberg was used to ob-
tain historical bond prices from January 4, 2010, to February 22, 2019.
Speci…cally, two sets of bond price measurements were obtained. First,
the yield to maturity time series was gathered. Second, a yield to
benchmark measurement was gathered, which values a bond against an
internal Bloomberg benchmark. We chose to construct our own price
index because the price of the deliverable bonds is the most relevant.
Some outstanding sovereign bonds are included in available price in-
dices by JPMorgan and Bloomberg, but are not deliverable in auction.
Nonetheless, using these indices does not change this paper’s results.
Additionally, the initial issue amount was recorded for each bond.
We also collected CDS spreads from Bloomberg for each of the three
countries. The correlation between CDS spreads and yields is near 1.
Since Ukraine does not have bond data for most of the sample, we use
the CDS spread data. Nonetheless, the results are robust to usage of
either yield measures in the countries in which the yield data exists.
To create the bond indices for each country, a weighted average
of the deliverable bond prices for each country was used.2 Each date
has varying numbers of bonds outstanding as the country retires and
issues debt over time. As a result, the individual bond issue amount as a
fraction of the total issue amount for the number of bonds available for a
certain date was used to weight and standardize the bond prices. This
2
Deliverable bonds are the bonds deliverable at the CDS auction for each country.
That is, these are the bonds for which the CDS o¤ers protection.106 Federal Reserve Bank of Richmond Economic Quarterly
was multiplied by the bond price, in yield-to-maturity and yield-to-
benchmark, to obtain a price index of the overall deliverable obligation
bond market in Argentina, Ukraine, and Venezuela. Note that a price
index was not needed for CDS spreads since a CDS o¤ers protection
for all deliverable bonds.
4. FINDINGS
In this section, we highlight how each of the three countries’…nancial
crises illustrate how dealers provide liquidity during …nancial crises by
selling protection. In general, we found that dealers take the oppo-
site position of the market in times of distress, functioning as market-
makers. Speci…cally, as risk increased in a country’s underlying bond
market, dealers decreased their CDS positions. We de…ne big dealers
as the ten largest volume traders of the speci…c CDS over our sample
period. Our results are robust to using the …ve biggest dealers (an-
other common measure). We use the CDS spread as our measure of
risk, where an increasing CDS spread indicates greater risk. Our re-
sults are the same if we use bond yield. Furthermore, we often refer
to long and short positions. If the big dealers have a short (long) po-
sition, they are net sellers (buyers) of CDS. We time detrended the
position and CDS data. Without detrending, our results may have
been skewed because the CDS market has been shrinking over the time
periods considered due to changes in the regulatory landscape. How-
ever, the general …ndings from this section are robust to using the raw
data without detrending it.
Ukraine
In Ukraine, the dealer positions and CDS spread show a very clear
inverse relationship. From the beginning of the sample period to March
2015, risk increased as the dealer position decreased. From March 2015
to the end of the sample period, risk decreased and the dealer position
rose. The latter scenario will not be seen as commonly later in the
paper.
First, from January 2013 to March 2015, the CDS spread increased
by 4500 basis points as Ukraine faced hyperin‡ation and con‡ict with
Russia. During the same period, the net CDS position of big CDS
dealers decreased from a $75 million long position to a $150 million
short position.
Second, following the disbursement deal with the IMF, reduced
tensions with Russia, and an increasingly positive economic outlook in
2015, the period from March 2015 to March 2018 shows a 4,000 basisSultanum et al.: Sovereign CDS Market: The Role of Dealers 107
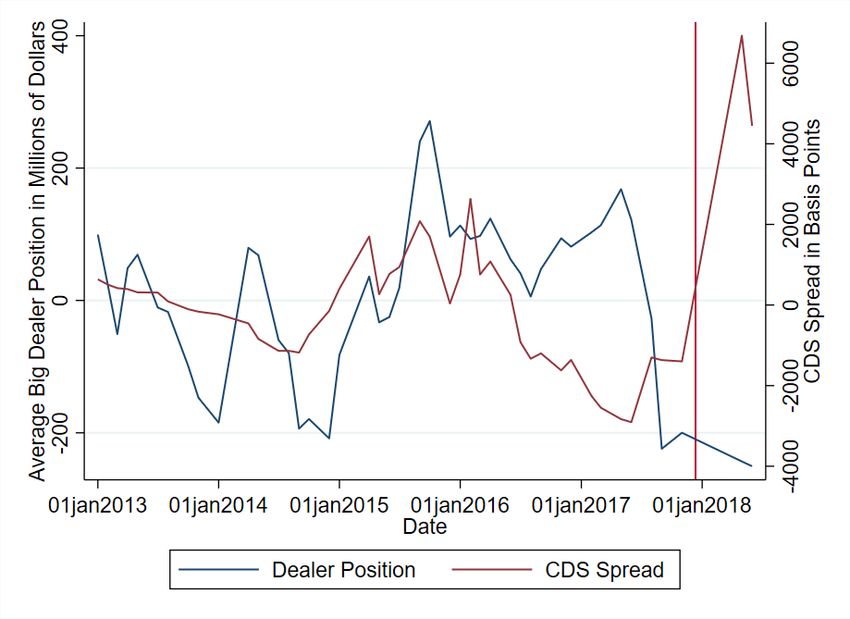
Figure 1 Ukraine: Big Dealer Position vs. CDS Spread
Notes: Both dealer position and CDS spread are time-detrended. The Ukraine
CDS auction date of October 6, 2015, is plotted as a red vertical line to give an
idea of the default date. Big dealers are de…ned as the ten highest-volume traders.
Dealer position is considered positive if the dealers, on net, own protection and
is considered negative if they, on net, sell protection.
point decrease in CDS spreads, a dramatic reduction in the country’s
risk. During the same period, the net CDS position of big CDS dealers
increased by $230 million.
The correlation between the CDS spread and the dealer position is
-0.783. The strong negative correlation is expected based on the strong
inverse relationship over the entire sample period.
Venezuela
In Venezuela, the time period from the beginning of 2017 to mid-2018
strongly supports our hypothesis that big dealers reduce their position
in CDS as risk increases. This time period includes Venezuela’s …rst
selective default in late November 2017. This selective default also108 Federal Reserve Bank of Richmond Economic Quarterly Figure 2 Venezuela: Big Dealer Position vs. CDS Spread Notes: Both dealer position and CDS spread are time-detrended. Big dealers are de…ned as the ten highest-volume traders. The Venezuela CDS auction date of December 13, 2017, is plotted as a red vertical line to give an idea of the default date. Dealer position is considered positive if the dealers, on net, own protection and is considered negative if they, on net, sell protection. caused global worries that debt repayments by the Venezuelan gov- ernment would not hold. ISDA determined that a credit event took place after a missed interest payment. As a result, ratings agencies declared Venezuela to be in selective default. Venezuelan President Nicolás Maduro declared that all sovereign debts must be “re…nanced or restructured.”The initial increase in bond spread beginning in June of 2017 re‡ected a global worry that Venezuela would be imminently defaulting on its debt payments. Investors and media outlets almost unanimously anticipated this selective default would be the …rst of more than twenty defaults tha have occurred since 2017. Beginning in June 2017, the indexed Venezuelan bond spread increased almost 100 basis points.
Sultanum et al.: Sovereign CDS Market: The Role of Dealers             109

    The right side (post January 1, 2017) of Figure 2 depicts the dealer
position and CDS spread over the time period in question. Once news
of the selective default and its subsequent risks was evident, the CDS
spread increased signi…cantly to over 6,000 basis points. As the CDS
spread gradually increased in mid-2017 but prior to the sharp increase
in spread, the dealers sold $400 million of CDS in just a few months,
switching from a net long to a net short position. This is the opposite
response expected from speculators. The Venezuela example not only
demonstrates how dealers sell CDS as risk increases, but also that the
action can occur prior to signi…cantly rising spreads. One possible sce-
nario to explain this is the following. Small risk-averse …rms became
concerned about the possibility of a Venezuelan default a few months
prior to the default becoming extremely imminent and rushed to buy
protection from the dealers. Regardless of the exact reasons, the short-
ing of CDS as risk increases is suggestive that dealers are providing
liquidity to the market and not speculating.
    While the post-2017 period is most indicative of dealers selling
(buying) CDS as risk increases (decreases), the correlation between
CDS and dealer position is -0.153 across the whole sample period.
However, prior to 2017, there is only a slightly negative correlation.
Nonetheless, this suggests that dealers taking the opposite position of
speculative bettors is also true during more moderate periods of in-
creased risk.

Argentina

For Argentina, we focus on the CDS spreads and position after July
2016, following the U.S. Supreme Court ruling in Republic of Argentina
v. NML Holdings Ltd.. From 2013 to mid-2016, the Argentinian swap
market was frozen from trading as the case was pending litigation. The
court ruled that Argentina had the obligation to pay back all debts in
full related to their earlier default, valued at approximately $132 billion.
     In the period from June 2016 to December 2017, (see Figure 3) the
CDS spread decreased by approximately 50 basis points. During the
same period, the big CDS dealers’ average position increased from a
net short position of approximately $275 million to a net long position
of approximately $300 million. That is, the dealers bought CDS as risk
decreased.
     The converse relationship is also demonstrated from January 2018
to June 2018 (see Figure 3), when the CDS spread increased by approx-
imately 150 basis points. During the same period, the big CDS dealers’
average position decreased by $875 million from a net long position of
110 Federal Reserve Bank of Richmond Economic Quarterly
Figure 3 Argentina: Big Dealer Position vs. CDS Spread
Notes: Both dealer position and CDS spread are time-detrended. Big dealers are
de…ned as the ten highest-volume traders. Dealer position is considered positive
if the dealers, on net, own protection and considered negative if they, on net, sell
protection. Due to a long time period of no trading because of the pending U.S.
court decision, we start our analysis in June 2016, so the default is not in this
time period.
approximately $275 million to a net short position of more than $600
million.
The correlation between the CDS spread and the average big dealer
position yielded a value of -0.697, which shows a strong, negative cor-
relation. This indicates that what we have found in the two episodes
discussed previously is also true in the Argentinian sample. That is, as
risk increases (decreases), dealers sell (buy) CDS.
5. EXTENDING OUR FINDINGS
Figure 4, which is extracted from Chaumont et al. (2020), displays the
relationship between average yield and average dealer position aggre-
gated by country from 2013–18. There is a downward trend in FigureSultanum et al.: Sovereign CDS Market: The Role of Dealers 111
Figure 4 Cross-Country Analysis
4, with a correlation coe¢ cient of -0.2. That is, the average dealer CDS
position decreases as a country’s average risk increases. This mirrors
our conclusions from the three case studies above, where we …nd that
the dealer CDS position decreases as risk increases within each coun-
try. To the extent that the cross-country relationship is indicative of
the intracountry relationship, this is evidence that our conclusion from
these case studies generally applies to other countries. Nonetheless, one
could be concerned that within each country represented in Figure 4,
dealer positions do not decrease as risk increases. Perhaps the inverse
relationship only holds when a country is signi…cantly distressed.
Chaumont et al. (2020) address these concerns by using more rigor-
ous empirical speci…cations to determine the relationship between risk
and dealer position. By controlling for country, dealer, and time-…xed
e¤ects, they determine the relationship between risk and dealer posi-
tion within each country. Nondistressed and distressed countries are
also included in the sample; as a result, they are able to determine
if the e¤ect found in this paper is only true in distressed countries.
In several speci…cations and robustness checks, they …nd that as risk
increases (decreases), dealer CDS positions decrease (increase) within112 Federal Reserve Bank of Richmond Economic Quarterly
each country regardless of risk. This is the same conclusion found in
the case studies above.
Chaumont et al. (2020) also propose a formal model aimed at tying
the changes in CDS position to bond market stability and liquidity,
which is assumed in this paper. Combined with the empirical results
in this paper, their model would suggest that the existence of sovereign
CDS markets is bene…cial to borrowers and lowers the cost of borrowing
for countries.
REFERENCES
Augustin, Patrick, Marti G. Subrahmanyam, Dragon Yongjun Tang,
Sarah Qian Wang. 2014. “Credit Default Swaps: A Survey.”
Foundations and Trends in Finance 9 (December): (1–196).
Bai, Jennie, Christian Julliard, and Kathy Yuan. 2012. “Eurozone
Sovereign Bond Crisis: Liquidity or Fundamental Contagion,”
Manuscript.
Caporin, Massimiliano, Loriana Pelizzon, Francesco Ravazzolo, and
Roberto Rigobon. 2015. “Measuring Sovereign Contagion in
Europe.” Journal of Financial Stability 34 (February): 150–81.
Chaumont, Gaston, Grey Gordon, Bruno Sultanum, and Elliot Tobin.
2020. “Sovereign Default and Credit Default Swaps: The Role of
Dealers’Liquidity Provision.” Manuscript (Federal Reserve Bank
of Richmond).
Che, Yeon-Koo. 2010. “Credit Derivatives and the Cost of Capital.”
SSRN Electronic Journal, August.
Coudert, Virginie, and Mathieu Gex. 2010. “The Credit Default Swap
Market and the Settlement of Large Defaults.” International
Economics 3 (March): 91–120.
Czech, Roberto. 2019. “Credit Default Swaps and Corporate Bond
Trading.” Bank of England Sta¤ Working Paper No. 810, July.
Du¢ e, Darrell, and Kenneth Singleton. 1999. “Modeling Term
Structure of Defaultable Bonds.” Review of Financial Studies 12
(February): 687–720.
Du¢ e, Darrell. 2010. “Is There a Case for Banning Short Speculation
in Sovereign Bond Markets?” Bank of France Financial Stability
Review, June.Sultanum et al.: Sovereign CDS Market: The Role of Dealers 113
Goderis, Benedikt, and Wolf Wagner. 2009. “Credit Derivatives and
Sovereign Debt Crises,” Munich Personal RePEc Archive Paper
No. 17314, March.
Ismailescu, Iuliana, and Blake Phillips. 2012. “Savior or Sinner?
Credit Default Swaps and the Market for Sovereign Debt,” SSRN
Electonic Journal, January.
Portes, Richard. 2010. “Ban Naked CDS,” Eurointelligence, March.
Salomao, Juliana. 2017. “Sovereign Debt Renegotiation and Credit
Default Swaps,” Journal of Monetary Economics 90 (October):
50–63.
Sambalaibat, Batchimeg. 2012. “Credit Default Swaps as Sovereign
Debt Collateral,” Manuscript, June.You can also read