A DIFFERENTIATED APPROACH TO MULTI-ASSET INVESTING - Veritas ...
←
→
Page content transcription
If your browser does not render page correctly, please read the page content below

MAY 23 & 24, 2019

A DIFFERENTIATED APPROACH
TO MULTI-ASSET INVESTING
KAPITALMARKTFORUM HAMBURG
LA FRANÇAISE INVESTMENT SOLUTIONS

FOR DISCUSSION PURPOSES ONLY. STRICTLY PRIVATE FOR USE OF PROFESSIONAL CLIENTS (WITHIN THE MEANING OF
MARKETS IN FINANCIAL INSTRUMENTS DIRECTIVE 2004/39/CE AS AMENDED BY DIRECTIVE 2014/65/EU OR SWISS QUALIFIED
INVESTORS AS PER ARTICLE 10 OF THE SWISS COLLECTIVE SCHEMES ACT), ATTENDEES AT THE KAPITALMARKTFORUM
HAMBURG. NOT FOR ONWARD DISTRIBUTION. THIS IS A PROMOTIONAL DOCUMENT.

LA FRANÇAISE INVESTMENT SOLUTIONS (“LFIS”)
                       IS SUCCESFUL INVESTING POSSIBLE WITHOUT STRONG MACRO CONVICTIONS ?

                                  Launched in 2013: current assets under management of $14 bn (1)
COMPLEMENTARY
EXPERTISE
Investment Banking                Complete capital markets infrastructure and strong derivatives trading capabilities
and Asset Management

                                  Experienced Portfolio management teams with complimentary backgrounds in asset management and
                                  bank proprietary trading
$14BN IN AUM1
(30/04/2019)
                                  A quantitative approach to capturing opportunities across markets

50 PROFESSIONALS2
                                  Focus: Two multi-asset approaches (UCITS-compliant with daily liquidity)

                                  1. Premia: A market neutral relative value strategy which can be used as a diversifier for multi-asset
INDUSTRY                             portfolios
RECOGNITION3
                                  2. Perspective: An alternative beta strategy using a risk based approach to extract carry from traditional
                                     asset classes whilst leveraging on differentiated market scenario and avoiding idiosyncratic risk

                       (1)   Unaudited data. As of April 30, 2019. The EUR/USD exchange rate used is based on April 30, 2019 Fininfo closing rate i.e. 1 EUR equals 1.1207 USD.
                       (2)   Unaudited data. Aggregated figure including personnel of LFIS and LFGI as well as personnel of La Française International fully dedicated to LFGI.
                       (3)   The reference to awards or nominations is not an indicator of future awards or nominations. Past performance does not constitute a representation or guarantee as to future results or performance.

                       THIS PRESENTATION IS AN INFORMATIVE DOCUMENT AND IS INTENDED FOR PROFESSIONAL AND QUALIFIED INVESTORS ONLY. THIS IS A PROMOTIONAL DOCUMENT.                                                                 2
LFIS PREMIA STRATEGY

THIS PRESENTATION IS AN INFORMATIVE DOCUMENT AND IS INTENDED FOR PROFESSIONAL AND QUALIFIED INVESTORS ONLY. THIS IS A PROMOTIONAL DOCUMENT.   3

THE DEATH OF DIVERSIFICATION ?
      THE LIMITS OF TRADITIONAL ASSET ALLOCATION METHODS

                                   160                                                                                220

Flexible, GAA and Balanced Funds
                                   150                                                                                200                          Equity risk Prominent in Diversified Portfolios
                                   140                                                                                180

                                                                                                                            MSCI World TR USD
                                   130                                                                                160
                                   120                                                                                140
                                   110                                                                                120
                                   100                                                                                100                       Main asset classes remunerate investors for bearing
                                                                                                                                                         two major macroeconomic risks:
                                    90                                                                                80
                                    80                                                                                60                                GDP Growth Rate and Inflation Rate

                                    70                                                                                40

             1)                     Equity – MSCI World TR USD.
             2)                     Flexible funds – Bloomberg’s Active Indices for Funds (BAIF) – UCITS / Open-ended /                                      Think in terms of Premia
                                    Flexible funds.                                                                                                              Not asset classes
              3)                    Global Asset Allocation (GAA) Funds.
              4)                    Balanced funds – Bloomberg’s Active Indices for Funds (BAIF) – UCITS / Open-ended /
                                    Balanced funds.

   Source: Bloomberg, LFIS. Past performance is not necessarily an indication of future results. Please see the disclosure at the back of this presentation.

      THIS PRESENTATION IS AN INFORMATIVE DOCUMENT AND IS INTENDED FOR PROFESSIONAL AND QUALIFIED INVESTORS ONLY. THIS IS A PROMOTIONAL DOCUMENT.                                                     4
FACTOR-BASED APPROACH
AN ESTABLISHED FRAMEWORK – NEWLY RELEVANT TODAY

    Asset classes are comprised of factors which explain most of their risk and return characteristics

                                                       Food                                      Asset
                                                       Water                                     Factor 1
                                                       Sugar                                     Factor 2
                                                                                                                                           FACTORS MATTER
                                                       Fat                                       Factor 3
                                                                                                                                        NOT ASSET CLASS LABELS
                                                       Protein                                   Factor 4…

     Academics and investment professionals have identified three major type of Premia
              Risk Premia: Compensate investors for taking on additional financial or economic risk
              Style Premia: Compensate investors able to put in place strategies that benefit from certain structural market biases..
              In between Premia: With characteristics of both risk and style Premia.

THIS PRESENTATION IS AN INFORMATIVE DOCUMENT AND IS INTENDED FOR PROFESSIONAL AND QUALIFIED INVESTORS ONLY. THIS IS A PROMOTIONAL DOCUMENT.                      5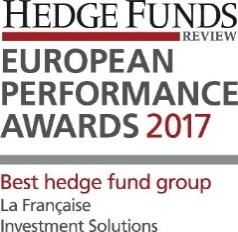
FROM FACTORS TO PREMIA
                      EQUITY MARKET ILLUSTRATION

                     Equities by Common Characteristics (cumulative perf. in %)                                                                                   Smart Beta vs. Risk Premia

                     1400
                                                                                                                              Undervalued small caps
Examples of Equity   1200                                                                                                     with strong operating
                                                                                                                              profits
    Premia
                     1000                                                                                                     Undervalued small caps
    Small Cap
                     800
     Value                                                                                                                    Small caps

     Quality         600                                                                                                      Market
                                                                                                                              Large caps
                                                                                                                              Overvalued large caps
                     400                                                                                                      Overvalued large caps
                                                                                                                              with low operating
                                                                                                                              profits
                     200

                        0

                     -200
                         1963 1967 1971 1975 1979 1983 1987 1991 1995 1999 2003 2007 2011 2015

                      Sources: Database from Kenneth French on the U.S. market, La Française Investment Solutions. Past performance is not necessarily an indication of future results. Please see the disclosure at the back of
                      this presentation.

                      THIS PRESENTATION IS AN INFORMATIVE DOCUMENT AND IS INTENDED FOR PROFESSIONAL AND QUALIFIED INVESTORS ONLY. THIS IS A PROMOTIONAL DOCUMENT.                                                                  6
LFIS PREMIA 2.0 : DIVERSIFICATION IS KEY
STRATEGY OVERVIEW
Premia 2.0: An Innovative Alternative to Traditional Multi-Asset Investing
A relative value approach
Market neutral exposure to pure premia
Premia 2.0 Going beyond traditional academic premia
Beyond the
Academic
Objectives:
Combine the maximum number of decorrelated premia strategies
With different, complementary rationales
Designed to deliver in different market contexts and times
Deliver an all weather performance with a Target Sharpe Ratio of 1.5 (1)
(1) There can be no guarantee that LFIS’ Premia Strategy will deliver on its objectives.
THIS PRESENTATION IS AN INFORMATIVE DOCUMENT AND IS INTENDED FOR PROFESSIONAL AND QUALIFIED INVESTORS ONLY. THIS IS A PROMOTIONAL DOCUMENT. 7LFIS PREMIA 2.0: DIVERIFICATION IS KEY
Academic Premia
Traditional premia (carry, value, momentum,
etc.) across all asset classes
Academic Premia
are only the tip of
the iceberg
LFIS also includes style
premia strategies,
which require a strong
capital markets set-up
Implied Premia Liquidity/Carry Premia
Premia on implied parameters including volatility, Premia captured from holding certain liquid assets
correlation, dispersion and dividends which other market actors can no longer carry
THIS PRESENTATION IS AN INFORMATIVE DOCUMENT AND IS INTENDED FOR PROFESSIONAL AND QUALIFIED INVESTORS ONLY. THIS IS A PROMOTIONAL DOCUMENT. 8LFIS PREMIA 2.0: INVESTMENT PROCESS
STRATEGY SELECTION
A Broad Universe of Premia
ACADEMIC PREMIA IMPLIED PREMIA CARRY PREMIA
VOLATILITY Equity
MOMENTUM Equity Repo Equity
Strict Premia VALUE Equity CARRY Bonds CORRELATION FX
Qualification DIVIDENDS Equity
Criteria MOMENTUM
FX
Bonds/CDS
Attractive
Understandable
Diversifying
Eligible Premia
Robust
Investable
Cost effective
LFIS PREMIA 2.0
AN EFFICIENT ALLOCATION TO APPROXIMATELY
30 PREMIA STRATEGIES
THIS PRESENTATION IS AN INFORMATIVE DOCUMENT AND IS INTENDED FOR PROFESSIONAL AND QUALIFIED INVESTORS ONLY. THIS IS A PROMOTIONAL DOCUMENT. 9LFIS PREMIA 2.0: ALLOCATION PROCESS
THE POWER OF DIVERSIFICATION: “DON’T PUT YOUR EGGS IN THE SAME BASKET”
Individual Premia Premia Families Portfolio
AGGREGATE
Academic VOLATILITY
Premia
Academic
2.2%
Fund Level Premia AGGREGATE
VOLATILITY
Volatility Target
of 5% OVERALL
Implied PORTFOLIO
Equal Risk Premia 25% Implied VOLATILITY
2.1%
Allocation Premia 6.4%
3.7%
Liquidity
Liquidity Carry 2.1%
Carry Premia
Premia
Source: LFIS. Illustrative example. The calculations set forth herein are as of December 2015 and are based on the portfolio’s ex-ante value at risk (“VaR”) results. The VaR methodology used here is historical
and based on LFIS historical shocks. The information is for illustrative purposes only and does not reflect current positioning of the LFIS Vision UCITS – Premia or any other product managed/advised by LFIS.
There is no guarantee that Fund performance would be similar to the returns shown above. Please see the discussion at the back of this presentation regarding model returns.
THIS PRESENTATION IS AN INFORMATIVE DOCUMENT AND IS INTENDED FOR PROFESSIONAL AND QUALIFIED INVESTORS ONLY. THIS IS A PROMOTIONAL DOCUMENT. 10LFIS VISION UCITS – PREMIA
PERFORMANCE OVERVIEW: AS OF APRIL 30, 2019 (1)
LFIS VISION UCITS – PREMIA: Net Monthly Performance – Class IS EUR
Jan Feb Mar Apr May Jun Jul Aug Sep Oct Nov Dec Year
2019 1.18 1.36 0.02 0.23 2.82
2018 0.41 -0.61 -0.33 0.25 0.00 -0.32 -0.10 -0.48 0.70 -0.34 -0.15 -0.83 -1.79
S&P Multi- HFRX
2017 -0.30 0.36 -0.53 0.09 -0.16 0.21 0.76 0.22 0.83 1.15 -0.02 -0.57 2.04 Class IS Asset Risk Global HF
2016 0.93 1.29 0.84 0.79 -0.29 0.35 0.81 0.46 1.26 -0.25 0.60 0.32 7.32 EUR Parity Index Index EUR
(3, 4) (4)
2015 0.84 0.89 1.25 1.88 0.76 -0.57 1.26 -1.84 0.05 1.63 0.23 -0.55 5.93
Ann. Perf. 3.7 % 3.7 % -2.1 %
20% LFIS Vision UCITS - Premia, Class IS EUR
Sharpe Ratio (2) 1.7 0.4 -0.5
15% HFRX Global HF Index EUR
Sortino Ratio (2) 2.3 0.6 -0.5
10%
Ann. Volatility (2) 2.4 % 6.3 % 3.9 %
5%
Skewness (2) -0.4 -0.5 -0.9
0% (2)
Kurtosis 1.6 1.5 1.4
-5%
Downside Risk (2) 1.7 % 4.6 % 3.3 %
-10%
% Positive Mths 64 % 62 % 56 %
-15% Max. Drawdown -2.4 % -7.4 % -12.5 %
Dec-14 Jun-16 Nov-17 Apr-19 (Monthly) 11/17 – 12/18 04/15 - 02/16 05/15 - 12/18
Source: Bloomberg, LFIS.
(1) Past performance does not constitute a representation or guarantee as to future results or performance. The data provided herein is not intended as a representation or warranty by LFIS, or any other
person or entity as to the actual composition of or performance of LFIS Vision UCITS – Premia, Class IS EUR and/or of either fund. Annualized performance figures for LFIS Vision UCITS – Premia are
calculated since inception of the Class IS EUR on December 31, 2014. Annualized and since inception figures for the reference indices are calculated since December 31, 2014. Sharpe and Sortino ratios
use EONIA capitalized as the reference for EUR.
(2) Based on weekly data.
(3) The S&P Multi-Asset Risk Parity Index represents a quantitatively driven asset allocation framework with the goal of equally weighting risk across four asset classes, equities, bonds, credit and commodities.
(4) The S&P Multi-Asset Risk Parity Index and the HFRX Global Hedge Fund Index EUR are market references and provided for information purposes only. Any comparison between a fund and an index has
inherent limitations.
THIS PRESENTATION IS AN INFORMATIVE DOCUMENT AND IS INTENDED FOR PROFESSIONAL AND QUALIFIED INVESTORS ONLY. THIS IS A PROMOTIONAL DOCUMENT. 11LFIS VISION UCITS – PERSPECTIVE STRATEGY THIS PRESENTATION IS AN INFORMATIVE DOCUMENT AND IS INTENDED FOR PROFESSIONAL AND QUALIFIED INVESTORS ONLY. THIS IS A PROMOTIONAL DOCUMENT. 12
LFIS VISION UCITS – PERSPECTIVE STRATEGY
                EXECUTIVE SUMMARY (1)

                LFIS Vision UCITS – Perspective Strategy (the “Fund”) is a Multi-Asset, Total Return Fund

                           Target return objective: 4% p.a. above cash over the medium term

                           Alternative beta strategy with a European focus
A New Take on              Differentiated, risk based derivative-based approach to enhance liquidity and minimize idiosyncratic
 Multi-Asset               risk
  Investing
                           Established strategy track record: annualized performance of 6.0% since inception of the strategy in
                           July 2013 (2)

                (1)   There can be no representation nor guarantee that the Fund will deliver on its objectives.
                (2)   As of April 30, 2019. Historical strategy performance is comprised of the performance of the share class C EUR of French alternative investment fund LFIS Perspective FCP-I (the “Prior French
                      Fund”) which followed an investment strategy equivalent to the LFIS Vision UCITS – Perspective Strategy fund (the “Fund”) - from 30/07/2013 to 15/07/2015 and the performance of the share class
                      IS EUR of the Fund, a Luxembourg UCITS-SICAV from 15/07/2015 through 30/04/2019. Performance shown is net of fees and expenses. Performance is net of a 0.40% management fee and a
                      15% performance fee. Fees may vary by investor and may reduce returns. The annualized performance figure presented herein is net of fees since inception of the Fund on July 31th 2013 and
                      embeds the following calendar performances (Class IS EUR): -3.5% in 2018, +7.5% in 2017, +5.3% in 2016, +2.5% in 2015, +9.7% in 2014, +4.9% in 2013. Past performance is not necessarily an
                      indication of future results. No representation nor guarantee is given by LFIS that the Fund will perform similarly.

                THIS PRESENTATION IS AN INFORMATIVE DOCUMENT AND IS INTENDED FOR PROFESSIONAL AND QUALIFIED INVESTORS ONLY. THIS IS A PROMOTIONAL DOCUMENT.                                                              13
LFIS VISION UCITS – PERSPECTIVE STRATEGY
STRONG PERFORMANCE VERSUS MULTI-ASSET FUNDS (1)
LFIS Vision UCITS
LFIS Vision UCITS – Perspective Strategy vs. Morningstar EUR Allocation categories - Perspective EUR Flexible EUR Cautious EUR Moderate
Cumulative Performance, as of April 30, 2019 Strategy (the Allocation (2) Allocation (2) Allocation (2)
“Fund”)
140
Ann. Perf 6.0% 2.8% 2.2% 3.6%
130 Ann. Vol 6.4% 6.6% 3.2% 6.3%
Sharpe Ratio 0.97 0.45 0.73 0.61
120 Max.
-10.7% -13.3% -7.1% -11.9%
Drawdown
110 Sources: Morningstar Direct, LFIS.
(1) Past performance is not a predictor of future results. The data presented here is not a representation or
guarantee from LFIS, or any other person or entity, of the current composition or performance of any
vehicle implementing the LFIS Perspective strategy. Historical strategy performance is comprised of the
100 performance of the share class C EUR of French alternative investment fund LFIS Perspective FCP-I (the
“Prior French Fund”) which followed an investment strategy equivalent to the LFIS Vision UCITS –
Perspective Strategy fund, a Luxembourg SICAV-UCITS fund (the “Fund”) - from 30/07/2013 to
15/07/2015 and the performance of the share class IS of the Luxembourg fund LFIS Vision UCITS –
Perspective Strategy from 15/07/2015 through 30/04/2019. Strategy performance is net of a 0.40%
90 management fee and a 15% performance fee. Fees may vary by investor and may reduce returns. The
Jul-13 Jan-15 Jun-16 Nov-17 Apr-19 annualized performance figure presented herein is net of fees since inception of the Fund on July 31th
2013 and embeds the following calendar performances (Class IS EUR): -3.5% in 2018, +7.5% in 2017,
LFIS Perspective FCP-I (prior French fund with an investment strategy equivalent to the Fund) +5.3% in 2016, +2.5% in 2015, +9.7% in 2014, +4.9% in 2013. Sharpe ratio calculation is based on Eonia
LFIS Vision UCITS - Perspective Strategy, Class IS EUR capitalized. Risk and performance indicators are purely indicative and should not relied on as a measure
of performance of any financial instrument or contract. These indicators are not a reference. The value of
EUR Moderate Allocation (2) an investment may fall or rise and the investor may not get back some or all of the amount invested and
so should not invest an amount that they are not prepared to lose.
EUR Cautious Allocation (2) (2) These indexes are provided by Morningstar, selected on a discretionary basis by the fund managers, and
EUR Flexible Allocation (2) presented herein for information purposes only and are presented herein for information purposes only.
Index returns do not reflect transaction costs, management fees or other expenses of investing. An
investor cannot invest directly in the indexes. The Fund’s strategy does not call for investing in all
instruments included in the Morningstar categories or in the same relative proportions as such instruments
are held in the indexes. Fund performance is expected to differ from the results of the indexes.
THIS PRESENTATION IS AN INFORMATIVE DOCUMENT AND IS INTENDED FOR PROFESSIONAL AND QUALIFIED INVESTORS ONLY. THIS IS A PROMOTIONAL DOCUMENT. 14LFIS VISION UCITS – PERSPECTIVE STRATEGY
INVESTMENT PHILOSOPHY: CAPTURING THE EQUITY PREMIUM IN RANGY MARKETS
European equity markets have delivered limited performance over dividends in the last 20 years. They have been
characterized by erratic moves and marked upward and downward phases.
EuroStoxx 50 Index: 1998 – 2018
Historical Distribution
6000
5000
4000
3000
2000
1000
0
1998 2002 2006 2010 2014 2018
Sources: Bloomberg, LFIS.
THIS PRESENTATION IS AN INFORMATIVE DOCUMENT AND IS INTENDED FOR PROFESSIONAL AND QUALIFIED INVESTORS ONLY. THIS IS A PROMOTIONAL DOCUMENT. 15LFIS VISION UCITS – PERSPECTIVE STRATEGY
MAJOR BUILDING BLOCKS
CAPTURING PERFORMANCE IN RANGY MARKETS
INVESTMENT GRADE CREDIT
EQUITY PREMIA DIVERSIFYING STRATEGIES
PREMIA
Favoring Performance in Rangy Capturing Premia from Investment Capturing Complementary Sources
Markets Grade credit Exposure of Performance with Limited
Duration Risk
Derivative-based implementation to Selling protection on a diversified
capture the volatility and long term group of investment grade issuers Multiple strategies with limited risk
mean reversion premia budget
CORE ALLOCATION DIVERSIFYING ALLOCATION
70-100% of the risk budget 0-30% of the risk budget
Carry strategies capturing the insurance premium Carry positive strategies decorrelated
embedded in extreme risk scenarios versus the core portfolio
For illustration purposes. This information does not reflect actual or future positioning of the Fund’s portfolio, which allocation may vary depending on the market conditions.
THIS PRESENTATION IS AN INFORMATIVE DOCUMENT AND IS INTENDED FOR PROFESSIONAL AND QUALIFIED INVESTORS ONLY. THIS IS A PROMOTIONAL DOCUMENT. 16LFIS VISION UCITS – PERSPECTIVE STRATEGY
CAPTURING THE VALUE EMBEDDED IN LOW PROBABILITY SCENARIOS ON EQUITIES
Pricing of Extreme Downside Risk on Equities
Historical occurrence of an equity drop of more than 50% at the end of a 5-year period is very low (LFIS VISION UCITS – PERSPECTIVE STRATEGY
CAPTURING THE VALUE EMBEDDED IN LOW PROBABILITY SCENARIOS ON CREDIT
European Investment Grade Credit Premia
Default occurrence is far below implied average pricing levels (driven by risk aversion)
Especially true for investment grade companies where default risk is very limited (LFIS VISION UCITS – PERSPECTIVE STRATEGY
CORE STRATEGY ALLOCATION
LFIS uses a risk-based approach to allocate amongst core strategies
Investment grade credit ranks senior to equity within the capital structure in the event of a default
Investment grade credit exposure typically has a lower premium versus sale of an equity extreme scenario
However, various flow dynamics can lead to both strategies offering comparable value => in which case, exposure to credit risk
is favored
Annual Remuneration: Equity Downside Risk and Investment Grade Credit (1)
Source: Bloomberg, LFIS.
(1) Past performance is nor a reliable indicator of future results neither a representation or guarantee of future results. Theoretical calculations provided for illustrative purposes only. No rate of return can be
guaranteed, nor should any projected rate of return be implied by the illustrations above. Please see the discussion at the back of this presentation regarding hypothetical illustrations and theoretical calculations.
The theoretical calculations set forth above have been developed by LFIS with certain assumptions in mind. These assumptions may prove incorrect or incomplete, and similar assumptions may not apply with
respect to investments made by any contemplated strategy or product in differing circumstances. The theoretical calculations shown here are for informational purposes only, and no investment decisions should
be made based upon these theoretical calculations.
THIS PRESENTATION IS AN INFORMATIVE DOCUMENT AND IS INTENDED FOR PROFESSIONAL AND QUALIFIED INVESTORS ONLY. THIS IS A PROMOTIONAL DOCUMENT. 19LFIS VISION UCITS – PERSPECTIVE STRATEGY
DIVERSIFYING STRATEGIES
Rates have been the historical diversifier of multi-asset funds
In the current market context, adding other sources of diversifying carry is key
Examples of diversifying strategies beyond rates duration:
1. Cash Management: Equity (repo trades), Credit (negative basis trades), Sovereign short term bonds hedged into EUR, …
2. Overwriting Strategies: Selling of short term call options
3. Relative Value Strategies: Credit curve strategies, …
Source: LFIS. For illustration purposes. This information does not reflect actual or future positioning of the Fund’s portfolio, which allocation may vary depending on the market conditions.
THIS PRESENTATION IS AN INFORMATIVE DOCUMENT AND IS INTENDED FOR PROFESSIONAL AND QUALIFIED INVESTORS ONLY. THIS IS A PROMOTIONAL DOCUMENT. 20LFIS VISION UCITS – PERSPECTIVE STRATEGY
HISTORICAL PERFORMANCE ATTRIBUTION: AS OF APRIL 30, 2019
Impact of core and diversifying allocations to global performance
The diversifying allocation has delivered significant performance and reduced Fund volatility over time
Core Allocation vs. Diversifying Allocation
Cumulative performance
115 Core Allocation
Diversifying Allocation
110
105
100
95
90
85
Jul-15 Oct-16 Jan-18 Apr-19
2015 2016 2017 2018 YTD 2019
Core Allocation -2.8% 1.9% 6.4% -2.8% 6.9%
Diversifying Allocation 0.9% 3.6% 1.2% 0.7% 2.2%
Source: LFIS. Performance attribution figures are gross of fees. The figures provided herein relate to past periods; past performance is not constant over time. Past performance does not constitute a
representation neither guarantee as to future results or performance. No representation nor guarantee is made in this respect by LFIS.
THIS PRESENTATION IS AN INFORMATIVE DOCUMENT AND IS INTENDED FOR PROFESSIONAL AND QUALIFIED INVESTORS ONLY. THIS IS A PROMOTIONAL DOCUMENT. 21LFIS VISION UCITS – PERSPECTIVE STRATEGY
PERFORMANCE OVERVIEW: AS OF APRIL 30, 2019 (1)
LFIS VISION UCITS – PERSPECTIVE STRATEGY (the “Fund”): Net Monthly Performance LFIS Vision UCITS
Euro STOXX
– Perspective
Jan Feb Mar Apr May Jun Jul Aug Sep Oct Nov Dec Year EUROSTOXX 50®
(3, 4)
50® Index (3)
Strategy
2019 2.77 2.23 1.31 1.94 8.50 18.15
2018 0.15 -1.26 -0.18 1.48 0.04 -0.17 1.23 -0.31 0.10 -2.25 -0.33 -2.00 -3.50 -12.03
2017 0.98 0.72 1.30 1.58 0.49 0.42 0.12 0.20 1.11 0.34 0.51 -0.53 7.47 9.15 Ann. Perf. 6.0% 6.9%
2016 -2.90 -3.27 6.05 1.13 0.47 -2.03 2.94 0.68 0.13 0.76 -0.47 2.04 5.28 3.72
2015 0.52 -3.94 -2.19 4.38 0.20 -1.84 -3.04 -9.41 Sharpe Ratio (2) 1.0 0.4
Sortino Ratio (2) 1.3 0.6
(2)
Ann. Volatility 6.4% 16.7%
FCP Perspective (prior French fund with a strategy equivalent to the Fund): Net Monthly Performance
Jan Feb Mar Apr May Jun Jul Aug Sep Oct Nov Dec Year EUROSTOXX 50® (3, 4) Skewness (2) -0.1 -0.1
2015 1.93 2.16 0.66 -0.27 1.21 -0.83 0.75 5.71 17.47
Kurtosis (2) 2.5 1.3
2014 -1.09 2.76 0.18 2.18 2.08 0.54 -1.11 2.22 0.07 -0.84 2.83 -0.36 9.72 4.01
2013 -0.65 2.37 2.05 0.59 0.45 4.87 12.88 Max. Drawdown
-11% -25%
(Weekly)
Source: Bloomberg, LFIS.
(1) Past performance is not a predictor of future results. The data presented here is not a representation or guarantee from LFIS, or any other person or entity, of the current composition or performance of any vehicle implementing the LFIS Perspective
Strategy. Historical strategy performance is comprised of the performance of the share class C EUR of French alternative investment fund LFIS Perspective FCP-I (the “Prior French Fund”) which followed an investment strategy equivalent to the LFIS
Vision UCITS – Perspective Strategy fund, a Luxembourg SICAV-UCITS fund (the “Fund”) - from 30/07/2013 to 15/07/2015 and the performance of the share class IS of the Luxembourg fund LFIS Vision UCITS – Perspective Strategy from 15/07/2015
through 30/04/2019. Strategy performance is net of a 0.40% management fee and a 15% performance fee. Fees may vary by investor and may reduce returns. Sharpe ratio calculation is based on Eonia capitalized. Risk and performance indicators are
purely indicative and should not relied on as a measure of performance of any financial instrument or contract. These indicators are not a reference. The value of an investment may fall or rise and the investor may not get back some or all of the amount
invested and so should not invest an amount that they are not prepared to lose.
(2) Based on weekly data.
(3) The Euro STOXX 50® Index is a market reference and is provided for information purposes only. Index returns do not reflect transaction costs, management fees or other expenses of investing. An investor cannot invest directly in the index. The Fund’s
strategy does not call for investing in all instruments included in the Euro STOXX 50® Index or in the same relative proportions as such instruments are held in the index. Fund performance is expected to differ from the results of the index.
(4) The Euro STOXX 50 ® Index in 2015 presented above for the LFIS Vision UCITS – Perspective Strategy fund is considered between 15/07/2015 and 31/12/2015, The Euro STOXX 50 ® Index in 2015 presented above for the LFIS Perspective FCP-I fund
is considered between 31/12/2014 and 15/07/2015,
22CONCLUSION THIS PRESENTATION IS AN INFORMATIVE DOCUMENT AND IS INTENDED FOR PROFESSIONAL AND QUALIFIED INVESTORS ONLY. THIS IS A PROMOTIONAL DOCUMENT. 23
KEY TAKEAWAYS

                                                                        LFIS’ PREMIA                                                                                          LFIS’ PERSPECTIVE
                                                                         APPROACH                                                                                                 APPROACH
                                           “The power of diversification is greater than the power                                                      “Extracting income from a wide range of asset class
                                                              of conviction”                                                                                           and market scenarios”

                                            A highly diversified, all-weather, multi-asset fund                                                            A multi-asset, total return fund using a risk based
                                                                                                                                                           approach for allocation
                                            Potential diversifier in wide range of portfolios
                                                                                                                                                           Multiple drivers of diversification and differentiation
                                            Annualized performance since inception (Class IS
                                            EUR) (1):                                                                                                      Annualized performance since inception (Class IS
                                                  Returns of 3.7% with Volatility of 2.4% and Sharpe                                                       EUR) (2):
                                                  Ratio of 1.7                                                                                                    Returns of 6.0% with Volatility of 6.4% and Sharpe
                                                                                                                                                                  Ratio of 1.0

1)   As of April 30, 2019. Performance shown is net of fees and expenses and is for the LFIS Vision UCITS – Premia, Class IS EUR since inception of the share class on December 31, 2014. Past performance is not necessarily an indication
     neither a guarantee of future results. The fee rate used is that of this Class IS EUR and is equal to a 1.25% management fee per annum and a 15% performance fee. Fees may vary by investor and will reduce returns.
2)   Past performance is not a predictor of future results. The data presented here is not a representation or guarantee from LFIS, or any other person or entity, of the current composition or performance of any vehicle implementing the LFIS
     Perspective strategy. Historical strategy performance is comprised of the performance of the share class C EUR of French alternative investment fund LFIS Perspective FCP-I (the “Prior French Fund”) which followed an investment strategy
     equivalent to the LFIS Vision UCITS – Perspective Strategy fund, a Luxembourg SICAV-UCITS fund (the “Fund”) - from 30/07/2013 to 15/07/2015 and the performance of the share class IS of the Luxembourg fund LFIS Vision UCITS –
     Perspective Strategy from 15/07/2015 through 30/04/2019. Strategy performance is net of a 0.40% management fee and a 15% performance fee. Fees may vary by investor and may reduce returns. The annualized performance figure
     presented herein is net of fees since inception of the Fund on July 31th 2013 and embeds the following calendar performances (Class IS EUR): -3.5% in 2018, +7.5% in 2017, +5.3% in 2016, +2.5% in 2015, +9.7% in 2014, +4.9% in 2013.
     Sharpe ratio calculation is based on Eonia capitalized. Risk and performance indicators are purely indicative and should not relied on as a measure of performance of any financial instrument or contract. These indicators are not a reference.
     The value of an investment may fall or rise and the investor may not get back some or all of the amount invested and so should not invest an amount that they are not prepared to lose.

                                       THIS PRESENTATION IS AN INFORMATIVE DOCUMENT AND IS INTENDED FOR PROFESSIONAL AND QUALIFIED INVESTORS ONLY. THIS IS A PROMOTIONAL DOCUMENT.                                                                       24
LFIS VISION – PREMIA OPPORTUNITIES
PERFORMANCE OVERVIEW: AS OF APRIL 30, 2019 (1)
LFIS VISION – PREMIA OPPORTUNITIES: Net Monthly Performance – Class IS EUR
Jan Feb Mar Apr May Jun Jul Aug Sep Oct Nov Dec Year
2019 1.92 1.88 0.56 0.85 5.30
2018 0.47 -0.70 -1.19 1.02 0.81 -0.38 0.42 -0.73 1.14 0.43 0.12 -1.17 0.19 S&P Multi- HFRX
2017 0.23 0.60 -0.64 0.30 -0.52 0.23 1.14 0.49 0.94 1.34 0.05 -0.97 3.21 Class IS Asset Risk Global
2016 0.44 0.07 2.16 2.52 0.46 1.81 1.91 0.70 1.74 0.29 1.62 1.05 15.76 EUR Parity Index HF Index
(3)
EUR (4)
2015 4.67 1.56 1.78 0.51 0.18 0.08 1.24 -1.47 -1.10 1.79 0.07 -0.45 9.08
2014 -1.24 2.09 1.16 -0.34 0.60 0.29 1.20 -0.96 1.58 0.42 1.60 -0.01 6.51 Ann. Perf. 7.4 % 3.9 % -1.8 %
2013 0.20 0.20
Sharpe Ratio (2) 2.1 0.5 -0.4
Sortino Ratio (2) 3.0 0.7 -0.5
60%
LFIS Vision - Premia Opportunities, Class IS EUR
Ann. Volatility (2) 3.6 % 5.9 % 4.1 %
40% HFRX Global HF Index EUR (4)
Skewness (2) -0.0 -0.4 -0.8
20% Kurtosis (2) 2.5 1.5 1.9
Downside Risk (2) 2.5 % 4.1 % 3.3 %
0%
% Positive Mths 77 % 63 % 54 %
-20%
Max. Drawdown -2.6 % -7.4 % -12.9 %
Dec-13 Sep-15 Jul-17 Apr-19 (Monthly) 08 - 09/15 04/15 - 02/16 08/14 - 12/18
Source: Bloomberg, LFIS.
(1) Annualized and since inception figures are net of fees and expenses and calculated since inception of the Class IS EUR, from December 27, 2013. Sharpe and Sortino ratios use EONIA capitalized as the reference for EUR and Fed Funds TR for
USD. Past performance does not constitute a representation or guarantee as to future results or performance. The data provided above is not intended as a representation or warranty by LFIS, or any other person or entity as to the future
performance of the Class IS EUR or of the Fund overall. The fee rates used are those of the Class IS EUR and are equal to a 1.5% management fee p.a. and a 20% performance fee. Fees may vary by investor and will reduce returns. Returns
include reinvestment of dividends and other gains.
(2) Based on weekly data.
(3) The S&P Multi-Asset Risk Parity Index represents a quantitatively driven asset allocation framework with the goal of equally weighting risk across equities, bonds, credit and commodities. The comparison between a fund and an index has inherent
limitations. The S&P Multi-Asset Risk Parity Index is developed and provided by S&P Dow Jones Indices LLC. Index returns do not reflect transaction costs, management fees or other investment expenses. An investor cannot invest directly in the
index. The Fund’s strategy does not call for investing in all instruments included in the S&P Multi-Asset Risk Parity Index or in the same relative proportions as such instruments are held in the index. Fund performance is expected to differ from the
results of the S&P Multi-Asset Risk Parity Index.
(4) The HFR HFRX Global HF EUR Index is a market reference and is provided for information purposes only. Index returns do not reflect transaction costs, management fees or other expenses of investing. An investor cannot invest directly in the
index. The Fund’s strategy does not call for investing in all instruments included in the HFRX Global Hedge Fund Index EUR or in the same relative proportions as such instruments are held in the index. Fund performance is expected to differ from
the results of the index.
THIS PRESENTATION IS AN INFORMATIVE DOCUMENT AND IS INTENDED FOR PROFESSIONAL AND QUALIFIED INVESTORS ONLY. THIS IS A PROMOTIONAL DOCUMENT. 25SPECIFIC RISKS WARNING1
No assurance can be given that each fund specified in the presentation herein (each a “Fund”) will achieve its investment
objective. The below list of risks is not exhaustive.
Investment Manager Risk: LFIS has total trading authority over each Fund. The use of a single investment manager applying
generally similar trading programs could mean lack of diversification and, consequentially, higher risk.
Risk of Loss: An investment in the proposed investment strategies is speculative. The performance of each Fund can be volatile.
An investor could lose all or substantially all of its investment in the proposed investment strategies due to risks including market
fluctuations and counterparty risk.
Leverage: The use of leverage creates an opportunity for greater yield and total return but exposes each Fund to greater capital
risk.
Alternative Strategies and Derivatives: The proposed investment strategies may use relative value, merger arbitrage, risk
arbitrage and event-driven strategies. These strategies are inherently speculative and results may significantly fluctuate from period
to period. Each Fund may use derivative instruments which may or may not achieve their intended objective and involve additional
specific risks.
Model Risk: Each Fund rely on quantitative valuation models developed by LFIS. As market dynamics shift, previously successful
models may become outdated or inaccurate losses may be incurred before this is noticed.
Re-Correlation Risk: The volatility of each Fund could increase in the event of increased correlation between underlying strategies.
Fees: LFIS’ management and performance fees and expenses may offset the trading profits of each Fund.
(1) Not a complete list of risks. For information only. This brief statement does not disclose all the risks and other significant aspects in connection with each Fund. Any decision to invest in each Fund must be
based solely upon the information contained in each Fund’s legal documentation that should be reviewed carefully prior to any investment. Any person subscribing for an investment in each Fund must be able
to bear the risks involved.
THIS PRESENTATION IS AN INFORMATIVE DOCUMENT AND IS INTENDED FOR PROFESSIONAL AND QUALIFIED INVESTORS ONLY. THIS IS A PROMOTIONAL DOCUMENT. 26IMPORTANT NOTICE This material (the “Material”) is being provided by La Française Investment Solutions for the internal use of the attendees of the Kapitalmarktforum Hamburg only, in good faith on a strictly confidential and non- reliance basis, solely at the recipient’s request for information and for discussion purposes only. It may not be copied or circulated, in whole or in part, without the prior written consent of La Française Investment Solutions or any of its affiliates (“LFGIS”). This Material is solely for the use of the recipient who has received it directly from LFGIS. It is not for use by retail customers under any circumstances. This Material does not constitute an offer or solicitation, nor is it the basis for any contract for the purchase or sale of any investment, security or product or for participating in any investment strategy. If any offer of securities is made, it will be pursuant to the applicable current prospectus, information memorandum or final documentation (as amended or supplemented from time to time), which contains material information not contained herein and which supersedes this Material in its entirety. LFGIS disclaims any and all liability relating to a decision based on or for reliance on this Material. This Material has not been reviewed, approved or disapproved by any federal or state securities commission, state administrator or any other regulatory authority in any jurisdiction. Any representation to the contrary is a criminal offense. The distribution of this Material in certain jurisdictions may be restricted by law. The recipient represents that it is able to receive this Material without contravention of any applicable legal or regulatory restrictions in the jurisdiction in which it resides or conducts business. LFGIS does not accept any responsibility for ensuring that a recipient complies with applicable laws and regulations. The Material does not constitute, and may not be used for or in connection with, an offer or solicitation by anyone in any jurisdiction in which such offer or solicitation is not authorized or to any person to whom it is unlawful to make such offer or solicitation. Due to its simplification, this Material is partial and thus the information can be subjective. The information set forth herein does not purport to be complete and is subject to change without notice. LFGIS has no obligation (express or implied) to update any or all of the Material or to advise the recipient of any changes, nor does LFGIS make any express or implied warranties or representations as to the completeness or accuracy or accept any responsibility for errors. This Material does not take into account the recipient’s objectives, financial situation or needs. This Material shall not be deemed to constitute investment advice and/or tax, accounting, regulatory, legal or other advice and it should not be relied upon as the basis for a decision to enter into a transaction or as the basis for an investment decision. The recipient should make its own appraisal of the risks. The recipient is urged to consult with its own advisers with respect to legal, tax, regulatory, financial, accounting and other matters concerning any investment decision. Investments in any fund or product managed and/or advised by LFGIS are accepted from eligible investors only, on the basis of the relevant current prospectus, information memorandum or final documentation (as amended or supplemented from time to time). Potential investors should be aware that any direct or indirect investment in any investment vehicle described herein is subject to significant risks, including total loss of capital, such investments may be highly volatile, and there are significant restrictions on transferability and redemption of an interest in such investment vehicle. Liquidity of an investment described herein is not guaranteed and there are circumstances under which such liquidity may be restricted or may not be possible. Investors should be able to bear the financial risks and limited liquidity of this investment. Alternative investments are suitable only for sophisticated investors who are able to sustain a loss of their entire investment. No assurance can be given that the investment objectives of the investment vehicles presented herein will be achieved or that an investor will not lose all or substantially all of his or her investment. Investment managers may use investment strategies and financial instruments that, while affording the opportunity to generate positive returns, also provide the opportunity for increased volatility and significant risk of loss. The investments described herein are also subject to the risk of counterparty or issuer default. This brief statement does not disclose all the risks and other significant aspects in connection with transactions of the type described in the Material. Any decision to enter into any transaction should be made after reviewing carefully and rely solely on the relevant prospectus or information memorandum (in particular, for further explanation of the risks and conflicts of interest associated with the types of investments illustrated herein), conducting such diligence and investigations as the investor deems necessary and consulting the investor’s own legal, accounting and tax advisors in order to make an independent determination of the suitability and consequences of any investment. Analysis and conclusions express the views of LFGIS and may be subject to change without notice. All information, analysis and conclusions herein present LFGIS’s current knowledge and market estimation at the time of its production. Nevertheless it can contain unintended erroneous statements or presentations and the information may change at any time without previous announcements and/or notices to the recipient of this Material. Thus, a liability or guarantee for the up-to-datedness, correctness and completeness of the allocated information, estimation and opinion cannot be assumed. Information contained herein may vary from previous or future published versions of this Material. Information regarding the background and experience of personnel of LFGIS are provided for information purposes only. Such persons may not necessarily continue to be employed by LFGIS and may not perform or continue to perform services for LFGIS. The reference to league tables and awards are not an indicator of future places in league tables or awards. Unless otherwise noted, information provided herein is current as of the date on the front cover. The data including but not limited to scenarios and investment guidelines set forth in this Material are presented for illustrative purposes only and such data could vary significantly from the final investment policy and/or actual results. Where past performance, past experience and track record information is provided, this is not necessarily representative of future results: performance is not constant over time and the value of investments may fall as well as rise. No representation is made that any results or other figures indicated in this Material will be achieved and that investments will achieve comparable results to targeted returns. Investment may be subject to gearing and should be considered higher risk than a similar ungeared investment. Investment returns may be subject to foreign currency exchange risks. Actual results on unrealized investments described herein will depend on, among other factors, management fees, future operating results, the value of the assets and market conditions at the time of disposition, legal and contractual restrictions on transfer that may limit the liquidity, any related transactions costs and the timing and manner of sale, all of which may differ materially from the assumptions and circumstances on which the valuations used in the prior performance data contained herein are based. THIS PRESENTATION IS AN INFORMATIVE DOCUMENT AND IS INTENDED FOR PROFESSIONAL AND QUALIFIED INVESTORS ONLY. THIS IS A PROMOTIONAL DOCUMENT. 27
IMPORTANT NOTICE
HYPOTHETICAL PERFORMANCE RESULTS HAVE MANY INHERENT LIMITATIONS, SOME OF WHICH ARE DESCRIBED BELOW. NO REPRESENTATION IS BEING MADE THAT ANY ACCOUNT WILL OR
IS LIKELY TO ACHIEVE PROFITS OR LOSSES SIMILAR TO THOSE SHOWN. IN FACT, THERE ARE FREQUENTLY SHARP DIFFERENCES BETWEEN HYPOTHETICAL PERFORMANCE RESULTS AND
THE ACTUAL RESULTS SUBSEQUENTLY ACHIEVED BY ANY PARTICULAR TRADING PROGRAM.
ONE OF THE LIMITATIONS OF HYPOTHETICAL PERFORMANCE RESULTS IS THAT THEY ARE GENERALLY PREPARED WITH THE BENEFIT OF HINDSIGHT. IN ADDITION, HYPOTHETICAL TRADING
DOES NOT INVOLVE FINANCIAL RISK, AND NO HYPOTHETICAL TRADING RECORD CAN COMPLETELY ACCOUNT FOR THE IMPACT OF FINANCIAL RISK IN ACTUAL TRADING. FOR EXAMPLE, THE
ABILITY TO WITHSTAND LOSSES OR TO ADHERE TO A PARTICULAR TRADING PROGRAM IN SPITE OF TRADING LOSSES ARE MATERIAL POINTS WHICH CAN ALSO ADVERSELY AFFECT ACTUAL
TRADING RESULTS. THERE ARE NUMEROUS OTHER FACTORS RELATED TO THE MARKETS IN GENERAL OR TO THE IMPLEMENTATION OF ANY SPECIFIC TRADING PROGRAM WHICH CANNOT
BE FULLY ACCOUNTED FOR IN THE PREPARATION OF HYPOTHETICAL PERFORMANCE RESULTS AND ALL OF WHICH CAN ADVERSELY AFFECT ACTUAL TRADING RESULTS.
Some statements and analysis in this Material and some examples provided are based upon or derived from the hypothetical performance of models developed by LFGIS and/or third parties. In particular, in
connection with certain investments for which no external pricing information is available, LFGIS will rely on internal pricing models, using certain modeling and data assumptions. Such valuations may vary from
valuations performed by other parties for similar types of investments. Models are inherently imperfect and there is no assurance that any returns or other figures indicated in this Material and derived from such
models will be achieved. LFGIS expressly disclaims any responsibility for (i) the accuracy of the models or estimates used in deriving the analyses; (ii) any errors or omissions in computing or disseminating the
analyses; or (iii) any uses to which the analyses are put.
Returns or other figures indicated in this Material and derived from such models generally reflect the retroactive application of a model with the benefit of hindsight and are not based on any actual client account
or composite performance. Such returns or figures do not reflect the results of actual trading and are not guarantees of future results because they are derived from mathematical modeling techniques of the
economic and financial markets that may or may not reflect actual conditions and events. Actual trading results frequently are less favorable than model results. The returns or other figures referenced in this
paragraph are provided for informational purposes only and should not be considered a recommendation to buy or sell any securities or investment advice. The assumptions and projections displayed are
estimates, hypothetical in nature, and meant to serve solely as a guideline and should not be considered an indication of actual performance. Model construction and implementation has not taken into account the
investment objectives, financial situation, or particular needs of any individual investor.
The recipient should use caution when considering this modeled information. Such information is inherently limited in its ability to reflect the actual returns that would have been achieved. LFGIS, like all
investment advisers, has an incentive to present returns that reflect positively on its investment strategies. While LFGIS seeks to apply models objectively and consistently, LFGIS may be unsuccessful in
removing all instances and forms of bias from the model construction and implementation processes and/or this Material. There is no guarantee that any client results actually achieved will align with these
modeled results.
Fees will reduce returns. The modeled returns included in the Material are presented net of investment advisory fees.
Any hypothetical illustrations, forecasts and estimates contained in this Material are forward looking statements and are based upon assumptions. Hypothetical illustrations are necessarily speculative in nature
and it can be expected that some or all of the assumptions underlying the hypothetical illustrations will not materialize or will vary significantly from actual results. Accordingly, the hypothetical illustrations are only
an estimate and LFGIS assumes no duty to update any forward looking statement. This Material may also contain historical market data; however, historical market trends are not reliable indicators of future
market behavior.
Any forward looking information and past performance information contained in this Material was prepared without a view necessarily towards public disclosure or compliance or conformity with published
guidelines of the Institute of Certified Public Accountants or with generally accepted accounting principles, in each case whether relating to historical, pro forma or other financial or statistical information or data.
LFGIS makes no representation or warranty (express or implied) of any nature nor is responsible or liable in any way with respect to the completeness or accuracy of any information, projection, representation or
warranty (express or implied) in, or omission from, this information.

Certain portions of this presentation show theoretical calculations or other hypothetical illustrations based on LFGIS internal views and modeling. The recipient should use caution when considering such
theoretical calculations or other hypothetical illustrations. Theoretical calculations or other hypothetical illustrations like these are inherently subjective and will reflect LFGIS’ inherent biases. There is no guarantee
that any results will align with these theoretical calculations or other hypothetical illustrations. Some or all results may be substantially less favorable than indicated by such theoretical calculations or other
hypothetical illustrations, and, as with any investment, it is possible that the recipient could lose money. Additionally, investment-related expenses as well as deductions for fees and other expenses will reduce
returns.

THIS PRESENTATION IS AN INFORMATIVE DOCUMENT AND IS INTENDED FOR PROFESSIONAL AND QUALIFIED INVESTORS ONLY. THIS IS A PROMOTIONAL DOCUMENT.                                                                                  28
IMPORTANT NOTICE

Although some information has been provided by LFGIS, the information is based on information furnished by third parties the accuracy and completeness of which has not been verified by LFGIS or any person. All
information and data in this Material is established on the accounting information, on market data basis or has been sourced from a number of recognized industry providers. All accounting information, except
otherwise specified, is un-audited. While such sources are believed to be reliable and accurate, none of LFGIS or its respective affiliates, directors, officers, employees, partners, members or shareholders assumes
any responsibility for the accuracy or completeness of such information. Details of these sources are available upon request. Any pictures, plans, drawings, diagrams or schedules set forth in this Material are
provided for information purposes only.
LFGIS makes no representation or warranty (express or implied) of any nature nor is responsible or liable in any way with respect to the completeness or accuracy of any information, projection, representation or
warranty (express or implied) in, or omission from, this information.
All names, trademarks, logos and slogans identifying the La Française group’s products and/or services are exclusive property of the La Française group and are restricted from use of any kind unless prior written
consent is provided for by the La Française group or the relevant entities within the La Française group.
Notice to European investors: Any potential investment in any securities or financial instruments described herein may not be suitable for all investors. Any prospective investment will require you to represent that
you are a “professional client”, as defined in the Markets in Financial Instruments Directive “MiFID”. The securities and financial instruments described herein may not be available in all jurisdictions. Investments in or
linked to hedge funds are highly speculative and may be adversely affected by the unregulated nature of hedge funds and the use of trading strategies and techniques. Also, hedge funds are typically less
transparent in terms of information and pricing and have much higher fees than registered funds. Investors in hedge funds may not be afforded the same protections as “retail investors” as defined in the MiFID.
Notice to investors in Switzerland: the distribution of shares of any fund managed by LFIS referred to this Material (each, a “Fund”) in Switzerland will be exclusively made to, and directed at, qualified investors (the
"Qualified Investors"), as defined in the Swiss Collective Investment Schemes Act of 23 June 2006, as amended ("CISA") and its implementing ordinance. Accordingly, the Fund has not been and will not be
registered with the Swiss Financial Market Supervisory Authority (“FINMA”). The prospectus, this document and/or any other offering materials relating to the Shares may be made available in Switzerland solely to
Qualified Investors. Swiss representative: BNP Paribas Securities Services, Paris, succursale de Zurich, Selnaustrasse 16, CH-8002 Zurich, Switzerland. Swiss paying agent: BNP Paribas Securities Services,
Paris, succursale de Zurich, Selnaustrasse 16, CH-8002 Zurich, Switzerland. Place of performance and jurisdiction in respect of the Shares distributed in and from Switzerland: registered office of the Swiss
representative.
Information concerning awards and nominations: With respect to the awards and nominations referred to herein, please note that LFIS did not pay any fee to participate in the relevant competition. Please also note
the following details concerning specific awards and nominations:
HedgeWeek: Based on a 'peer review system' whereby HedgeWeek readers - including institutional and high net worth investors as well as managers and other industry professionals at fund administrators, prime
brokers, custodians and advisers - are invited to elect a 'best in class' in a series of categories via an online survey. In each category, the firms with the most votes at the end of the voting period are subject to a final
review by Hedgeweek's Senior Editorial team.
EuroHedge: Quantitative process based on Sharpe ratios and returns over the relevant time period. Nominations are decided by those funds in each peer group that achieve the strongest Sharpe ratios over 12
months, so long as they also beat the median returns in their relevant peer groups and are within 10% of their high-water marks. The eventual winners will be the funds that have the best returns, as long as they
also have Sharpe ratios within 25% of the best Sharpe of the nominees in their relevant peer groups.
Hedge Funds Review: Expert judging panels review the risk and return characteristics of the top funds and agree a shortlist and winner in each category. The judging panels, chaired by Hedge Funds Review awards
editor Margie Lindsay, are impartial and unbiased. Winners are selected based on a rigorous methodology that combines quantitative and qualitative analysis. The awards reward genuine performance, quality and
skill.
Alt Credit Intelligence: Shortlisted entries are judged by a panel of top investors and investment consultants with the winners based on criteria including overall net performance, risk-adjusted performance and AUM,
alongside investor attitudes to the fund.
Credit Flux: Decided based on volatility-adjusted weighted performance.
HFM Week: Expert judging panels review quantitative and qualitative characteristics of the top funds and agree a shortlist and winner in each category.

THIS PRESENTATION IS AN INFORMATIVE DOCUMENT AND IS INTENDED FOR PROFESSIONAL AND QUALIFIED INVESTORS ONLY. THIS IS A PROMOTIONAL DOCUMENT.                                                                                29
IMPORTANT NOTICE Investors Choice: The scoring methodology incorporates a set of qualitative criteria covering the investment process, risk management framework and depth of research team, as well as a set of quantitative performance measures including annualized returns, volatility and maximum drawdown. The judges review manager profiles on the Allocator portal and independently assign a score from 1 to 10 in each of the qualitative assessment areas for each fund. Average scores for the qualitative and quantitative sets of criteria are then calculated and combined in equal measure to reach the total score. This total score determines the winner in each category. MondoAlternative: Funds registered for sale in Italy and present in the MondoAlternative database are eligible. Quantitative process based on Sharpe ratios and returns over the relevant time period. Hedge Fund Journal: Decided based on risk adjusted returns as calculated using the Sharpe Ratio. Les Actifs du Patrimoine Innovation Awards: Awards for innovation including in the areas of product, marketing, client service, distribution services, and fee structures. Submissions are evaluated by a jury of experts, before whom each asset manager is asked to make their case. Kepler Rating: Kepler research reports and ratings are focused on UCITS hedge funds. Reports are only written once Kepler has met with the manager(s) of the respective funds. Ratings are based on the findings of Kepler’s analysts with respect to how attractive a fund is both in absolute terms and relative to its peers. Key elements are robustness and consistency of approach, and funds will usually have a multiyear track record of achieving their investment objective and targeted returns. The EURO STOXX 50® Index (the “Index”) and its brands are the intellectual property of Stoxx Limited, Zurich, Switzerland (“Stoxx”) and/ or its licensors (the “Licensors”) and are used under license. Stoxx and its Licensors do not sponsor, endorse, sell or promote in any way values, securities, options or any other product or service based on the Index and disclaim any liability in connection with the trading of products or services based on the index. Investors requiring additional information are invited to consult the website www.stoxx.com. This Material is not subject to the Autorité des Marchés Financiers’ (“AMF”) approval and was not submitted for approval to the AMF. © 2019 La Française Investment Solutions and its Affiliated Companies. All rights reserved. THIS PRESENTATION IS AN INFORMATIVE DOCUMENT AND IS INTENDED FOR PROFESSIONAL AND QUALIFIED INVESTORS ONLY. THIS IS A PROMOTIONAL DOCUMENT. 30
LA FRANÇAISE GROUP

                    For forty years, La Française has                                 La Française has a multi-expertise
                          been developing core                                      business model organized around four
                      competencies in third party                                   core activities: securities, real estate,
                          asset management.                                           investment solutions and direct
                                                                                         financing. The group caters to
                                                                                  institutional and private clients throughout
                                                                                                    the world.

                       With 635 professionals and                                  Credit Mutuel Nord Europe (“CMNE”), a
                        offices in Paris, Frankfurt,                               banking and insurance group present in
                     Geneva, Stamford (CT, USA),                                   Northern France and Belgium with total
                           Hong Kong, London,                                          regulatory capital of €3.3bn as at
                       Luxembourg, Madrid, Milan,                                 31/12/2017, holds 99% of the voting rights
                         Seoul and Singapore, La                                    of La Française (as at 24/07/2018). La
                    Française manages over €68bn                                   Française employees and management
                      in assets (as of 31/03/2019).                                 are also shareholders in the company.

Source: La Française Group. Assets under Management (“AUM”) figure is unaudited and represents the combined assets of the four business lines of the La Française Group, global asset management,
global real estate investment management, global investment solutions and global direct financing.

THIS PRESENTATION IS AN INFORMATIVE DOCUMENT AND IS INTENDED FOR PROFESSIONAL AND QUALIFIED INVESTORS ONLY. THIS IS A PROMOTIONAL DOCUMENT.
You can also read