Computer simulations of air quality and bio-climatic indices for the city of Sofia
←
→
Page content transcription
If your browser does not render page correctly, please read the page content below
Preprints (www.preprints.org) | NOT PEER-REVIEWED | Posted: 16 June 2021                            doi:10.20944/preprints202106.0440.v1

          Article

          Computer simulations of air quality and bio-climatic indices for
          the city of Sofia
          Georgi Gadzhev 1,*, Kostadin Ganev 1

                                       1 National Institute of Geophysics, Geodesy and Geography - Bulgarian Academy of Sciences, Acad. G.
                                         Bonchev str., bl. 3 1113 Sofia, Bulgaria; ggadzhev@geophys.bas.bg, kganev@geophys.bas.bg
                                       * Correspondence: e-mail ggadzhev@geophys.bas.bg; Tel.: 0035929793328

                                       Abstract: Air pollution is responsible for any adverse effects on human beings. Thermal discom-
                                       fort, on the other hand, is able to overload the human body and eventually provoke health impli-
                                       cations due to the heat imbalance. Methods: The aim of the present work is to study the behavior of
                                       two bio-climatic indexes and statistical characteristics of the air quality index for Sofia city - the
                                       capital of Bulgaria for the period 2008 - 2014. The study is based on WRF-CMAQ model system
                                       simulations with a spatial resolution of 1 kilometer. The air quality is estimated by the air quality
                                       index, taking into account the influence of different pollutants and the thermal conditions by two
                                       indices, respectively, for hot and cold weather. Results: It was found that half of the heat and cold
                                       index categories are present in the simulations. Their distribution has some spatial features. All air
                                       quality categories are present in the domain, with dominance only of the O3 and PM10. Conclu-
                                       sions: It was found that Sofia is not so hot and air polluted place, but in some situations, people
                                       have to have some concerns when intend to be outdoors for a prolonged time.

                                       Keywords: air quality; thermal comfort; air quality index; heat index; wind chill; Bulgaria; Europe

                                       1. Introduction
                                            The air is the living environment of human beings, and obviously, a number of at-
                                       mospheric parameters have great importance for the quality of life and human health.
                                       Some of the most important groups of characteristics of the atmosphere directly affecting
                                       the quality of life and human health are as follows:
                                            Chemical composition of atmosphere: The air quality (AQ) is a key element for the
                                       well-being and quality of life of European citizens. According to the WHO, air pollution
                                       severely affects the health of European citizens [1] (between 2.5 and 11% of the total
                                       number of annual deaths are due to air pollution [2]). There is considerable concern about
                                       impaired and detrimental air quality conditions over many areas in Europe, especially in
                                       urbanized areas, in spite of about 30 years of legislation and emission reduction. Current
                                       legislation (e.g., ozone daughter directive 2002/3/EC and the recent directive 2008/50/ЕС
                                       for AQ and clean air for Europe [3,4]) requires informing the public on AQ, assessing air
                                       pollutant concentrations throughout the whole territory of Member States and indicating
                                       exceedance of limit and target values, forecasting potential exceedance and assessing
                                       possible emergency measures to abate exceedance using modelling tools.
                                            Despite international – including European – agreements and protocols regarding
                                       different constituents of air pollutants (sulfur dioxides, nitrogen dioxides, organic com-
                                       pounds, heavy metals, etc.), decreasing pollution and accumulated knowledge have an
                                       only partial effect. The situation is especially severe regarding ozone in urban areas. The
                                       main reasons for this are the increased emissions of ozone precursors (basically nitrogen
                                       dioxide and organic compounds).
                                            Special attention is paid to primary emitted or secondary formed particulate matter,
                                       which size varies from 0.01 µm to 50 µm. They have the property to adsorb on their sur-
                                       face various chemical compounds, including some toxic substance (heavy metals, black

            © 2021 by the author(s). Distributed under a Creative Commons CC BY license.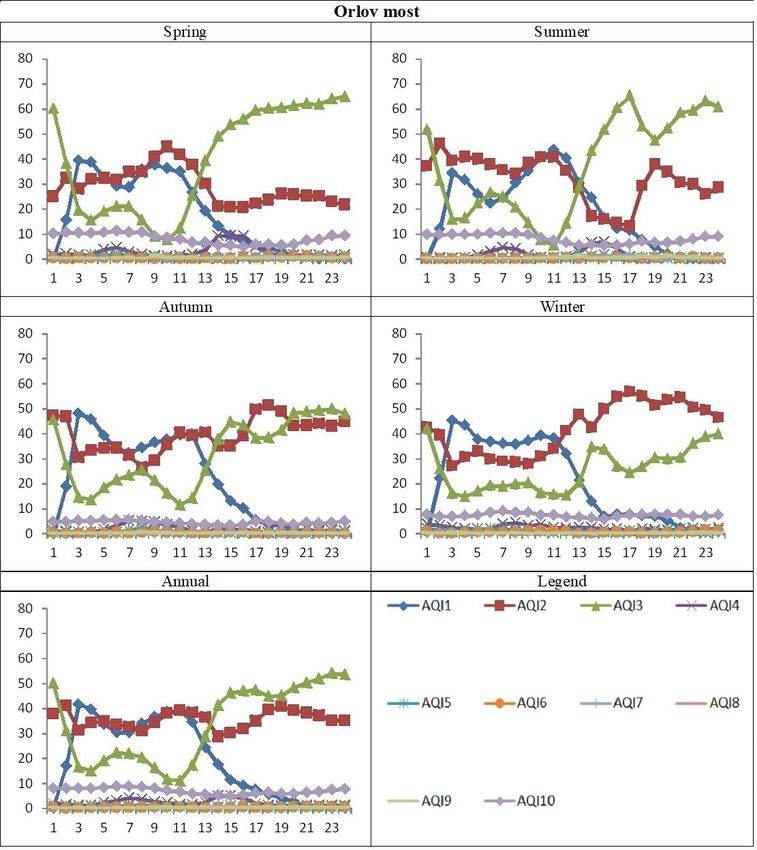
Preprints (www.preprints.org) | NOT PEER-REVIEWED | Posted: 16 June 2021                doi:10.20944/preprints202106.0440.v1

                                                                                                                        2 of 19

                                    carbon and organic hydrocarbons), NH3, NOx and VOCs, mutagens, DNA modulators
                                    etc., and interacting with them or catalyzing the processes taking place between these
                                    compounds, contribute to the formation of secondary atmospheric pollutants – other
                                    aerosol components which is difficult for quantitative determination. Since 1990 began
                                    the separation of particulates in several major fractions: PM10 (Particulate matter, with
                                    diameter < 10µm), PM2.5 (Particulate matter with diameter < 2.5µm), and ultrafine par-
                                    ticulate matter with diameter < 0.1 µm (PM01). Particulate matters enter the body by the
                                    respiratory system, and depending on their size, are fractionalized in its different sec-
                                    tions. The particles with a diameter below 2.5 µm reach pulmonary alveolus, where along
                                    with the adsorbed on their surface compounds, may fall in pulmonary macrophages,
                                    respectively in the whole body, and generate harmful effects on human health.
                                          The established strong association between the increased incidence of respiratory,
                                    cardiovascular, neoplastic diseases, the reduced life expectancy, and air pollution, on the
                                    other hand, define the latter as a socially significant issue. [5-8]. A number of studies
                                    conducted in Bulgaria, also confirm the link between air pollution and human health,
                                    mostly in regions having serious environmental problems [9-12].
                                          Physical parameters of the atmosphere: A number of parameters of the near-surface
                                    atmosphere (temperature, humidity, radiation, wind speed, pressure) jointly form an
                                    important bioclimatic characteristic of the habitable human environment. The condition
                                    when there is no strain on the human thermoregulatory system is called thermal comfort.
                                    When the air temperatures are high, the person should take additional precautions be-
                                    cause dangerous health conditions expressing as unpleasant feelings could occur, such as
                                    hyperthermia, cramps, sunburn, sunstroke, and even death [13]. Higher humidity could
                                    decrease or stop perspiration, and it is the main additional factor impeding the human
                                    thermoregulatory system from reaching balance. In cold weather, there is a possibility for
                                    hypothermia. In that case, the main additional factor for worsening the health conditions
                                    is the stronger wind, which increases the convection from the human body, hence its
                                    cooling. The temperature of the uncovered parts in particular, and eventually the body
                                    core temperature decrease. A number of studies [14-17] present different methods for
                                    calculating of discomfort index and evaluating the role of thermal comfort on the quality
                                    of life and human health.
                                          More complicated methods for calculation of Discomfort Indexes taking into ac-
                                    count additional factors, such as wind speed and solar radiation, is also available. Pre-
                                    dicted Mean Vote – PMV [18] and Physiologic Equivalent Temperature - PET [19] are
                                    based on the human heat balance model [20-24]. These methods account for the total heat
                                    effect due to all physical factors that affect the human body's thermal sensation using the
                                    human heat balance equation. This equation uses as input the ambient temperature, wind
                                    speed, relative humidity, and mean radiant body temperature under different man ac-
                                    tions and clothes. Two of the most used indexes are heat index [25-27] and wind chill
                                    index [28,29]. They are numerical values in several intervals, called categories, each of
                                    which corresponding to a different degree of deviation from the comfort. They are used
                                    to study the extreme heat and cold conditions in Bulgaria from observations [30-32] and
                                    Southwestern Europe from model simulations [33]. One of the aims of that research is to
                                    study the recurrence of the hot and cold conditions with different degrees of severity in
                                    the Sofia city region – the capital of Bulgaria by two indexes - heat index and wind chill.
                                          It has been found that extremely high temperatures cause bigger morbidity risk and
                                    mortality cases. Especially at risk are urban areas because urban microclimate is rela-
                                    tively warmer than the surrounding non-urban environment, a phenomenon called
                                    “Urban heat island”.
                                          The objectives of the present study are to perform reliable, comprehensive, and
                                    detailed studies of the impact of lower atmosphere parameters and characteristics on the
                                    quality of life and health risks for the population in the city of Sofia by applying appro-
                                    priate and up to date methodology.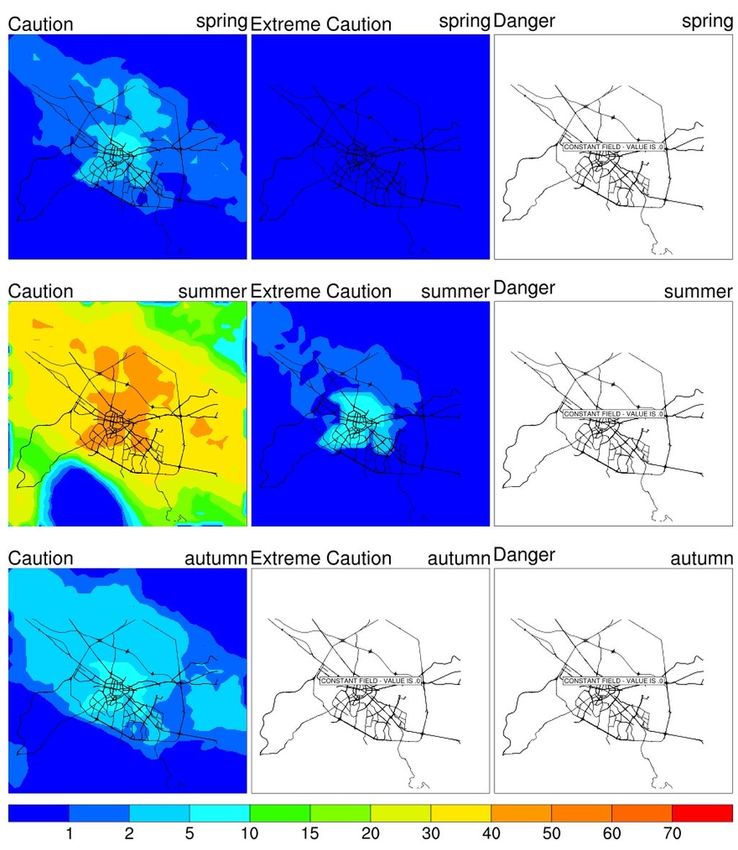
Preprints (www.preprints.org) | NOT PEER-REVIEWED | Posted: 16 June 2021                  doi:10.20944/preprints202106.0440.v1

                                                                                                                           3 of 19

                                         Thus formulated study objectives contain several keywords, which have to be ex-
                                    plained:
                                         Methodology: this is the totality of metrics for evaluation of the atmospheric pa-
                                    rameters impact on the quality of life and health risks for the population; a set of properly
                                    chosen and well verified and validated models of atmospheric dynamics and chemical
                                    composition; databases; a set of appropriately defined scenarios for extensive computer
                                    simulation experiments.
                                         Reliable and comprehensive studies: This means carrying out of extensive and ap-
                                    propriately enough defined numerical experiments, which to form statistically significant
                                    ensembles of output data, which reflex the diversity of meteorological conditions with
                                    their typical recurrence and which to allow making reliable conclusions for the atmos-
                                    pheric characteristics impact on population quality of life and health risks.
                                         Detailed studies: This means high enough spatial/temporal resolution of the com-
                                    puter simulations, which to reflect the multi-scale nature of the processes, to make it
                                    possible the detecting interactions of different scale phenomena and tracking the basic
                                    mechanisms and pathways trough, which low atmosphere characteristics are formed,
                                    respectively their impact on population quality of life and health risks.

                                    2. Materials and Methods
                                           The AQI evaluations are based on extensive computer simulations of the AQ in Sofia
                                     carried out with good resolution using up-to-date modeling tools and detailed and reli-
                                     able input data [34-43].
                                           All the simulations are based on the US EPA Model-3 system:
                                           WRF v.3.2.1 [44] - Weather Research and Forecasting Model, used as meteorological
                                     pre-processor; In the System, WRF is driven by the NCEP GFS (Global Forecast System)
                                     data that can be accessed freely from [45]
                                           CMAQ v.4.6 - Community Multi-scale Air Quality model [46,47] the Chemical
                                     Transport Model (CTM), and
                                           SMOKE - the Sparse Matrix Operator Kernel Emissions Modelling System [48] the
                                     emission pre-processor of Models-3 system.
                                           TNO inventory [49] is exploited for the territories outside Bulgaria in the mother
                                     CMAQs domain. For the Bulgarian domains the National inventory as provided by
                                     Bulgarian Executive Environmental Agency is used.
                                          For calculation of the bio-climatic indexes, we use the air temperature and relative
                                    humidity at 2 meters and 10m wind speed from numerical simulations of the
                                    bio-meteorological conditions with the WRF-ARW model for the Sofia city for the
                                    2008-2014 period with a spatial resolution of 1 km. The configuration set uses WSM
                                    6-class graupel microphysical parameterization scheme [50], CAM schemes for parame-
                                    terization of the longwave and shortwave radiation [51]. The land-surface parameteriza-
                                    tion scheme is Pleim-Xiu [52]. The planetary boundary layer parameterization scheme is
                                    ACM2 (Pleim) [53].
                                           One of the most commonly used indices is the UK Daily Air Quality Index [55], also
                                     used in Bulgaria [34-36,54]. According to [55] 4 main pollutants – O3, NO2, SO2, and
                                     PM10 are used to calculate the AQI. The further considerations in the paper are made on
                                     the basis of long-term AQ simulations, which make it possible to reveal the climate of
                                     AQI spatial/temporal distribution and behavior. The AQI is defined in several segments,
                                     different for each considered pollutant. Different averaging periods are used for different
                                     pollutants. The breakpoints between index values are defined for each pollutant sepa-
                                     rately (Table 1). For each particular case the concentration of each pollutant falls into one
                                     of the bands, shown in Table. Thus, the AQI for each pollutant is determined. The overall
                                     AQI, which describes the impact of the ambient pollutant mix, is defined as the AQI for
                                     the pollutant with maximum value of the index.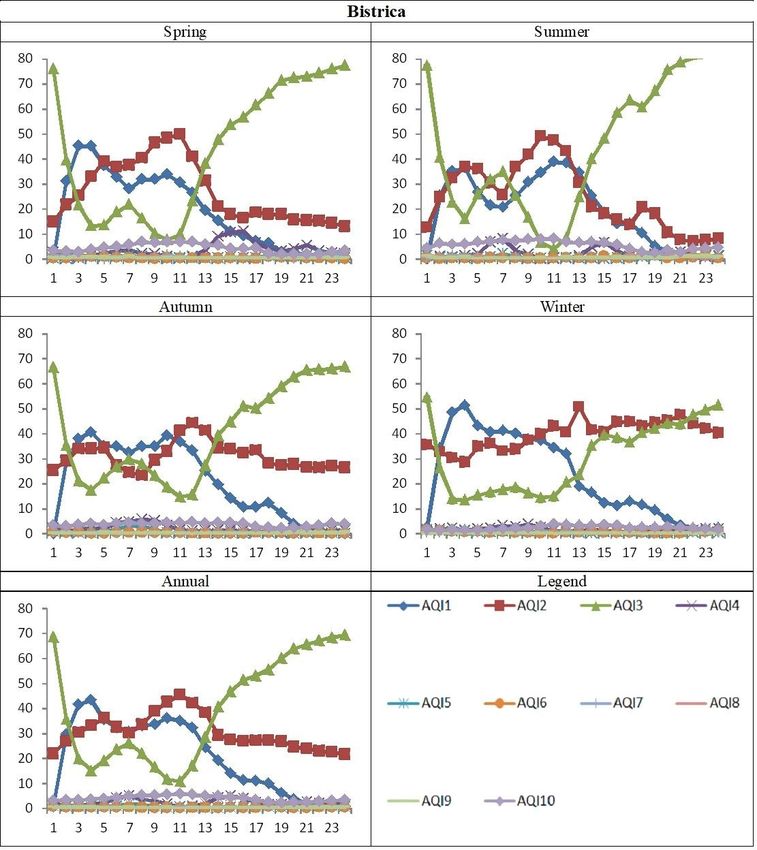
Preprints (www.preprints.org) | NOT PEER-REVIEWED | Posted: 16 June 2021                        doi:10.20944/preprints202106.0440.v1

                                                                                                                                    4 of 19

                                    Table 1. Boundaries Between Index Points for Each Pollutant.

                                                            O3                    NO2                   SO2                PM10
                                     INDEX
                                                          µg/m    3               µg/m    3            µg/m    3           µg/m3
                                        1                  0-32                    0-95                 0-88                0-21
                                        2                 33-66                  96-190                89-176              22-42
                                        3                 67-99                  191-286              177-265              43-64
                                        4                100-126                 287-381              266-354              65-74
                                        5                127-152                 382-477              355-442              75-86
                                        6                153-179                 478-572              443-531              87-96
                                        7                180-239                 573-635              532-708              97-107
                                        8                240-299                 636-700              709-886             108-118
                                        9                300-359                 701-763              887-1063            119-129
                                        10                > 360                   > 764                > 1064              > 130

                                         Each of the AQI bands comes with advice for at-risk groups and the general popu-
                                    lation. The reference levels and Health Descriptor used are based on health-protection
                                    related limit, target, or guideline values set by the EU, at a national or local level, or by
                                    the WHO [1].

                                    Table 2. Air Quality Indexes and health effect description.

                                     Banding     Value                                    Health Descriptor

                                                           Effects are unlikely to be noticed even by individuals who know they are
                                      Low         1–3
                                                                                    sensitive to air pollutants

                                                           Mild effects, unlikely to require action, may be noticed amongst sensitive
                                    Moderate      4–6
                                                                                           individuals.

                                                            Significant effects may be noticed by sensitive individuals and action to
                                      High        7–9        avoid or reduce these effects may be needed. Asthmatics will find that
                                                                their 'reliever' inhaler is likely to reverse the effects on the lung.

                                      Very                  The effects on sensitive individuals described for 'High' levels of pollu-
                                                   10
                                      High                                                  tion may

                                          The spatial and temporal behavior of the air quality index for the city of Sofia is de-
                                    fined as all simulations are presented as the sum of each index in each band - Low,
                                    Moderate, High, and Very High. In the "Low" band, the air is the cleanest, which means
                                    that high values in the fields with the frequency of days with a given air quality index
                                    show more cases with clean air, and low values mean fewer cases with clean air, respec-
                                    tively more cases with polluted air. In the other Moderate, High, and Very High catego-
                                    ries, high values indicate more cases with polluted air, and low - more cases with clean
                                    air.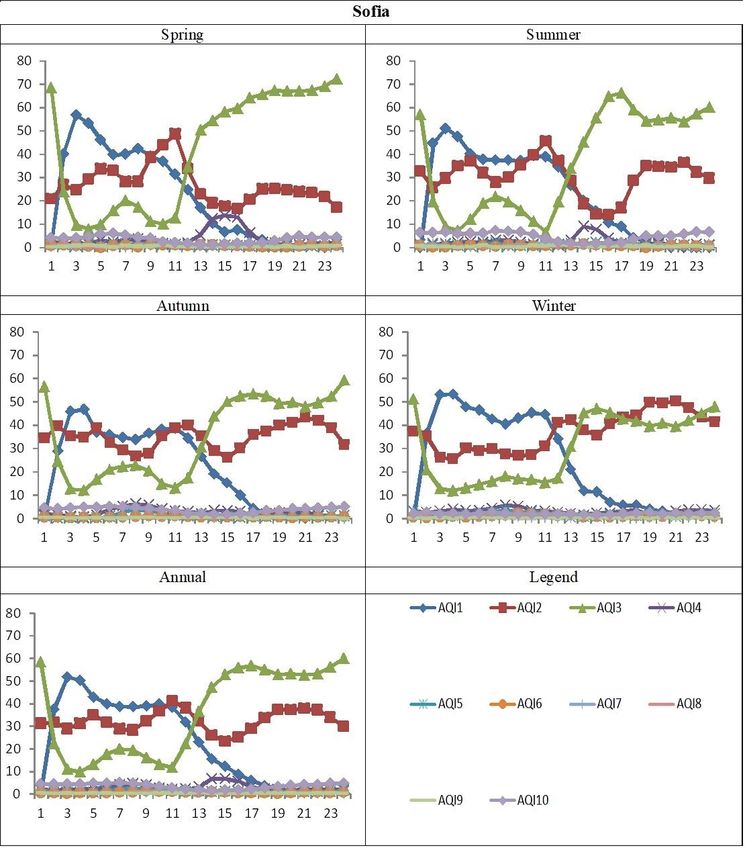
Preprints (www.preprints.org) | NOT PEER-REVIEWED | Posted: 16 June 2021                        doi:10.20944/preprints202106.0440.v1

                                                                                                                                   5 of 19

                                         The heat index is defined as the temperature a human individual in a real environ-
                                    ment would feel in a reference one having certain values of the effective wind speed,
                                    vapor pressure, and barometric pressure, as well as zero extra radiation [26]. The heat
                                    index is composed of a multiple regression formula, valid in air temperatures at least
                                    26.6˚C and relative humidity above 40 %. The results of the heat index (HI) are split for
                                    the spring, summer, and autumn, because of the possibility of hot conditions even in the
                                    transition seasons. It is in temperature units. It is calculated and presented in categories
                                    shown in table 3. Because of the possibility that the values for Danger and Extreme
                                    Danger conditions are combined in one category – “Danger”. It is calculated according to
                                    the [25-27] with regression formula:

                                         HI = - 42.379 + 2.04901523 *T + 10.14333127 * RH – 0.22475541 * T * RH
                                              - 0.00683783 * T2 – 0.05481717 * RH2 + 0.00122874 * T2 * RH
                                              + 0.00085282 * T * RH2 – 0.00000199 * T2 * RH2

                                    If the air temperature is below 26.6 °C and the relative humidity is below 40%, we use the
                                    air temperature as a heat index. The wind chill index [28] is studied for winter, spring and
                                    autumn, because these are the times when it is possible for his categories to observe. It is
                                    reported in temperature units and is used as a wind chill temperature (WCT) with cate-
                                    gories given in Table 4 [29]. The categories Very High Risk, Severe Risk, and Extreme Risk
                                    are combined in one category – “Very High Risk” for the same reasons as in for the Dan-
                                    ger and Extreme Danger heat index.

                                    Table 3. Heat index categories and health effects.

                                          Heat Index Category               Numerical interval               Health Precautions
                                                                                                           Fatigue is possible with
                                                                                                          prolonged exposure and
                                                Caution                       26.7˚C ÷ 32.2˚C
                                                                                                         activity. Continuing activity
                                                                                                         could result in heat cramps.

                                                                                                            Heat cramps and heat
                                                                                                           exhaustion are possible.
                                            Extreme Caution                   32.2˚C ÷ 40.5˚C
                                                                                                       Continuing activity could result
                                                                                                                in heat stroke.

                                                                                                            Heat cramps and heat
                                                                                                         exhaustion are likely; heat
                                                Danger                        40.5˚C ÷ 54.4˚C
                                                                                                           stroke is probable with
                                                                                                              continued activity
                                            Extreme Danger                       >= 54.4˚C                 Heat stroke is imminent

                                    The second index is the wind chill index, which categorizes the feeling and health con-
                                    sequences of the wind cooling power in cold weather. It is defined in temperatures lower
                                    than or equal to 4.4˚C and wind speeds at least 1.34 m/s. The wind chill index is calculated
                                    with the formula [28]: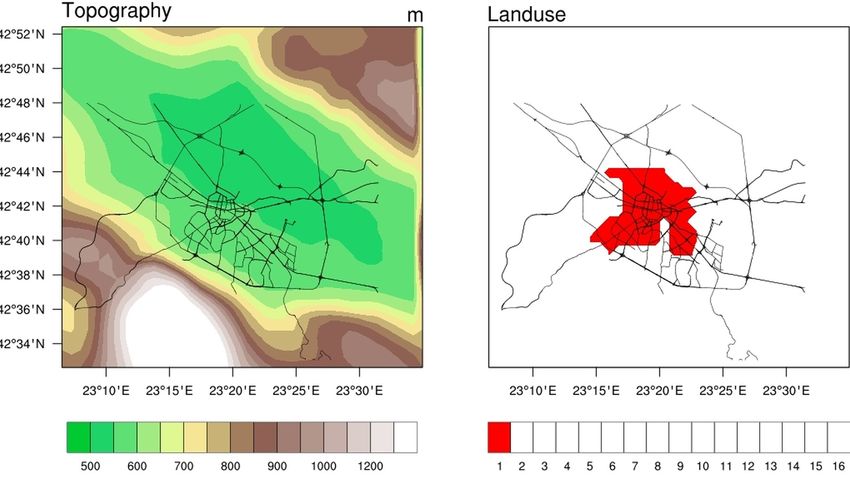
Preprints (www.preprints.org) | NOT PEER-REVIEWED | Posted: 16 June 2021                        doi:10.20944/preprints202106.0440.v1

                                                                                                                                  6 of 19

                                    WCT = 13.12 + 0.6215 * Tα – 11.37 * V 0.16 + 0.3965* Tα * V 0.16

                                    The Ta is the air temperatures in degrees Celsius, and the V is the wind speed in km/h. It is
                                    valid for temperatures below 4.4°C and wind speed equal to or above 1.34 m/s. If the
                                    values of the air temperature and wind speed are outside the valid intervals, the air
                                    temperature, we accept that the WCT is equal to the air temperature.

                                    Table 4. Wind chill index categories and health effects.
                                          Wind chill Category                Numerical interval              Health Precautions
                                                Light Risk                         0 ÷ -9˚C             Slight increase in discomfort.
                                                                                                       High risk of frostnip or frostbite.
                                                                                                       Exposed skin can freeze in 10 to
                                                                                                            30min; Check face and
                                                                                                         extremities for numbness or
                                                High Risk                       -28˚C ÷ -39˚C               whiteness; High risk of
                                                                                                       hypothermia if outside for long
                                                                                                          periods without adequate
                                                                                                        clothing or shelter from wind
                                                                                                                   and cold.
                                                                                                          Very high risk of frostbite;
                                                                                                        Exposed skin can freeze in 5 to
                                                                                                            10 min; Check face and
                                                                                                         extremities for numbness or
                                             Very High Risk                      -40˚ ÷ -47˚C            whiteness; Very high risk of
                                                                                                       hypothermia if outside for long
                                                                                                          periods without adequate
                                                                                                        clothing or shelter from wind
                                                                                                                   and cold.
                                                                                                       Severe risk of frostbite; Exposed
                                                                                                         skin can freeze in 2 to 5 min;
                                                                                                          Check face and extremities
                                                                                                         frequently for numbness or
                                               Severe Risk                       -48˚ ÷ -54˚C              whiteness; Severe risk of
                                                                                                       hypothermia if outside for long
                                                                                                          periods without adequate
                                                                                                        clothing or shelter from wind
                                                                                                                   and cold.
                                                                                                         DANGER! Exposed skin can
                                                                                                           freeze in less than 2min;
                                              Extreme Risk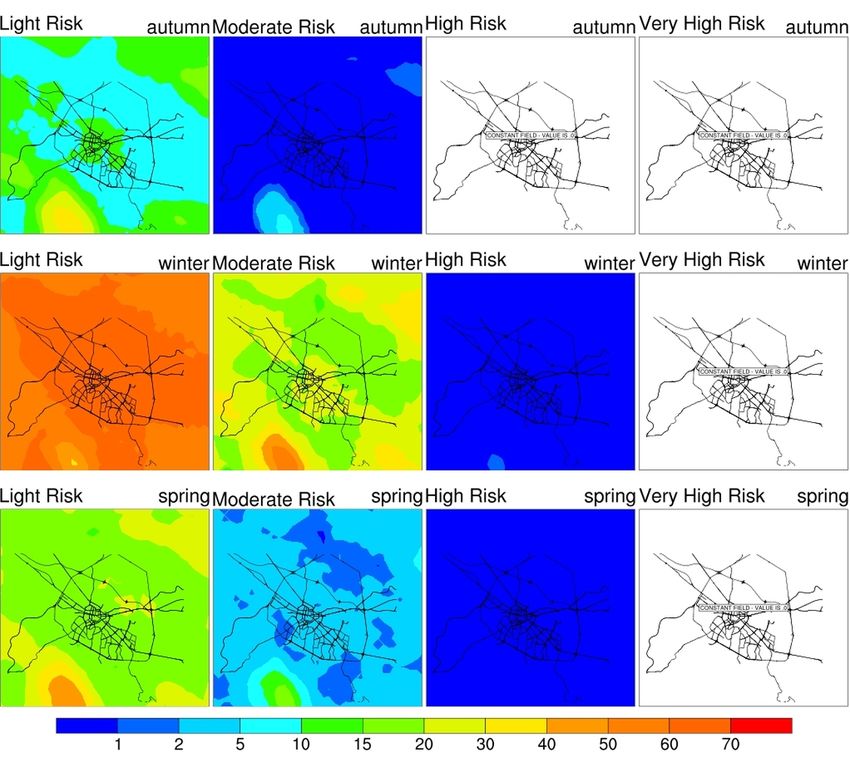
Preprints (www.preprints.org) | NOT PEER-REVIEWED | Posted: 16 June 2021 doi:10.20944/preprints202106.0440.v1
7 of 19
3. Results
3.1. Air Quality Indexes
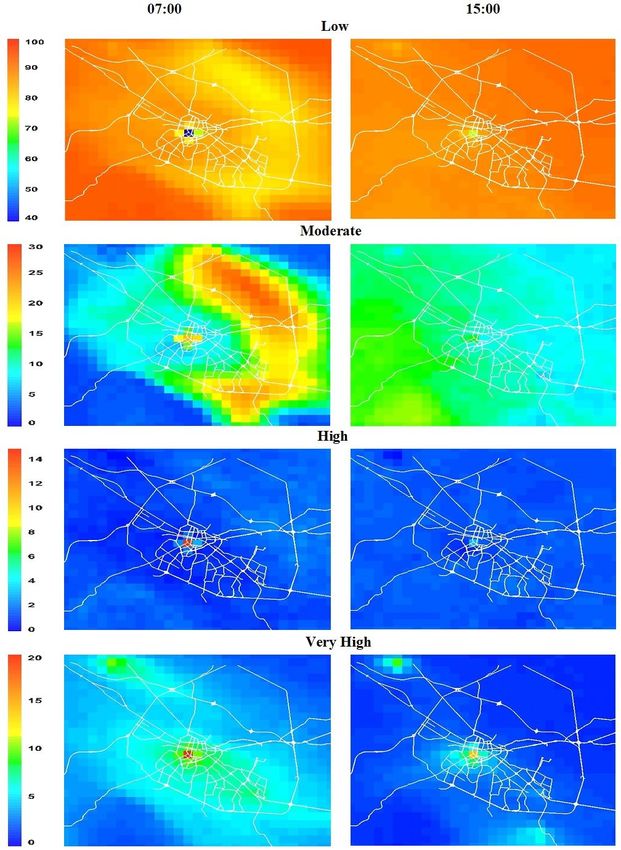
Annually averaged fields of recurrence of days with a certain air quality index are
presented in Figure 1. In the category "Low", the areas with a low air quality index are
mainly the city's ring road and busier transport routes, as well as the central parts, the
most in morning hours. It is also observed in the band "Moderate", early in the morning
with about 20-30% recurrence of days with polluted air. In the afternoon in this category,
there is pollution over Vitosha Mountain, which is probably due to the turbulent
transport of ozone from higher levels in a turbulent atmosphere. The ozone in Bulgaria is
largely due to transport from abroad. This is one of the reasons, together with the ozone
photochemistry reactions, why the ozone concentrations early in the morning are smaller
than at noon (less intensive transport from higher levels) [34-36].
Figure 1. Annual recurrences [in %] of the AQI for the band Low, Moderate, High and Very High
for the territory of Sofia city.
The graphs present the diurnal course and seasonal distribution of the average re-
currences in [%] for the different pollution indices (from 1 to 10) for the territory of Sofia
(Figure 2), as well as for different selected points of the city – Orlov Most (the city center)
and Bistrica (a village in the surroundings of Sofia) (Figure 3, Figure 4).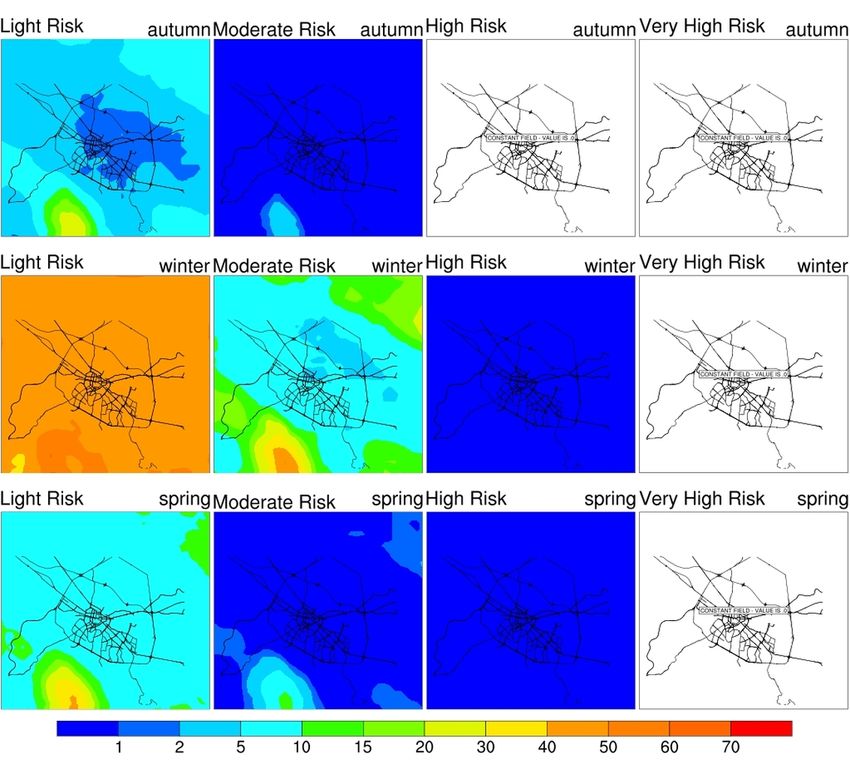
Preprints (www.preprints.org) | NOT PEER-REVIEWED | Posted: 16 June 2021                         doi:10.20944/preprints202106.0440.v1

                                                                                                                                     8 of 19

                                         Figure 2 shows that the indices AQI1, AQI2, AQI3, which fall in the band "Low",
                                    have the highest recurrence during the different seasons. The diurnal course of these in-
                                    dices is well defined. In the morning, AQI1, AQI2 have a recurrence of about 40-50%, and
                                    at that time, AQI3 has a minimum recurrence. In spring and summer, in the afternoon,
                                    AQI4 has a peak with a recurrence of about 10%. In all seasons, AQI10 stands out, which
                                    corresponds to the category "Very High" with about 5% repeatability. The other indices
                                    have an insignificant recurrence.

                                    Figure 2. Average recurrence [in %] of the different indices (from 1 to 10) for the territory of the city
                                    of Sofia.

                                          Figure 3 for the Orlov Most point shows that the indexes AQI1, AQI2, AQI3, which
                                    fall in the interval "Low", have the greatest recurrence during the different seasons. The
                                    diurnal course of these indices is well defined. In the morning, AQI1, AQI2 have a re-
                                    currence of about 40%, and in the afternoon, it drops to about 20%. At this time, AQI3 has
                                    a minimum recurrence in the morning and a maximum in the afternoon of about 50%.
                                    AQI4 has an afternoon maximum of about 10% in spring and summer. In all seasons,
                                    AQI10 stands out, which corresponds to the category "Very High" and, for this point, has
                                    a high repeatability of about 10 %.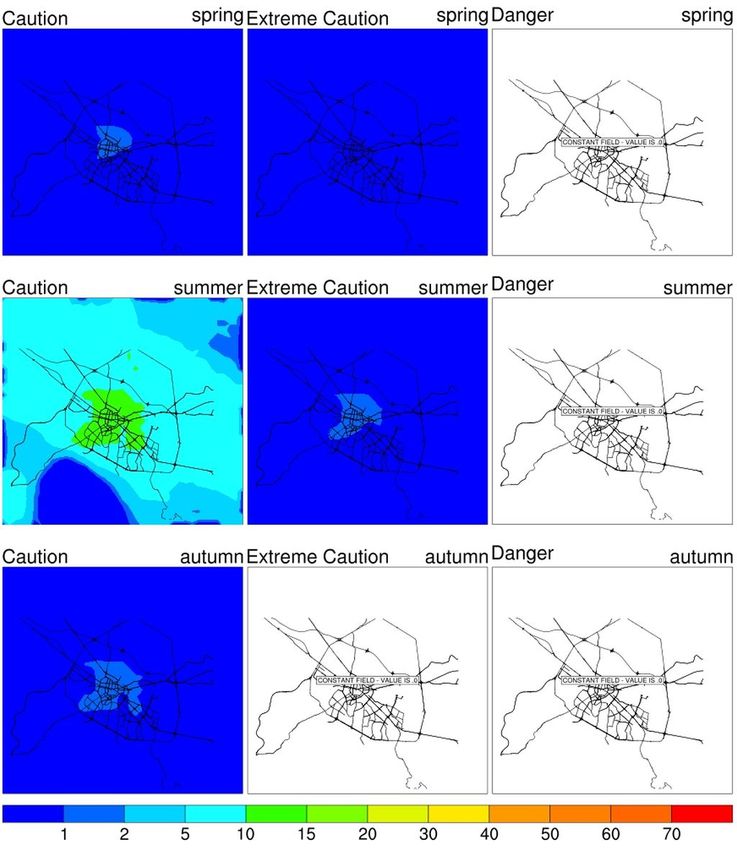
Preprints (www.preprints.org) | NOT PEER-REVIEWED | Posted: 16 June 2021                       doi:10.20944/preprints202106.0440.v1

                                                                                                                                   9 of 19

                                    Figure 3. Average recurrence [in %] of the different indices (from 1 to 10) for the Orlov Most (Sofia).

                                         Figure 4 for the Bistritsa point shows that the indexes AQI1, AQI2, AQI3, which fall
                                    in the interval "Low", have the greatest recurrence during the different seasons. The di-
                                    urnal course of these indices is well defined. In the morning, AQI1, AQI2 have a recur-
                                    rence of about 40%, and in the afternoon, it drops to about 20% during the warm months
                                    and back distribution during the cold months. At this time, AQI3 has a minimum recur-
                                    rence in the morning and a maximum in the afternoon of about 50%. AQI4 has an after-
                                    noon high of about 10% in the spring. In all seasons, AQI10 stands out, which corre-
                                    sponds to the category "Very High" and for this point, has a recurrence of about 5% in the
                                    morning in all seasons.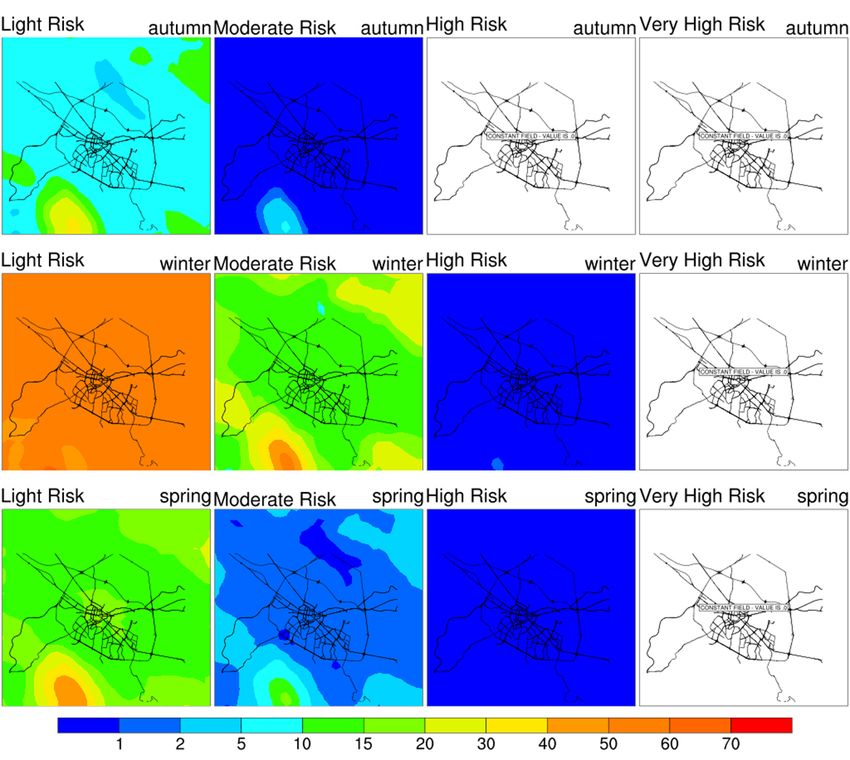
Preprints (www.preprints.org) | NOT PEER-REVIEWED | Posted: 16 June 2021                        doi:10.20944/preprints202106.0440.v1

                                                                                                                                    10 of 19

                                    Figure 4. Average recurrence [in %] of the different indices (from 1 to 10) for the Bistrica.

                                    3.2. Bio-climatic indexes
                                         The simulation results show that the distribution of the frequency of different HI
                                    categories is more diverse only in summer (Figure 6). The Caution cases were mostly
                                    between 0 % and 1 % and 1 % to 2 % in part of the more populated city area. There was no
                                    Extreme Caution in the autumn. That season, however, is characterized by more areas
                                    with Caution cases between 1% and 2 %. The summer cases of Caution conditions are
                                    much more and with a more complex distribution. The central city parts had 10 % to 15
                                    %. The percentages are between 5 and 10 in the other territories of the city limits and So-
                                    fia Valley as a whole and decrease with increasing the altitude. The spatial distribution of
                                    the Extreme Caution conditions on that season is more homogeneous, similar to the
                                    spring and autumn ones. There are no cases of Danger and Extreme Danger conditions
                                    over the three seasons, and the Extreme Caution conditions absent in autumn. Therefore,
                                    the weather was not as extreme in the autumn as in the spring.
Preprints (www.preprints.org) | NOT PEER-REVIEWED | Posted: 16 June 2021 doi:10.20944/preprints202106.0440.v1
11 of 19
Figure 5. Domain elevation (left figure) and Land cover (right figure). The red color in the land
cover figure is the urbanized land cover.
Figure 6. Frequency [in %] of the Heat index categories in the Sofia region during the spring (first
row), summer (second row) and autumn (third row).Preprints (www.preprints.org) | NOT PEER-REVIEWED | Posted: 16 June 2021 doi:10.20944/preprints202106.0440.v1
12 of 19
The simulated wind chill categories over the winter and spring are Light Risk,
Moderate Risk, and High Risk, and only Light Risk and Moderate Risk in the autumn
(Figure 7). There were 5% to 10% of cases with Light Risk in most of the domain, and in-
creasing up to 40 % in higher altitudes. The winter Moderate Risk cases were mostly
between 1 and 2%, up to 10% in the Vitosha Mountain. The winter Light Risk percentages
were from 50 to 60, with some spots below 50 %. The Moderate Risk cases follow the
terrain height with 10% to 15% in the Sofia Valley, increasing up to 30% in the mountain
areas and 50% at Vitosha Mountain. The spatial distribution of the percentages with
Light Risk during the spring has almost the same pattern. The Moderate Risk cases in
spring also follow the terrain height. The percentages are between 1% and 2% in the Sofia
Valley, increases to 5% in higher altitudes and 20% in the Vitosha Mountain. The autumn
Moderate Risk is up to 1%, except in Vitosha Mountain. There are High Risk cases only in
winter and spring.
Figure 7. Frequency [in %] of the Wind chill categories in the Sofia region during the spring (first
row), summer (second row) and autumn (third row).
Usually, the air temperatures in the warm and cool seasons are highest in or after-
noon, which draws our interest to study the frequency of the HI categories at 12 UTC (14
EET or 15 EEST). Their spatial distribution, shown in Figure 8, implies the following in-
ferences. The summer, as the hottest season, has the highest number of Caution cases and
is the only one with Extreme Caution cases. The frequency of Caution conditions is up to
20% in the mountain areas, between 20% and 30% in the Sofia Valley, and between 40%
and 50% in most of the Sofia city limits. The Extreme Caution category is presented only
during that season with below 1% in most of the domain to the 5% to 10% in the morePreprints (www.preprints.org) | NOT PEER-REVIEWED | Posted: 16 June 2021 doi:10.20944/preprints202106.0440.v1
13 of 19
populated area of the city. The autumn percentages are between 5% and 10% in the cen-
tral city parts, from 2% to 5% in the outer ones and below 2% in the mountainous areas.
The spatial distribution during the spring is kind of similar, but the percentages are
smaller with 1% to 5%.
Figure 8. Frequency [in %] of the Heat index categories “Caution” (first column), “Extreme caution”
(second column) and “Danger” (third column) in the Sofia region at 12 UTC during the spring (first
row), summer (second row) and autumn (third row).
The human’s daily life regime implies that it is interesting to study the wind chill
index during the early morning and evening hours. The simulated WCT categories at 06
UTC are presented in Figure 9. Only the first two categories are presented in the autumn.
The percentages of Light Risk are between 10% and 15% in the central city and mountain
areas. The Sofia Valley ones are smaller with 5% to 10%. The Moderate Risk conditions
are bigger than 1% only at Vitosha Mountain. The winter Light Risk percentages are from
50% to 70%, higher in the Sofia Valley. The Moderate Risk conditions on that season are
between 20% and 30% in the part of the city limits and mountain areas, lower in the other
parts of Sofia Valley. Vitosha Mountain, as the highest terrain, is above 50%. The spring
Light Risk frequency distribution is similar to the winter Moderate Risk, but the per-Preprints (www.preprints.org) | NOT PEER-REVIEWED | Posted: 16 June 2021 doi:10.20944/preprints202106.0440.v1
14 of 19
centages are about 5% smaller, and there are only three little city spots with higher ones.
The spring Moderate Risk percentages are 2% to 5% in most of the domains, except Vi-
tosha Mountain and some places around the city. The winter and spring Moderate Risk
conditions are below 1%.
Figure 9. Frequency [in %] of the Wind-chill index categories “Low risk” (first column), “Moderate
risk” (second column) and “High risk” (third column) in the Sofia region at 06 UTC during the au-
tumn (first row), winter (second row) and spring (third row).
The spatial distribution of the frequencies of the wind chill categories at 15 UTC is
shown in figure 10. The Light Risk conditions in the three seasons are smaller than the
ones in the 06 UTC. The autumn Light Risk frequencies are between 1% and 2% in most
areas of the city limits, increase to between 2% and 5% in the Sofia Valley, and higher in
the mountain areas. The winter percentages are mostly between 40 and 50, and the spring
ones between 5% and 10%, except in the Vitosha Mountain. The Moderate Risk during
the transition seasons is mostly below 1% and up to 15% at Vitosha Mountain. The winter
ones are 2% to 10% in the Sofia Valley and higher in the higher altitudes around, espe-
cially at the Vitosha mountain, where they reach up to 50%. The High Risk cases are
simulated only in winter and spring.Preprints (www.preprints.org) | NOT PEER-REVIEWED | Posted: 16 June 2021 doi:10.20944/preprints202106.0440.v1
15 of 19
Figure 10. Frequency [in %] of the Wind-chill index categories “Low risk” (first column), “Moderate
risk” (second column) and “High risk” (third column) in the Sofia region at 15 UTC during the au-
tumn (first row), winter (second row) and spring (third row).
4. Discussion
The Sofia city simulations show that Sofia's air quality status is not so good (evalu-
ated with a spatial resolution of 1km). AQI status falls mostly in Low and Moderate
bands, but the recurrence of cases with High pollution is close to 10%, mostly at the city
center. The recurrence of indices AQI2 and AQ3 (Low range) is different during the day,
and it reaches 40% over the whole city territory. The recurrence of AQI2 is about 40% in
the morning hours and cold months and about 50% at noon and afternoon. AQI3 high
recurrence can be seen in afternoon hours, about 60% in hot months, and 20% in cold
months. The AQI4 has a high recurrence at noon. The cases with bad AQ reach 10% over
the selected points. The AQI10, which presents the Very High band, shows recurrence of
about 5%-10% during the whole day, all seasons, and for all points.
The pollution in the city is probably due to the surface sources like road transport
and the TPPs in the city. Apart from these general features, the climatic behavior of the
AQI probabilities is rather complex, with significant spatial, seasonal, and diurnal varia-
bility. The areas with slightly worse AQ status are not necessarily linked to the big pol-
lution sources. Wide rural and even mountain regions can also have a significant proba-
bility for AQI from the Moderate range.
The hot spot in Sofia city, where the high-value indices are with higher recurrence, is in
the city center. The Very High band recurrence is relatively high - about 10%, especially
in cold months, where the atmosphere is usually stable and the turbulence transport of
pollution aloft is hampered.Preprints (www.preprints.org) | NOT PEER-REVIEWED | Posted: 16 June 2021 doi:10.20944/preprints202106.0440.v1
16 of 19
Generally, the adverse heat conditions in the Sofia city region reach up to 15% of the
cases. The summer frequency of conditions for fatigue decreases gradually with in-
creasing altitude from the city center to the Sofia Valley and mountain areas. On the other
hand, the transition seasons simulations show a more homogeneous distribution of the
possibility for that health effect, with more cases in the most urbanized parts (Figure 5).
The possibility for heat cramps and heat exhaustion is higher, mainly in the city during
the summer. The spatial distributions for 12 UTC are more complex, and the differences
between the lower and higher altitudes are more emphasized, possibly due to the higher
temperatures at that time. The higher frequencies for fatigue, heat cramps, and heat ex-
haustion in the urban territories (Figure 5), in comparison to the other ones, are also more
pronounced. Generally, the results from the simulation show higher frequencies in the
most urbanized territories (Figure 5) and lower ones in higher altitudes.
The winter slight discomfort is almost the same in the whole domain. It changes
with the elevation (Figure 5) in the transitions seasons, with higher frequency in the
higher altitude areas. The risk of hypothermia in winter and spring also shows the in-
creasing frequency with altitude. The risk of hypothermia during the autumn, as well as
the risk of freezing in the winter and spring, are almost in the same frequency interval.
The slight discomfort conditions in the 06 UTC show a little more complex picture, ex-
pressing a higher similarity with the changing of the elevation (Figure 5). The spatial
distribution of the frequency of the risk of hypothermia, however, shows an opposite
behavior – the distribution in 06 UTC is not so complex and similar to the elevation
changes (Figure 5) as the whole one. The wind chill severity is highest in the 06 UTC than
in the 15 UTC.
5. Conclusions
The areas with a low and partly with moderate air quality index are mainly the city's
ring road and busier transport routes, as well as the central parts, the most in morning
hours. The Moderate pollution in the afternoon over Vitosha Mountain is probably due
to the turbulent transport of ozone from higher levels in a turbulent atmosphere. The air
quality index bands for locations in Sofia city and Bistritsa with the greatest contribution
recurrence are AQI1, AQI2, and AQI3. The AQI3 index recurrence has maximum in the
afternoon hours in spring and summer, and in the morning ones for other seasons and
annually. The AQI1 and AQI2 recurrence are higher in the morning hours.
We suggest that at least two factors could play a role in these features of the
bio-climatic indexes. The first one is the normal changing of the temperatures with the
changes in altitude. The second one is the urban heat island effect, manifested as higher
temperatures in the urban area (Figure 5) than in the rural and suburban ones, due to the
higher absorption and re-emitting radiation because of smaller green and water body
areas. The conditions of slight windchill discomfort and risk of hypothermia during 2008
– 2014 for transition seasons and winter increase its frequencies in mountainous areas.
Still, it is not always valid for the city limits and the Sofia Valley.
Author Contributions: Conceptualization, G.G. and K.G.; methodology, K.G.; software, G.G.;
validation, G.G. and K.G..; formal analysis, K.G.; investigation, K.G.; resources, G.G.; data curation,
G.G.; writing—original draft preparation, K.G.; writing—review and editing, K.G.; visualization,
G.G.; supervision, K.G.; project administration, G.G.; funding acquisition, K.G. All authors have
read and agreed to the published version of the manuscript.
Funding: This work has been accomplished with the financial support by the Grant No
BG05M2OP001-1.001-0003, financed by the Science and Education for Smart Growth Operational
Program (2014-2020) and co-financed by the European Union through the European structural and
Investment funds.
This work has been carried out in the framework of the National Science Program "Environmental
Protection and Reduction of Risks of Adverse Events and Natural Disasters", approved by thePreprints (www.preprints.org) | NOT PEER-REVIEWED | Posted: 16 June 2021 doi:10.20944/preprints202106.0440.v1
17 of 19
Resolution of the Council of Ministers № 577/17.08.2018 and supported by the Ministry of Educa-
tion and Science (MES) of Bulgaria (Agreement № Д01-363/17.12.2020).
Institutional Review Board Statement: Not applicable.
Informed Consent Statement: Not applicable.
Acknowledgments: Deep gratitude to the organizations and institutes (TNO, NCEP/NCAR,
ECA&D, Unidata, MPI-M and all others), which provide free of charge software and data. Without
their innovative data services and tools this study would not be possible.
Conflicts of Interest: The authors declare no conflict of interest. The funders had no role in the
design of the study; in the collection, analyses, or interpretation of data; in the writing of the man-
uscript, or in the decision to publish the results.
References
1. World Health Organization (WHO), Health Aspects of Air Pollution. Results from the WHO Project Systematic Review of
Health Aspects of Air Pollution in Europe, 2004.
2. Fact Sheet Number 187, World Health Organization (WHO), 2000
3. European Parliament Directive 2002/3/EC of 12 February 2002 relating to ozone in ambient air, Official Journal of the Euro-
pean Communities (9.3.2002) L 67, 14-30.
4. European Parliament: Directive 2008/50/EC of the European Parliament and of the Council of 21 May 2008 on ambient air
quality and cleaner air for Europe, Official Journal of the European Union (11.6.2008), L 152, 1-44.
5. Brunekreef, B; Holgate, S. Air pollution and health., Lancet, 2002; 360, 1233-1242.
6. Katsouyanni K., Ambient air pollution and health, British Medical Bulletin 2003, 68, 1, 143–156,
https://doi.org/10.1093/bmb/ldg028
7. WHO Air quality guidelines for particulate matter, ozone, nitrogen dioxide and sulphur dioxide. Global Update 2005. Sum-
mary of risk assessment, WHO Regional Office for Europe, Copenhagen
8. Atkinson, R. W.; Yu, D.; Armstrong, B.; Pattenden, S.; Wilkinson, P.; Doherty, R.; Hea, MR.; Anderson, HR. Concentra-
tion–Response Function for Ozone and Daily Mortality: Results from Five Urban and Five Rural U.K. Populations, Environ
Health Perspect 2012, 120, 1411–1417
9. Nikiforov, B.; Antova, T.; Lolova, D. Health issues for the population in the town of Pleven related to ambient air pollution,
Problems of Hygiene 2002 ,3, 39-44 (Bulgarian)
10. Nikiforov, B.; Antova, T.; Lolova, D. Ambient air quality in the municipality of Rousse and public health risk, Problems of
Hygiene 2003, 1, 15-22 (Bulgarian)
11. Antova, T.; Nikiforov, B.; Lolova, D. Ambient air quality and health risk to the population of the town of Dobrich, Problems of
Hygiene 2002, 2, 27-32. (Bulgarian)
12. Pattenden, S. B.; Nikiforov, B.; Armstrong, B.G. Mortality and temperature in Sofia and London, J. Epidemiol. Community
Health 2003, 57, 628-633
13. Starr, C., McMillan, B. Human Biology. Publisher: Brooks/Cole Cengager Learning, 2010
14. Giles, B. D.; Balafoutis, C. H.; Maheras, P. Too hot for comfort: the heatwaves in Greece in 1987 and 1988. International Journal
of Biometeorology, 1990, 34, 98–104.
15. Stathopoulou, M.I.; Cartalis, C.; Keramitsoglou, I.; Santamouris, M. Thermal remote sensing of Thom’s Discomfort Index (DI):
comparison with in situ measurements. Proceedings of SPIE—The International Society for Optical Engineering 5983, art. no.
59830 K, 2005
16. Sajani Z. S.; Tibaldi, S.; Scotto, F.; Lauriola, P. Bioclimatic characterisation of an urban area: a case study in B logna (Italy).
International Journal of Biometeorology, 2008, 52, 779–785.
17. Da Silva, V. D. P. R.; De Azevedo, P. V.; Brito, R. S.; Da Cunha Campos, J. H. B. Evaluating the urban climate of a typically
tropical city of northeastern Brazil. Environmental Monitoring and Assessment 2010, 161, 45–59.
18. Fanger, P.O. Thermal comfort: analysis and applications in environmental engineering. McGraw-Hill (New York), 1972
19. Höppe, P. Die Thermische Komponente der Stadtklimas. Wiss Mitt Meteorol Inst Univ München 1986, 53, 94–108
20. Matzarakis, A.; Mayer, H. The extreme heat wave in Athens in July 1987 from the point of view of human biometeorology.
Atmos Environ 1991, 25, 203–211.
21. Matzarakis, A.; Mayer, H. Heat stress in Greece. Int J Bio-meteorology 1997, 41, 34–39.
22. Höppe, P. The physiological equivalent temperature - a universal index for the biometeorological assessment of the thermal
environment. International Journal of Biometeorology 1999, 43, 71–75.
23. Matzarakis, A.; Rutz, F.; Mayer, H. Estimation and calculation of the mean radiant temperature within urban structures. In: R.
J. de Dear, J. D. Kalma, T. R. Oke and A. Auliciems (Eds.) Biometeorology and urban climatology at the turn of the millen-
nium. Selected Papers from the Conference ICB-ICUC’99, Sydney, WCASP-50, WMO/TD No. 1026, 2000, 273–278Preprints (www.preprints.org) | NOT PEER-REVIEWED | Posted: 16 June 2021 doi:10.20944/preprints202106.0440.v1
18 of 19
24. Matzarakis, A.; Rutz, F.; Mayer, H. Modelling radiation fluxes in simple and complex environments - application of the
RayMan model, Int. J.Biometeorol., 2007, 51, 323-334.
25. Rothfusz, L.P. NWS Technical Attachment (SR 90-23), 1990
26. Steadman, R. G. The assessment of sultriness, Part I: A temperature-humidity index based on human physiology and clothing
science. J. Appl. Meteorol., 1979, 18, 861-873
27. The NCAR Command Language (Version 6.6.2) [Software]. (2019). Boulder, Colorado: UCAR/NCAR/CISL/TDD.
28. Osczevski, R.; Bluestein, M. The new wind chill equivalent temperature chart Bulletin of the American Meteorological Society
2005, 86, 1453-1458.
29. Wind chill index. Accessed 20 May 2019,
https://www.canada.ca/en/environment-climate-change/services/weather-health/wind-chill-cold-weather/wind-chill-index.
html
30. Ivanov, V.; Evtimov, S. Heat Risks in Bulgaria during 2003-2012 period. Bulgarian Geophysical Journal 2014, 40, 3-13.
31. Ivanov, V.; Evtimov, S. Wind chill hazard in Bulgaria during 2003-2012 period. Comptes Rendus De L'Academie Bulgare Des
Sciences 2014, 67, 1521-1530.
32. Ivanov, V.; Chervenkov, H. Modelling human biometeorological conditions using meteorological data from reanalysis and
objective Analysis—Preliminary results. Studies in Computational Intelligence 2021, 961 SCI, 170 – 181
33. Chervenkov H., Slavov K., Ivanov V. STARDEX and ETCCDI Climate Indices Based on E-OBS and CARPATCLIM. Nu-
merical Methods and Applications. NMA 2018. Lecture Notes in Computer Science 2019, 11189.
34. Georgieva, I.; Ivanov, V. Computer simulations of the impact of air pollution on the quality of life and health risks in Bul-
garia. International Journal of Environment and Pollution 2018, 64, 35-46.
35. Ivanov, V.; Georgieva, I. Air quality index evaluations for sofia city. In 17th IEEE International Conference on Smart Tech-
nologies, Proceedings of EUROCON 2017, Ohrid, North Macedonia, 2017
36. Georgieva, I.; Ivanov, V. Impact of the air pollution on the quality of life and health risks in Bulgaria. In HARMO 2017, Pro-
ceedings of 18th International Conference on Harmonisation within Atmospheric Dispersion Modelling for Regulatory
Purposes, Proceedings, 2017
37. Georgieva I.; Gadzhev G.; Ganev K.; Prodanova M.; Syrakov D.; Miloshev N., Numerical study of the air quality in the city of
Sofia – some preliminary results, International Journal of Environment and pollution 2015, 57, 162-174.
38. Georgieva, I.; Gadzhev, G.; Ganev, K.; Prodanova, M.; Syrakov, D.; Miloshev, N., Numerical study of the Air Quality in the
city of Sofia, 8th Congress of the Balkan Geophysical Society 2015, BGS 2015
39. Georgieva, I.; Gadzhev, G.; Ganev, K.; Prodanova, M.; Syrakov, D.; Miloshev, N., Numerical study of the air quality in the city
of Sofia - Some preliminary results, HARMO 2014 - 16th International Conference on Harmonisation within Atmospheric
Dispersion Modelling for Regulatory Purposes, Proceedings, 2014, 356-360.
40. Georgieva, I.; Gadzhev, G.; Ganev, K.; Melas, D.; Wang, T., HPC simulations of the atmospheric composition in Bulgaria and
the city of Sofia. Cybernetics and Information Technologies (CIT) 2017, 17, 37-48.
41. Georgieva, I.; Gadzhev, G.; Ganev, K.; Miloshev, N., Computer simulations of atmospheric composition in urban areas some
results for the city of Sofia., Proceedings of the Tenth International Conference on "Large Scale Scientific Computations",
LSSC2018, Sozopol, Bulgaria, June 5-9 2017, 2018, LNCS10665, 474–482.
42. Georgieva, I.; Gadzhev, G.; Ganev, K.; Miloshev, N., Analysis Of Dynamical And Chemical Processes Which Form Ath-
mospheric Composition Over Bulgaria, SGEM 2018, 2018, 18, 4.3
43. Georgieva, I.; Miloshev, N. Computer Simulations of PM Concentrations Climate for Bulgaria, International Conference on
"Numerical Methods for Scientific Computations and Advanced Applications", NMSCAA’18, 2018, 46-49.
44. Shamarock, W. C.; Klemp, J. B.; Dudhia, J.; Gill, D. O.; Barker, D. M.; Wang, W.; Powers, J. G., A Description of the Advanced
Research WRF Version 2 (No. NCAR/TN-468+STR), 2017, University Corporation for Atmospheric Research.
http://www.dtic.mil/dtic/tr/fulltext/u2/a487419.pdf
45. http://www.ftp.ncep.noaa.gov/data/nccf/com/gfs/prod/.
46. Byun, D.; Ching, J. Science Algorithms of the EPA Models-3 Community Multi-scale Air Quality (CMAQ) Modeling System.
1999, EPA Report 600/R-99/030, Washington, D.C., EPA/600/R-99/030 (NTIS PB2000-100561). https://cfpub.epa.gov/si/si
public record report.cfm?Lab=NERL&dirEntryId=63400
47. Byun, D. Dynamically Consistent Formulations in Meteorological and Air Quality Models for Multiscale Atmospheric Studies
part I: Governing equations in a generalized coordinate system. J. Atmos. Sci. 1999, 56, 3789-3807.
48. CEP: Sparse Matrix Operator Kernel Emission (SMOKE) Modeling System, 2003, University of Carolina, Carolina Environ-
mental Programs, Research Triangle Park, North Carolina.
49. Denier van der Gon, H.; Visschedijk, A.; van de Brugh, H.; Droge, R. A high resolution European emission data base for the
year 2005, 2010, TNO-report TNO-034-UT-2010-01895 RPT-ML, Apeldoorn, The Netherlands.
50. Hong, S.-Y.; Lim J.-O. J. The WRF Single-Moment 6-Class Microphysics Scheme (WSM6), J. Korean Meteor. Soc. 2006, 42,
129–151.
51. Collins, W. D. et al. Description of the NCAR Community Atmosphere Model (CAM 3.0), NCAR Technical Note,
NCAR/TN-464+STR 2004, 226.
52. Xiu, A.; Pleim J. E. Development of a land surface model part I: Application in a mesoscale meteorology model. J. Appl. Me-
teor. 2001 40, 192–209Preprints (www.preprints.org) | NOT PEER-REVIEWED | Posted: 16 June 2021 doi:10.20944/preprints202106.0440.v1
19 of 19
53. Pleim, J. E. A combined local and non-local closure model for the atmospheric boundary layer. Part 1: Model description and
testing, J. Appl. Meteor. and Clim. 2007, 46, 1383–1395.
54. Georgieva, I., Air Quality Index Evaluations for Bulgaria, Proc. of the international conference on numerical methods for
scientific computations and advanced applications, May 19-22, 2014, Bansko, 2014, 39-42.
55. de Leeuw, F.; Mol, W. Air Quality and Air Quality Indices: a world apart., 2005, ETC/ACC Technical Paper 2005/5
http://acm.eionet.europa.eu/docs/ETCACC TechnPaper 2005 5 AQ Indices.pdfYou can also read