Historic records and GIS applications for flood risk analysis in the Salento peninsula (southern Italy)
←
→
Page content transcription
If your browser does not render page correctly, please read the page content below
Natural Hazards and Earth System Sciences, 5, 833–844, 2005
SRef-ID: 1684-9981/nhess/2005-5-833                                                                  Natural Hazards
European Geosciences Union                                                                                 and Earth
© 2005 Author(s). This work is licensed                                                             System Sciences
under a Creative Commons License.

Historic records and GIS applications for flood risk analysis in the
Salento peninsula (southern Italy)
F. Forte1 , L. Pennetta1 , and R. O. Strobl2
1 Sezione di Geografia fisica e Geomorfologia – Dipartimento di Geologia e Geofisica, Università degli Studi di Bari, via E.
Orabona 4, 70125 Bari, Italy
2 ITC – International Institute for Geoinformation Science and Earth Observation, Hengelosestraat 99, 7514 AE Enschede,

The Netherlands
Received: 17 November 2004 – Revised: 13 October 2005 – Accepted: 19 October 2005 – Published: 2 November 2005

Abstract. The occurrence of calamitous meteoric events rep-          ing and emergency states to the population and economic ac-
resents a current problem of the Salento peninsula (Southern         tivity.
Italy). In fact, flash floods, generated by very intense rainfall,
occur not only in autumn and winter, but at the end of sum-          1.2   Geological and geomorphological settings
mer as well. These calamities are amplified by peculiar geo-
logical and geomorphological characteristics of Salento and          The Salento peninsula, the southeast portion of the Apulia
by the pollution of sinkholes. Floodings affect often large          region (southern Italy), covers 7000 km2 of area and stretches
areas, especially in the impermeable lowering zones. These           over 150 km between the Ionian and Adriatic seas (Fig. 1).
events cause warnings and emergency states, involving peo-           The peninsula includes two extreme geographical points: the
ple as well as socio-economic goods.                                 Punta Palascı̀a, near Capo d’Otranto and the Punta Rı̀stola,
   A methodical investigation based on the historic flood            near Capo S. Maria di Leuca, in the final strip of the Apulia
records and an analysis of the geoenvironmental factors have         region.
been performed, using a Geographic Information System                   Geologically, the substratum of the Salento peninsula is
(GIS) methodology for database processing in order to iden-          a carbonatic shelf, 6000 m thick, represented by limestone,
tify the distribution of areas with different risk degrees. The      dolomitic limestone and dolomite strata, originating from
data, referring to events that occurred from 1968 to 2004,           the Jurassic to the Upper Cretaceous (Maastrichtian) peri-
have been collected in a database, the so-called IPHAS               ods (Ricchetti, 1988; De Giorgi, 1884, 1922, 1960). In the
(Salento Alluvial PHenomena Inventory), extracted in an              lowering zones, there are impermeable mio-plio-pleistocenic
easily consultable table. The final goal is the development of       sediments with clay insertions which stand on limestone,
a risk map where the areas that are affected by floodings are        dolomitic limestone and dolomite (Ciaranfi et al., 1988;
included between small ridges, the so-called “Serre”. More           Largaiolli et al., 1969) (Fig. 2).
than 50% of the Salento peninsula shows high or very high               Morphologically, the Salento area is a flat area with eleva-
risk values. The numerous maps that were utilized and gen-           tions just above sea level. It is characterized by small ridges,
erated represent an important basis in order to quantify the         the so-called “Serre salentine”, extending in a SE-NW direc-
flood risk, according to the model using historic records.           tion (Martinis, 1962, 1967a, b, 1970). They had originated
                                                                     by tectonic stresses acting during the Cretaceous period until
                                                                     the Upper Pleistocene period, mainly along SSE-NNW and
                                                                     SSW-NNE directions, resulting in slopes of normal fault and,
1 Introduction                                                       therefore, Horst and Graben structures (Battista et al., 1985)
                                                                     (Fig. 3).
1.1   Foreward                                                          The landforms described represent the main aspect of
                                                                     “Terra d’Otranto”, but not the only one: in fact, also the rain-
This paper has been extracted from a PhD thesis submitted            fall effects and karstic phenomena are easily recognizable in
in the Department of Geology and Geophysics of Bari Uni-             this landscape.
versity and deals with flood phenomena which occur periodi-             Furthermore, on the Salento peninsula two kinds of
cally in the Salento peninsula (southern Italy), causing warn-       streams can be distinguished: on the one hand, an endoreic
                                                                     type, which is comprised by relatively wider canals and on
Correspondence to: F. Forte                                          the other hand, an exoreic one, which is represented by small
(geoforte@libero.it)                                                 canals, but hierarchized (Battista et al., 1985). The endoreic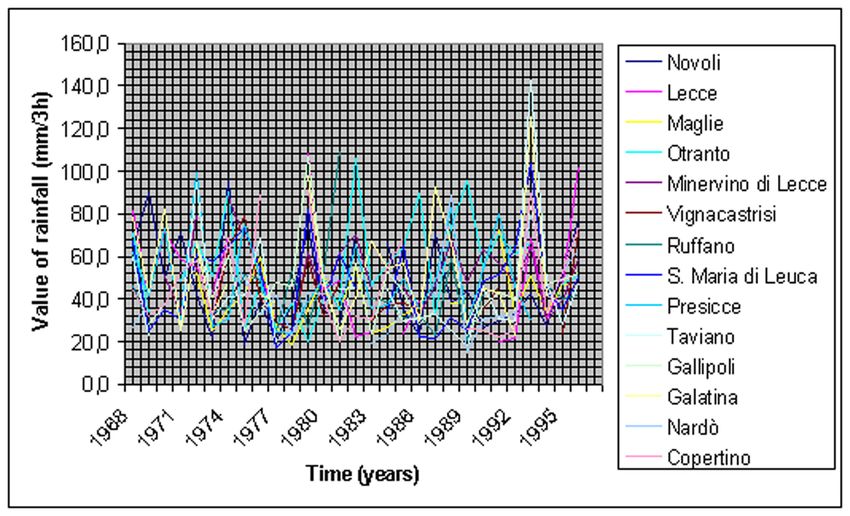
834                                                 F. Forte et al.: Historic records and GIS applications for flood risk analysis

Fig. 1. Municipal limits.

                                                                  Fig. 3. DTM (Digital Terrain Model) of Salento peninsula from the
                                                                  isolines of 1956.

Fig. 2. Geolithological map of Salento peninsula.

network, represented by canals, the so - called “Asso” canals,
is asymmetric and aligned along a SSE-NNW direction. It is
converging towards a natural karstic sinkhole, the so - called
“Vora Colucci”, near Leverano municipality. The channels
in the exoreic network, in turn, are in many places deep and
located in the coastal zone. This network is conditioned by
tectonic stresses. Numerous small valleys are parallel to each
other, but perpendicular to the coastline (Fig. 4).
   These peculiar geological and morpho-structural charac-
teristics make some areas of the Salento peninsula suscepti-
ble to floodings, mainly when the rainfall is very intense.       Fig. 4. Location of karstic sinkholes, wellpoints and main drainage
                                                                  canals.
1.3   The rainfall distribution on the Salento peninsula

Rainfalls that are very intense but short are the main cause      part of Salento, where 790 mm/year of rainfall are registered
of flood occurrences. Generally, the climate of the Salento       on average. On the other hand, low values of mean annual
peninsula can be defined as “Mediterranean”. The rainfall is      rainfall are concentrated (590 mm/year) in the western part
not homogeneous, so that areas with different rainfall distri-    (Fig. 5). Figure 5 was obtained by an interpolation method
butions can be recognized in the Salento peninsula. This con-     in a GIS (Geographic Information System) software and de-
cept has been exposed already by De Giorgi (1884), Colam-         picts the distribution of mean annual rainfall values and the
onico (1917, 1956), Bissanti (1968) and subsequently by Zito      location of 14 pluviometric stations, continuously in opera-
et al. (1988). The processing of rainfall data shows that high    tion since 1921. However, recently, the average rainfall has
values of annual mean rainfall are concentrated in the eastern    strongly decreased, giving rise to a long period of drought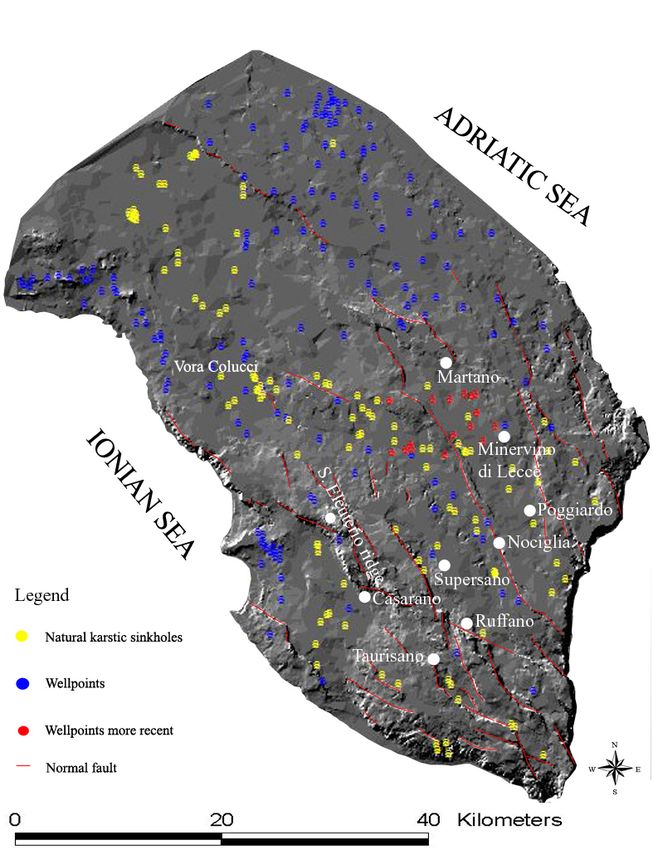
F. Forte et al.: Historic records and GIS applications for flood risk analysis                                                    835

Fig. 5. Rainfall map of Salento peninsula.
                                                                    Fig. 6. “Susceptibility to flood” map of Salento peninsula.

(Arnell, 1999). The results obtained from a recent study of
                                                                       – A “return times” calculation;
Zito (1989) show that drought periods of 50 consecutive days
occur very frequently in summer, in the Salento peninsula.             – Identification of the elements at risk and vulnerability,
For instance, at Gallipoli municipality, these drought spells            depending on the expected damage;
occur every two years, while at Otranto municipality, every
3.1 years. Therefore, the Salento area actually shows cli-             – Analysis of the flood risk, expressed by indices.
matic characteristics which can be defined as almost semi-
                                                                       The initial phase of this research effort has entailed the
arid (temperatures over 40◦ C and insufficient precipitation);
                                                                    creation of an alphanumerical database, the so-called IPHAS
the dryness is concentrated in the summer months, whereas
                                                                    (Salento Alluvial PHenomena Inventory), in which the mu-
the rainfall is mainly concentrated in autumn-winter, but also
                                                                    nicipalities affected by floodings in the time interval from
at the end of summer (Battista et al., 1987).
                                                                    1968 to 2004 have been catalogued. For the data processing,
   However, in Salento, the meteorological changes are very
                                                                    data of the AVI (Italian Vulnerable Areas) project of CNR-
frequent, giving the climate a characteristic of an “unstable
                                                                    GNDCI (National Council of Research) for the time interval
whim”, already recognized by Costa (1834), two centuries
                                                                    of 1968–1999 as well as data of local/national newspapers
ago.
                                                                    (“Gazzetta del Mezzogiorno”, “Quotidiano di Lecce”, “La
                                                                    Repubblica” and “Il Messaggero”) and data of a field survey
2 Methods                                                           conducted for the subsequent time interval 1999–2004, have
                                                                    been taken into account and integrated. A map showing flood
In a similar study of flood hazard and risk, a methodi-             susceptibility has been computed (Fig. 6). The production of
cal investigation based on the historic flood records (Cook,        this map has considered the environmental factors leading
1987; OFDA, 1996; CNR – GNDCI, 1998; Spaliviero,                    to floods (lithology and the fracture network of the strati-
2003) and an analysis of the geoenvironmental factors have          graphic units, slope and runoff) and is used to create digital
been performed (Bersani, 2004). Such an analysis is under-          models in order to attribute susceptibility rates. The environ-
taken through the mapping of these geoenvironmental fac-            mental susceptibility is given by the addition of susceptibil-
tors, where the classes are defined by numerical indices. This      ity rates (Carrozzo et al., 2003). In addition, a flood location
model has been improved by means of techniques and instru-          map (Fig. 7) at a scale of 1:25 000 has been mapped over
ments of data acquisition: particularly, through the develop-       the DTM. These maps, supported by a geolithological map,
ment of statistical packages applied to the different factors as    permeability map and rainfall map, have allowed to iden-
well as through GIS softwares, used for the management and          tify the hazard factor and the hazard areas. With regard to
processing of georeferenced data for large areas (Johnston,         the flood vulnerability factor, the land – use map was linked
1998; Meijerink et al., 2003; Daniels, 2003). Consequently,         with the flood location map and the ‘susceptibility to flood’
the method can be articulated in five research phases:              map. By crossing hazard and vulnerability factors, and sub-
                                                                    sequently using indices obtained from the ArcGIS 8.3 soft-
  – Identification of the flood distribution at a scale of          ware in order to identify the risk classes, the flood risk was
    1:25,000 (maps showing flood susceptibility and flood           mapped. Furthermore, this developed model has been based
    locations);                                                     on a field survey, an aerial photos study, an interpretation of
                                                                    a DTM sequence and rainfall data analysis. Mean annual
  – Detailed study of geoenvironmental factors and causes           and hourly rainfall data were compiled for the time period of
    determining the natural disasters;                              1968 until 1996. Rainfall data from 1996 until today were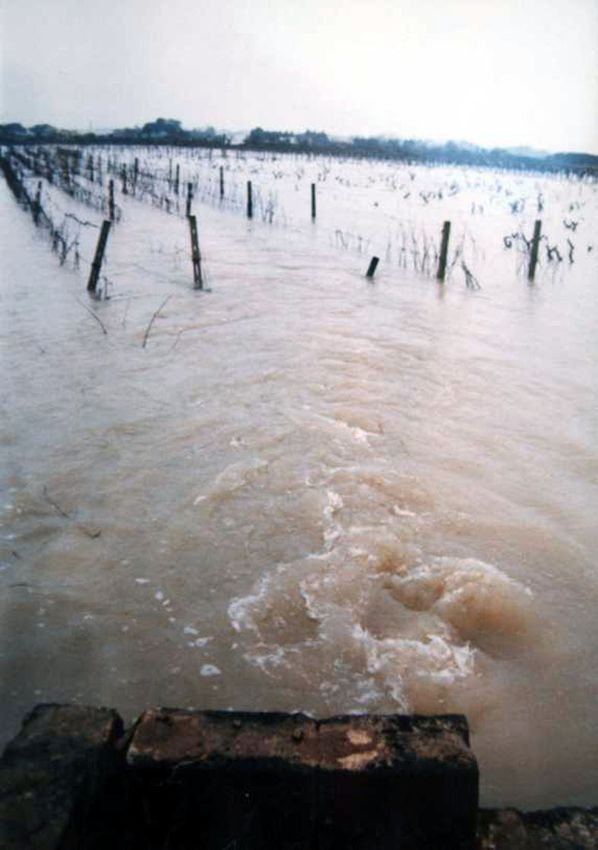
836                                                    F. Forte et al.: Historic records and GIS applications for flood risk analysis

Fig. 7. Flood location map on DTM (Digital Terrain Model) of
Salento peninsula.                                                   Fig. 9. Sketch of permeability map of Salento peninsula.

                                                                     of the mainly karstic sinkholes and wellpoints. Even though
                                                                     Salento is a karstic region, practically without streams, some
                                                                     areas are periodically inundated because the sinkholes and
                                                                     drainage canals, frequently polluted, do not allow for the
                                                                     absorption or further conveyance of rainfall. The floodings
                                                                     cause damage to economic goods in the urban and suburban
                                                                     areas that are located in the lowering zones, where imperme-
                                                                     able sediments, such as silt and clay, hinder floods (Fig. 9).

                                                                     3     Results

                                                                     3.1    Flood hazard assessment

Fig. 8. DTM (Digital Terrain Model) of Salento peninsula from the
                                                                     Hazard mapping is an essential step in the determination of
isolines of 1976.                                                    the past and potential locations of flooded areas (Landesman,
                                                                     2001). With regard to the evaluation of the environmental
                                                                     hazard, a model in GIS software based on index assessment
not available. With regard to the DTM sequence, the first            has been adopted in the past (Bolt, 1975). Such an approach
one (Fig. 3) is computed from the isolines of an aerial photos       takes into consideration the environmental factors causing
survey of 1956, while the second one (Fig. 8) is computed            the flood conditions (Carrozzo et al., 2003). These are the
from the isolines of an aerial photos survey of 1976. The            following: 1) permeability of lithological units; 2) slope and
difference between the DTMs shows the topographical evo-             3) flood location.
lution of Salento in time and space. In fact, small differences         With regard to the hazard index of permeability of the
can be observed, mainly below the ridges. These differences          lithological units, the floodings occur on every lithological
probably are due to agricultural and pastoral activity as well       unit. However, the floodings are more extensive on silt and
as waterflows. In fact, very intense rainfall erodes the allu-       clay than on limestone and sandstone, resulting in higher in-
vium of a slope fault. The alluvium, transported by water, is        dex values for the silt and clay units. With respect to the
redeposited in the lowering zones, filling them slowly and en-       hazard index of slope, the floodings occur more frequently
tirely after each flood event. This observation of a continuous      on flat areas than on slopes, thus leading to higher index
slow migration of the lowering zones is important in order to        values for flat areas. Finally, with regard to the hazard in-
classify the floodings, mainly in terms of the morphometry           dex of flood location, the distance from drainage canals and
of floodings and the hydraulic parameters and characteristics        sinkholes/wellpoints has been considered. Areas nearest to
(Forte, 2005).                                                       sinkholes/wellpoints and drainage canals are more frequently
   An inspection of the DTM of Fig. 8 reveals that the mor-          flooded and, therefore, the index of hazard is assigned a
phology includes Horst and Graben structures, two lowering           higher value (Mijatovic, 1987; Molina et al., 1987; Andah
zones generated by tectonic stresses and presently occupied          et al., 1998; Hudson, 2003).
by lakes, the so-called Alimini lakes. In turn, an inspection           Commencing with these literature data, the characteristics
of the 3D model of Fig. 3 reveals the topography of Salento,         of rainfall (mainly very intense but short rainfall, expressed
with a double system of normal faults and the distribution           as average monthly rainfall) have been considered in order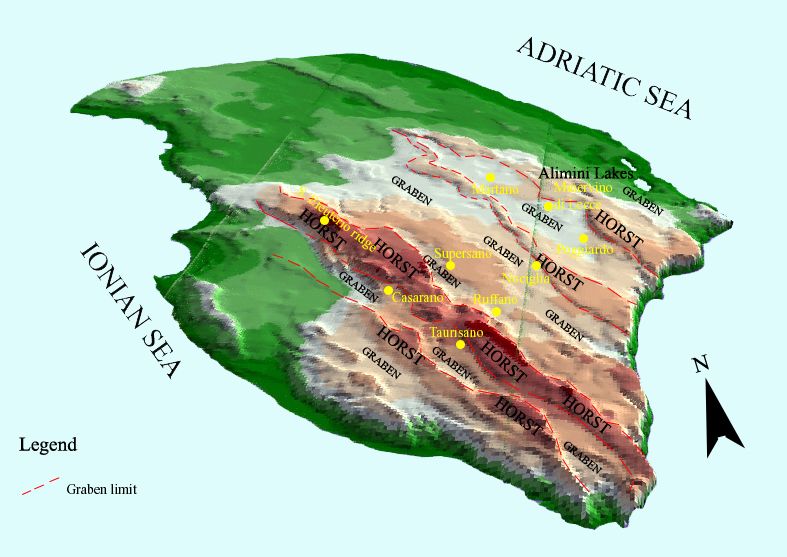
F. Forte et al.: Historic records and GIS applications for flood risk analysis                                                         837

                                                                       Table 2. Values of frequency (Fr ) of floodings.

                                                                                                   Fr                             Fr
                                                                         Acquarica del Capo        0.083   Monteroni di Lecce     0.083
                                                                         Alessano                  0.055   Morciano di Leuca      0.055
                                                                         Alliste                   0.055   Muro Leccese           0.083
                                                                         Aradeo                    0.083   Nardò                 0.196
                                                                         Calimera                  0.027   Nociglia               0.083
                                                                         Campi Salentina           0.138   Novoli                 0.055
                                                                         Caprarica di Lecce        0.027   Otranto                0.027
                                                                         Carmiano                  0.055   Parabita               0.027
                                                                         Casarano                  0.111   Patù                  0.027
                                                                         Castrı̀ di Lecce          0.027   Poggiardo              0.166
Fig. 10. Annual trend of rainfall with reference to a time period of     Castro                    0.027   Porto Cesareo          0.055
                                                                         Cavallino                 0.111   Presicce               0.027
3 h.
                                                                         Collepasso                0.083   Racale                 0.055
                                                                         Copertino                 0.196   Ruffano                0.111
                                                                         Corigliano d’Otranto      0.055   S.anCesario di Lecce   0.027
Table 1. Values of return time (Tr , in years) and number of flood       Corsano                   0.055   San Donato di Lecce    0.055
events (N) extracted from “IPHAS” historic database.                     Cutrofiano                0.027   San Foca               0.027
                                                                         Galatina                  0.138   San Pietro in Lama     0.027
                           Tr    N                          Tr    N      Galàtone                 0.055   Salice salentino       0.055
                                                                         Gallipoli                 0.250   San Cassiano           0.027
 Acquarica del Capo        12     3   Monteroni di Lecce    12    3      Giurdignano               0.027   Sanarica               0.083
 Alessano                  18     2   Morciano di Leuca     18    2      Lecce                     0.416   Scorrano               0.138
 Alliste                   18     2   Muro Leccese          12    3      Lequile                   0.027   Soleto                 0.055
 Aradeo                    12     3   Nardò                5.1   7
                                                                         Leverano                  0.111   Spongano               0.027
 Calimera                  36     1   Nociglia              12    3
                                                                         Lizzanello                0.055   Squinzano              0.196
 Campi Salentina           7.2    5   Novoli                18    2
                                                                         Lucugnano                 0.027   Sternatı̀a             0.055
 Caprarica di Lecce        36     1   Otranto               36    1
 Carmiano                  18     2   Parabita              36    1
                                                                         Maglie                    0.222   Supersano              0.111
 Casarano                   9     4   Patù                 36    1      Marina di Sant’Isidoro    0.027   Surbo                  0.111
 Castrı̀ di Lecce          36    1    Poggiardo              6    6      Marina di Torre Lapillo   0.083   Taurisano              0.083
 Castro                    36     1   Porto Cesareo         18    2      Marittima di Diso         0.027   Trepuzzi               0.055
 Cavallino                  9     4   Presicce              36    1      Martano                   0.083   Tricase                0.138
 Collepasso                12     3   Racale                18    2      Martignano                0.027   Tuglie                 0.027
 Copertino                 5.1    7   Ruffano                9    4      Matino                    0.055   Ugento                 0.083
 Corigliano d’Otranto      18     2   SanCesario di Lecce   36    1      Melendugno                0.027   Uggiano La Chiesa      0.055
 Corsano                   18     2   San Donato di Lecce   18    2      Melissano                 0.138   Veglie                 0.027
 Cutrofiano                36     1   San Foca              36    1      Minervino di Lecce        0.027   Vèrnole               0.083
 Galatina                  7.2    5   San Pietro in Lama    36    1
 Galàtone                 18    2    Salice salentino      18    2
 Gallipoli                  4     9   San Cassiano          36    1
 Giurdignano                3     1   Sanarica              12    3
 Lecce                     2.4   15   Scorrano              7.2   5    erage period of time expected to elapse between occurrences
 Lequile                   36     1   Soleto                18    2    of flood events with a given severity or higher at a particu-
 Leverano                   9     4   Spongano              36    1    lar location. Tr was computed on the basis of the number
 Lizzanello                18     2   Squinzano             5.1   7    of events occurred for each municipality in the time interval
 Lucugnano                 36     1   Sternatı̀a            18    2
 Maglie                    4.5    8   Supersano              9    4    from 1968 to 2004. The frequency Fr is inversely propor-
 Marina di Sant’Isidoro    36     1   Surbo                  9    4    tional to the return time (Table 2). The return time and the
 Marina di Torre Lapillo   12     3   Taurisano             12    3    frequency are computed using
 Marittima di Diso         36     1   Trepuzzi              18    2
 Martano                   12     3   Tricase               7.2   5           1T
                                                                       Tr =                                                         (1)
 Martignano                36     1   Tuglie                36    1            N
 Matino                    18     2   Ugento                12    3
 Melendugno                36     1   Uggiano La Chiesa     18    2            1
                                                                       Fr =                                                         (2)
 Melissano                 7.2    5   Veglie                36    1            Tr
 Minervino di Lecce        36     1   Vèrnole              12    3
                                                                          respectively. Although there are numerous methods to cal-
                                                                       culate the return period, for this specific study, based on his-
                                                                       toric records processing, it has been easier to use Eq. (1) in
                                                                       order to bypass the concept of probability of occurrence of
to assess the flood hazard. A rainfall time interval of 3 h has        floods. In fact, the return time represents the mean value of
been employed in the analysis (Fig. 10). In fact, during this          the time interval between two subsequent flood events.
time interval the maximum rainfall intensity can be obtained,             On the other hand, the frequency has been computed from
as well as the return time Tr (Table 1). Tr represents the av-         the data of the IPHAS report database. More precisely, this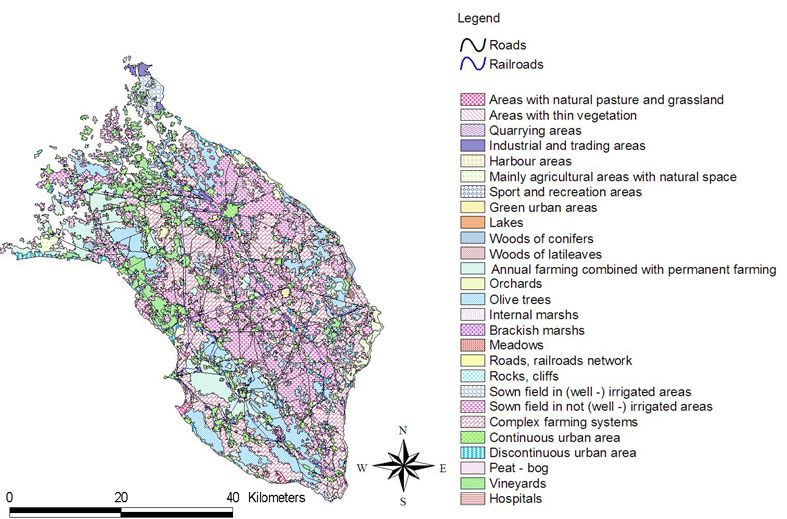
838                                                  F. Forte et al.: Historic records and GIS applications for flood risk analysis

Table 3. Matrix rainfall intensity – frequency.

                      50    100   150
               5       55 105 155
               10      60 110 160        Frequency
               15      65 115 165
                    Rainfall intensity

has been accomplished by counting how many times N a
given municipality has been affected by floodings in a time
interval of 1T =37 years (1968–2004) (Table 1).
   Three classes of intensity can be distinguished, by consid-
ering a time interval of 3 h and the mean value of rainfall per
hour:                                                              Fig. 11. Hazard flood map of Salento peninsula.

  – Municipalities that register values of rainfall until
    16.6 mm/h – low intensity class;                               3.2   Flood vulnerability assessment
  – Municipalities that register values of rainfall from
    16.6 mm/h to 33.3 mm/h – moderate intensity class;             For the flood vulnerability assessment, the rainfall inten-
                                                                   sity has been linked to the socio–economic element at risk,
  – Municipalities that register values of rainfall from           distributed on the Salento peninsula and identified in the
    33.3 mm/h to 50 mm/h – high intensity class.                   database IPHAS, under the so-called scheme “DAMAGES”
                                                                   (APAT, DDS (SGI), 2001) (Table 4). Where it was possible,
Likewise for the rainfall frequency, there are three classes,      the quality of each element has been considered (Downing,
by considering the number of flood events that had occurred        1991). Each census application form, referring to a particu-
in a given municipality:                                           lar flood case in a given municipality, has it own assessment
                                                                   of the partial “damage degree”. Therefore, the total “damage
  – Municipalities that register cases of floods until 5 times     degree”, calculated for each municipality in the time interval
    – low frequency;                                               1968–2004, is the average of the partial “damage degrees”
                                                                   (Wang et al., 1999).
  – Municipalities that register cases of floods until 10 times
                                                                      As can be seen from the list below, the vulnerability and
    – moderate frequency;
                                                                   the damage degree have been divided into nine classes. Ev-
  – Municipalities that register cases of floods until 15 times    ery element at risk has an aesthetic damage, for instance,
    – high frequency.                                              when the function of the element affected by flooding is not
                                                                   impaired. When the element at risk is not functioning, it is
   For example, it is quite natural to think that for an area      classified as a structural damage. The different damage de-
having a frequency value of “15” and a mean value of rainfall      grees are the following:
intensity of 50 mm/h, the hazard value will be higher than for
an area having a frequency value of “5” and a mean value of           – No damage,
rainfall intensity of 16.6 mm/h.
   Subsequently, the matrix “rainfall intensity-frequency”            – Low aesthetic damage,
was developed (Table 3), obtaining nine indices with differ-
ent hazard degrees for mapping the hazard factor (Fig. 11).           – Moderate aesthetic damage,
Furthermore, the indices obtained by matrix computation do
                                                                      – High aesthetic damage,
not give the absolute value and include some degree of sub-
jectivity. Similarly, the areas with different hazard degrees,
                                                                      – Low structural damage,
obtained by data processing in the ArcGIS software, do not
have absolute values, but have a continuous evolution in time         – Moderate structural damage,
and space.
   The derived classes in Fig. 11 show that more than 50%             – High structural damage,
of Salento has high or very high index values of environ-
mental hazard, located mainly between the small ridges, the           – Dangerous damage,
so-called “Serre” and in the eastern part where the rainfall
exhibits maximum values.                                              – Very dangerous damage.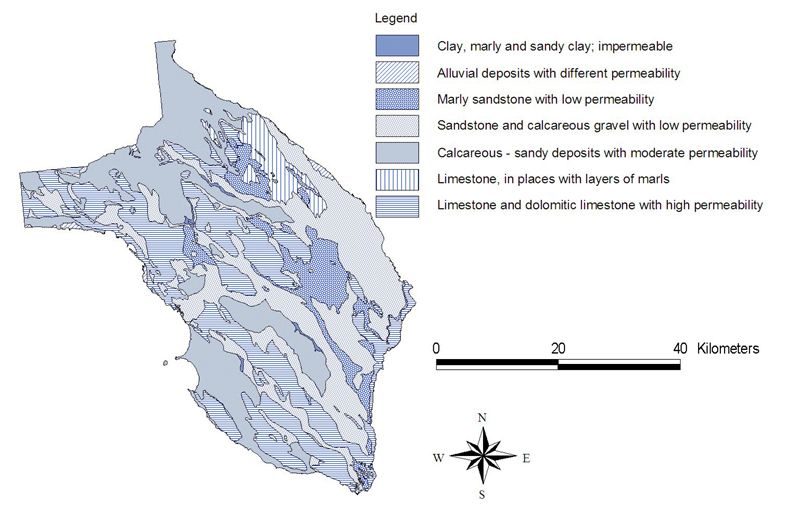
F. Forte et al.: Historic records and GIS applications for flood risk analysis                                                                                  839

Table 4. Field “damage” extracted from the “IPHAS” historic database.

                                                                       Field “DAMAGE”
        Kind of damage               o direct
        People        o             o deads N.                   o Injuries N.                o evacuated N.                 o at risk N.
        Buildings         o         o private N.                 o public N.                  o private at risk N.           o public at risk N.
        Costs (ML.)                 Goods                                      Activities                             Total
                                         Degree                                  Degree                              Degree                            Degree
       Municipality                      o          Struct. of publ. service     o          Cultural goods           o          Roads                  o
       larger town                                  hospital                                monuments                           autostrada
                                                                                            historic–architectonic
       little town                                  barracks                                                                    of the state
                                                                                            goods
       farmhouses                                   school                                  museums                             provincial
       scattered houses                             library                                 works of art                        municipal
                                                    public administration
       Economic activity                 o                                                  Service infrastructure   o          rural
                                                    center
       commercial areas                             church                                  aqueduct                            Setting up works       o
       working areas                                sport system                            drains                              canal control
       manufacturing system                         cemetery                                electric lines                      slope strengthening
       chemical system                              power station                           telephone linees                    protection works
       quarrying system                             naval port                              gasduct
       zootechnical system                          bridge or viaduct                       oil pipeline                        Canals       o
       Agricultural land                 o          tunnel                                  canalizations                       Name
       spread                                       penstock                                line systems
       spread at trees                              railway station                         Rail roads               o
       specialized farming                          water basin                             high velocity
       meadow                                       dam                                     2 or more tracks                    Damage:           m potential
       wood                                         incinerator                             Single - track                      m deviation
       reafforestation                              dump                                    urban network                       m partial damming
                                                    depurator                               rail road                           m total damming
       Damage degree: N = No damage; E = Low aesthetic damage; E’ = Moderate aesthetic damage; E’’= High aesthetic damage;

       F = Low structural damage; F’ = Moderate structural damage; F’’ = High structural damage; G = Dangerous damage; G’ = Very dangerous damage

Fig. 12. Elements at Risk map of Salento peninsula.
                                                                                       Fig. 13. Flood vulnerability map of Salento peninsula.

   Cartographically, the flood location map obtained by a                                 An inspection of Fig. 13 reveals that more than 50% of
field survey and ‘susceptibility to flood’ map obtained by the                         Salento has high or very high values of the vulnerability fac-
DTM study have been considered as well as the ‘elements at                             tor, also according to the values of environmental hazard.
risk’ map with a mapping of roads and railroads (Fig. 12).                             These areas are located mainly between the ridges and in the
Using the “overlay mapping” method through a “map query”                               eastern part of Salento. In addition, the elements which are
function, the flood vulnerability map (Fig. 13) was calcu-                             mostly damaged by floods, according to the elements at risk
lated, where nine classes with different vulnerability degrees                         distribution of the Corine Landcover Project (1999) are the
are represented.                                                                       following:
   Each class has one fictitious multiple of three indices in
order that the vulnerability factor is numerically defined by                               1. Olive trees and tobacco, mainly cultivated in the graben
values. The indices are linked with a matrix of hazard values                                  areas, represent a very important regional economic re-
in order to calculate the risk factor.                                                         source;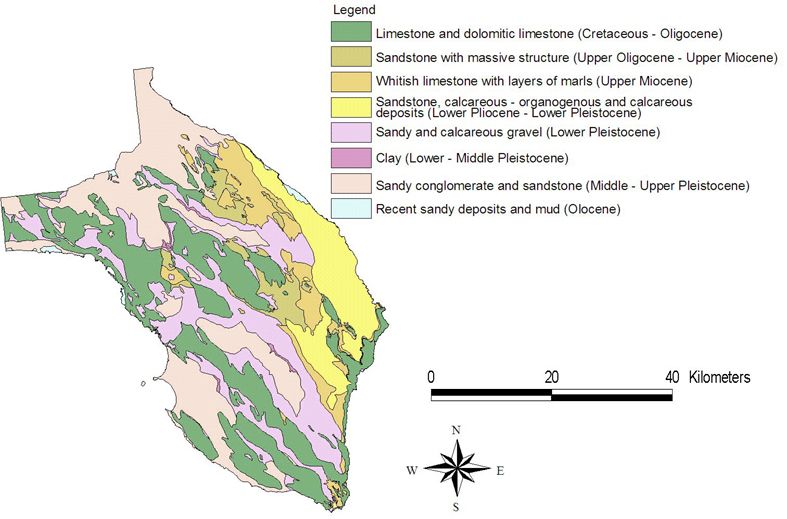
840                                                    F. Forte et al.: Historic records and GIS applications for flood risk analysis

Table 5. Matrix of hazard – vulnerability factors.

                                    55    60    65   105     110    115    155    160    165
                               3    58    63    68   108     113    118    158    163    168
                               6    61    66    71   111     116    121    161    166    171
                               9    64    69    74   114     119    124    164    169    174
                              12    67    72    77   117     122    127    167    172    177    Vulnerability
                              15    70    75    80   120     125    130    170    175    180
                              18    73    78    83   123     128    133    173    178    183
                              21    76    81    86   126     131    136    176    181    186
                              24    79    84    89   129     134    139    179    184    189
                              27    82    87    92   132     137    142    182    187    192
                                                           Hazard

                                                                          trol, needs to be recalled at this point (Coburn et al., 1994).
                                                                          As stated before, the flood risk R is a scalar quantity which
                                                                          links the hazard factor, defined as the probability that a flood
                                                                          occurs in a given area with a determined return period, to
                                                                          the vulnerability factor, that is the propensity of an element
                                                                          (urban and industrial areas, agricultural areas, extraurban in-
                                                                          frastructures; historical, artistic and environmental goods) to
                                                                          resist a particular flood (Green et al., 1989).

                                                                             In order to calculate the risk factor, the hazard factor has
                                                                          been linked to the vulnerability and expected damage factors,
                                                                          according to the matrix. Subsequently, the indices, defining
                                                                          the areas which are characterized by a risk value, are com-
                                                                          puted (Gisotti et al., 2000) (Table 5).

                                                                             Such a table shows a matrix represented by 81 indices,
Fig. 14. Flood risk map of Salento peninsula.
                                                                          which in turn shows municipal areas of Salento with different
                                                                          flood risk values, due to flash floods.
  2. Vineyards, located throughout but in small areas;
                                                                             One may think of the indices as expressed percent values,
  3. Annual farming combined with a permanent farming or                  with a variability range between 1% and 81% (the matrix
     complex farming system, represented by very large ar-                is represented by nine hazard indices and nine vulnerability
     eas in Fig. 12;                                                      indices). The choice of a variability range between 1–81% is
                                                                          not arbitrary, but justified by simplicity of computation.
  4. Continuous/discontinuous urban areas, roads and rail-
     roads and urban/industrial areas.                                       Table 6 gives the percent values of flood risk, calculated
                                                                          for each municipality of Salento and referring to the agri-
  5. Cultivated fields, covering large areas and located in
                                                                          cultural and urban/industrial areas. The risk values obtained
     non-irrigated zones.
                                                                          have some degree of uncertainty, essentially due to the sub-
   Therefore, floodings affect very large agricultural areas, as          jectivity of the operator with regard to the hazard and vulner-
well as urban/industrial areas, especially if located in the im-          ability indices assessment (particularly for the vulnerability
permeable lowering zones (Khan, 2005). Obviously, the vul-                function, the choice of social and economic elements and its
nerability assessment has always some degree of uncertainty               association in classes has been highly approximate and, since
and must be estimated on a case by case basis, element by                 the elements at risk are numerous, the vulnerability assess-
element, being variable because of the parameters involved.               ment has been difficult).
For simplification purposes, a general subdivision of the ele-
ments at risk is considered in Table 4.                                     The thematic map (Fig. 14) shows that the flood risk values
                                                                          have been grouped into six classes, conferring a value range
3.3   Flood risk assessment                                               between 0 and 0.81. The indices of the hazard – vulnerability
                                                                          matrix have been inserted and processed with the ArcGIS
The definition of Risk given by U.N.D.R.O. (United Nations                software in order to calculate the flood risk (Carrozzo et al.,
Disaster Relief Office), UNESCO’s Office for Disaster con-                2003; Forte, 2005).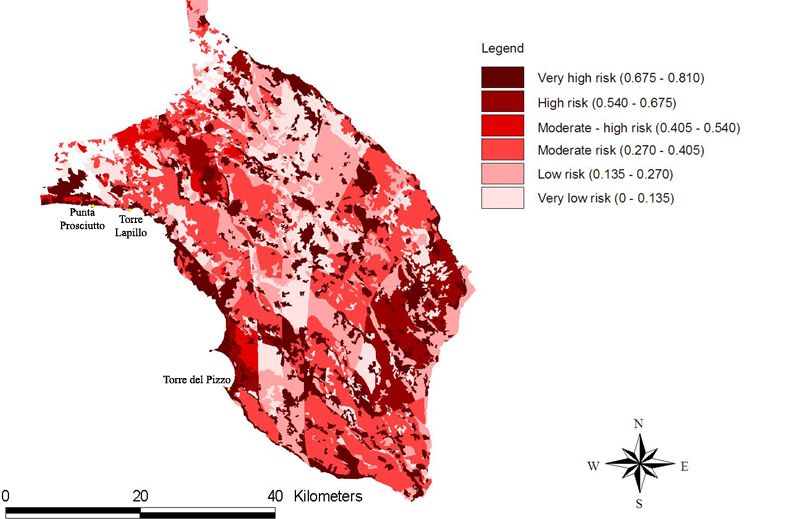
F. Forte et al.: Historic records and GIS applications for flood risk analysis                                                        841

Table 6. Index values of Risk (Rw ) with reference to agricultural areas and urban/industrial areas.

                              Rw agricultural     Rw urban/industrial                             Rw agricultural   Rw urban/industrial
   Acquarica del Capo               0.55                  0.52            Monteroni di Lecce           0.43                0.25
   Alessano                         0.40                  0.36             Morciano di Leuca           0.42                0.30
   Alliste                          0.33                  0.38               Muro Leccese              0.37                0.35
   Aradeo                           0.35                  0.40                   Nardò                0.68                0.70
   Calimera                         0.32                  0.40                  Nociglia               0.67                0.60
   Campi Salentina                  0.81                  0.80                   Novoli                0.60                0.66
   Caprarica di Lecce               0.40                  0.40                   Otranto               0.21                0.20
   Carmiano                         0.67                  0.60                  Parabita               0.40                0.36
   Casarano                         0.65                  0.60                    Patù                0.34                0.33
   Castrı̀ di Lecce                 0.55                  0.33                 Poggiardo               0.60                0.53
   Castro                           0.35                  0.33               Porto Cesareo             0.70                0.65
   Cavallino                        0.55                  0.33                  Presicce               0.46                0.40
   Collepasso                       0.33                  0.33                   Racale                0.42                0.37
   Copertino                        0.75                  0.60                  Ruffano                0.66                0.60
   Corigliano d’Otranto             0.33                  0.33            SanCesario di Lecce          0.30                0.33
   Corsano                          0.43                  0.40            San Donato di Lecce          0.36                0.34
   Cutrofiano                       0.45                  0.40                 San Foca                0.52                0.46
   Galatina                         0.72                  0.66             San Pietro in Lama          0.35                0.33
   Galàtone                        0.60                  0.66              Salice salentino           0.36                0.28
   Gallipoli                        0.81                  0.64               San Cassiano              0.73                0.45
   Giurdignano                      0.68                  0.50                  Sanarica               0.31                0.28
   Lecce                            0.74                  0.63                  Scorrano               0.68                0.66
   Lequile                          0.55                  0.41                   Soleto                0.24                0.13
   Leverano                         0.70                  0.76                 Spongano                0.39                0.38
   Lizzanello                       0.52                  0.66                 Squinzano               0.65                0.52
   Lucugnano                        0.55                  0.50                  Sternatı̀a             0.45                0.33
   Maglie                           0.64                  0.64                 Supersano               0.56                0.53
   Marina di Sant’Isidoro           0.40                  0.66                   Surbo                 0.55                0.47
   Marina di Torre Lapillo          0.81                  0.80                 Taurisano               0.52                0.46
   Marittima di Diso                0.37                  0.50                  Trepuzzi               0.54                0.47
   Martano                          0.62                  0.40                   Tricase               0.60                0.62
   Martignano                       0.43                  0.48                   Tuglie                0.39                0.46
   Matino                           0.52                  0.50                   Ugento                0.62                0.70
   Melendugno                       0.43                  0.38             Uggiano La Chiesa           0.58                0.47
   Melissano                        0.63                  0.54                   Veglie                0.57                0.58
   Minervino di Lecce               0,57                  0,50                  Vèrnole               0.63                0.68

4 Discussion and conclusions                                              vium was accumulated from erosion by rainfall water im-
                                                                          pacting other zones (Figs. 3 and 8).
The methodology adopted for flood risk analysis in the                      The application of this developed methodology can be
Salento peninsula, according to the historical model and the              considered to be quite satisfactory, given that the basic in-
study of DTM sequence, where the lowering zones affected                  ventory maps were very good.
by floodings can be seen, allows to identify the hazard and                 An inspection of Figs. 11 and 14 reveals that the flood haz-
total risk areas in the study area. In particular, the DTM se-            ard analysis has produced an inhomogeneous distribution of
quence shows an increase of the surface of the Graben struc-              the flood risk values in the study area and, consequently, the
tures and, therefore, an increase of the surface of the flooded           highest values are located:
areas. For example, in the time interval from 1956 to 1976,
the Graben area included between the Supersano, Ruffano
and Nociglia municipalities was increased by approximately                  – In the graben area of the SW and SE (Fig. 15).
1 km2 , such as calculated by the GIS software. In addition,
during the same time interval, other lowering zones in the S.               – Along the coast at W, from Torre del Pizzo (near Gal-
Eleuterio - Casarano - Taurisano Graben, such as the low-                     lipoli town, Fig. 16) to Porto Cesareo, at NW and, fur-
ering zones of Poggiardo – Minervino di Lecce – Martano                       thermore, towards Torre Lapillo and Punta Prosciutto
Graben, have increased their surface area because the allu-                   (NW part).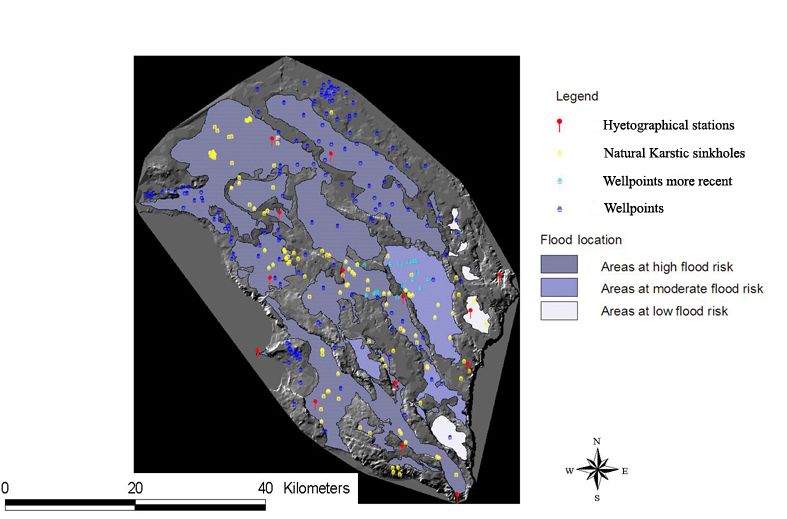
842 F. Forte et al.: Historic records and GIS applications for flood risk analysis
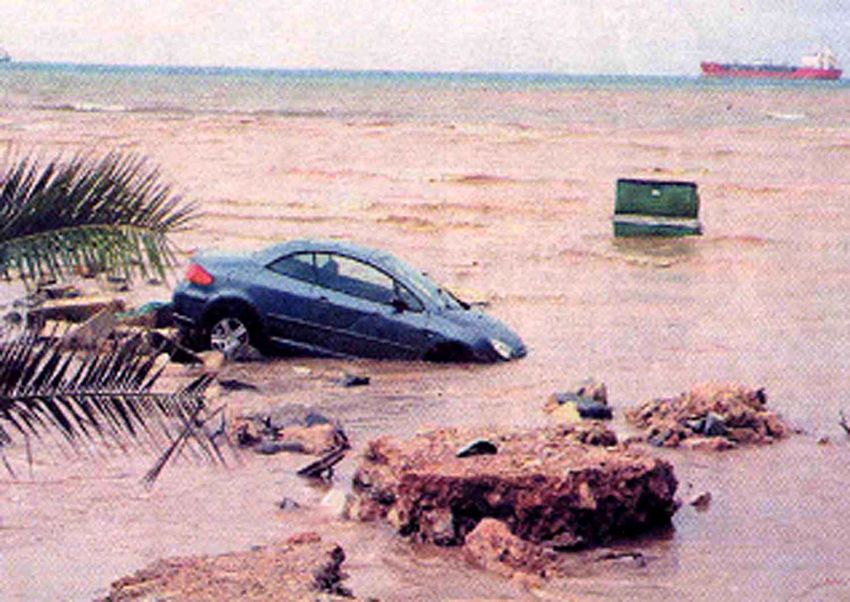
Fig. 16. Big flood at Torre del Pizzo, near Gallipoli municipality.
Continental waters flow towards the sea, dragging cars and hous-
escontent.
1) incorrect management of funds, 2) extended delay of the
Government to set-up the different phases in an intervention
planning and/or 3) negligence of the Government to enforce
laws addressing environmental protection (ICGPSIA, 1995).
As a general rule, it is also opportune to consider the
more catastrophic events in order to identify the behaviour
of the floods and their interaction with the geological and
geomorphological environment, analysing always the mini-
mum thresholds of the precipitation and the way in which
they manifest themselves.
Fig. 15. Damages to agricultural area (vineyards) due to flash flood
at Galàtone municipality. Acknowledgements. The authors wish to thank the Municipal Tech-
nical Offices of Salento, the Provincial Firemen of Lecce town, the
Department of Civil Protection, “Sigismondo Castromediano” Li-
The map processing and analysis show moderate to high brary of Lecce town and local/national Newspapers (“Quotidiano
values of flood risk, conferring a remarkable importance to di Lecce”, “Gazzetta del Mezzogiorno”, “Il Messaggero” and “La
the moderate class of risk, which represents almost 50% of Repubblica”) for their interest, valuable comments and help obtain-
the area. Just the Horst and NE areas show low and moderate ing information about the number of calamitous events occurred
to low values because the geological and geomorphological and rescue operations. The Reclamation Land Union “Ugento Li
Foggi” and “Arneo”, Directorate of Public Works, and the Hydro-
characteristics tend to prevent flood occurrences. Further-
graphic Survey of Bari assisted with the rainfall data processing.
more, since it was not possible to make forecasts for areas not
struck by floods, it was hence not possible to assess the flood Special thanks are also extended to ITC (International Institute for
hazard and risk in these areas. Nevertheless, the study carried Geo-Information Science and Earth Observation) of Enschede, the
Netherlands.
out at a scale of 1:25 000, according to the guidelines of the
Italian law 183/89 (Soil Defense), law 180/98 (mapping of Edited by: M.-C. Llasat
areas at hydrogeological risk) and law 365/2000 (interven- Reviewed by: two referees
tion measures of areas affected by floods), is an important
tool that the government agencies should consider in order to
correctly undertake management and intervention planning, References
whose purpose is to prevent and/or mitigate the flood risk.
In addition, with regard to the risk assessment of the ele- Andah, K. and Umbertini, L.: Confronting hydrogeological dis-
aster in a vulnerable environment, in: Managing hydrogeolog-
ments involved, it is necessary to use detailed technical maps
ical disasters in a vulnerable environment, edited by: Andah, K.,
(with a scale of 1:5000) which are presently not available for
CNR-GNDCI & UNESCO, Int. Hydrogeol. Progr., Perugia, 33–
the study area. 68, 1998.
Often, however, these types of studies are not addressed Agency for Environmental Protection and for Technical Surveys:
to set - up an intervention policy to prevent and/or mitigate Department of Soil Defence, National Geological Survey (in Ital-
the flood risk. There are many reasons for this, often unjus- ian: APAT, DDS (SGI) (Agenzia per la Protezione dell’Ambiente
tified, which can be one or a combination of the following: e per i Servizi Tecnici, Dipartimento Difesa del Suolo, ServizioF. Forte et al.: Historic records and GIS applications for flood risk analysis 843 Geologico d’Italia)): Scheme of application form of “IFFI Paper 2.1. USAID, 102 pp., Washington, 1991. Project (Inventario Fenomeni Franosi in Italia)”, Roma, 2001. Forte, F.: GIS, aerial photos, remote sensing study for flood risk Arnell, N. W.: The effect of climate change on hydrogeological management and assessment, Case study of Salento peninsula, regimes in Europe: a continental perspective, Global Environ. Southern Italy, PhD thesis in Geomorphology and Environmental Change, 9, 5–23, 1999. Dynamics, 116 pp., Digilabs editor, Bari, 2005. Battista, C., Boenzi, F., Fiore, S., Novembre, D., Palmentola, G., Gisotti, G. and Benedini, M.: Il dissesto idrogeologico: previsione, and Pennetta, L.: Lineamenti geografici del Salento leccese, prevenzione e mitigazione del rischio. Nuova edizione aggior- Conv. Ann. del Gr. Naz. di Geogr. Fis. e Geomorf., Lecce, 1985. nata ed ampliata, Carocci editore, 595 pp., ill.; 24 cm – (Manuali Battista, C., Pennetta, L., Specchio, V., and Zito, G. M.: L’aridità del progettista (Carocci); 79), Roma, 2000. del suolo nella Penisola Salentina, Quad. Ric. Centro Studi Geot. Green, C. H. and Penning-Rowsell, E. C.: Flooding and the quan- Ing., Lecce, 11, 259–274, 1987. tification of “intangibles”, Journal of the Institution of Water and Bersani, P.: Tiber River at Rome: summer Floods and consider- Environmental Management, 3, 27–30, 1989. ations on the maximum historical discharge, J. Tech. Environ. Hudson, P. F.: Floodplains: environment and process, Geomorphol- Geol., CNG, 2, 2004. ogy, 56, 223–224, 2003. Bissanti, A.: Le piogge in Puglia, Ann. Fac. Econ. e Comm. Univ. ICGPSIA (Interorganizational Committee on Guidelines and Prin- di Bari, 23, 90, Bari, 1968. ciples for Social Impact Assessment): Guidelines and Principles Bolt, B. A.: Geological hazards: Earthquakes, Tsunamis, Volca- for Social Impact Assessment, EIA Review, 15, 11–43, 1995. noes, Avalanches, Landslides, Floods, Springer, Berlin, 8, 328 Johnston, A.: Geographic Information Systems in Ecology, Black- pp., 1975. well, Oxford, 1998. Carrozzo, M. T., Delle Rose, M., De Marco, M., Federico, A., Forte, Khan, S. D.: Urban development and flooding in Houston Texas, F., Margiotta, S., Negri, S., Pennetta, L., and Simeone, V.: Peri- inferences from remote sensing data using neural network tech- colosità ambientale di allagamento nel Salento leccese, Quad. di nique, Environ. Geol., 47, 1120–1127, 2005. Geol. Appl., Serie AIGA, Roma, 1, 77–85, 2003. Landesman, L. Y.: Hazard assessment, Vulnerability analysis, Risk Carrozzo, M. T. and Ruggero, L.: Descrizione climatica e paleo- assessment and Rapid Health assessment, Public Health Man- climatica della Puglia, Atti 1◦ Workshop “Clima, Ambiente e agement of Disasters, APHA, Washington DC, chapter 5, 57–72, Territorio nel Mezzogiorno”, Taormina, 31–41, 1989. 2001. Ciaranfi, N., Pieri, P., and Ricchetti, G.: Note alla Carta Geologica Largaiolli, T., Martinis, B., Mozzi, G., Nardin, M., Rossi, D., and delle Murge e del Salento, Mem. Soc. Geol. It., 41, 449– 460, Ungaro, S.: Note illustrative della Carta Geologica d’Italia – 1988. Foglio 214 “Gallipoli”, Serv. Geol. It., 64 pp., Roma, 1969. CNR (National Council of Research) – GNDCI (National Group for Martinis, B.: Lineamenti strutturali della parte meridionale della Hydrogeological Catastrophes Defence) (in Italian: CNR (Con- Penisola Salentina, Geol. Rom., Roma, 1, 11–23, 1962. siglio Nazionale delle Ricerche) – GNDCI (Gruppo Nazionale Martinis, B.: Sedimenti calabriani sulle Serre Calaturo e Castelforte per la Difesa dalle Catastrofi Idrogeologiche)): AVI Project (Ital- (Penisola Salentina), Riv. It. Paleont. e Strat. LXXIII, Milano, ian Vulnerable Areas): Census of Italian municipalities affected 1023–1038, 1967a. by landslides and floods, CNR, Perugia, 1998. Martinis, B.: Note geologiche sui dintorni di Casarano e Castro Coburn, A. W., Spence, R. J. S., and Pomonis, A.: Vulnerability and (Lecce), Riv. It. Paleont. e Strat. LXXIII,Milano, 1–64, 1967b. Risk Assessment, 2nd ed. Geneva: UNDP Disaster Management Martinis, B.: Note illustrative della Carta Geologica d’Italia. Foglio Training Programme, 69 pp., 1994. 223 ”Capo S. Maria di Leuca”, Serv. Geol. It., 64 pp., 1970. Colamonico, C.: Aspetti geologici e geografici del Salento, Studi Meijerink, A. M. J., De Brouwer, J. A. M., Mannaerts, C., and salentini, Galatina, 1, 11–19, 1956. Valenzuela, C. R.: Flood study in the Meghna-Dhonagoda Colamonico, C.: Zone di piovosità e densità di popolazione nella polder, Bangladesh, Introduction to the use of Geographic Infor- Provincia di Lecce, Riv. Geogr. It., Firenze, Fig. 2, 24, 161–180, mation Systems for practical hydrology; UNESCO, International 1917. Hydrological Programme ITC, 2003. Cook, J. L.: Quantifying peak discharges for historical floods, J. Mijatovic, B. F.: Catastrophic flood in the polje of Cetinje in Febru- Hydrol., 37, 29–40, 1987. ary 1986, a typical example of environmental impact of karst, Corine Project LU/LC (Land Use/Land Cover): Cartographical data Proceedings of “Karst hydrogeology: Engineering and environ- of Land Use, 1999. mental applications”, Orlando, 299–303, 1987. Costa, O. G.: Osservazioni meteorologiche fatte in Lecce (dal 1812 Molina, M. and McDonald, F.: Sinkhole management and flooding al 1824), Ann. Civ. Regno Due Sicilie, Napoli, 6, 5–10, (C 602), in Jamaica, Proceedings of “Karst hydrogeology: Engineering 1834. and environmental applications”, Orlando, 293–298, 1987. Daniels, M. D.: Hydrological Applications of GIS, edited by: Gur- Newspaper “Il Messaggero”: News about the floods occurred dur- nell, A. M. and Montgomery D. R., John Wiley and Sons, Chich- ing the years 1968–2004, Roma. ester, 2000, 173 pages, Geomorphology, 54, 347–348, 2003. Newspaper “La Gazzetta del Mezzogiorno”: News about the floods De Giorgi, C.: Cenni di geografia fisica della provincia di Lecce, occurred during the years 1968–2004, Bari. Tip. Ed. Salentina, Lecce, 1884. Newspaper “La Repubblica”: News about the floods occurred dur- De Giorgi, C.: Descrizione geologica e idrografica della provincia ing the years 1968–2004, Roma. di Lecce, Ed. Salomi, Lecce, 1922. Newspaper “Quotidiano di Lecce”: News about the floods occurred De Giorgi, C.: Descrizione fisica geologica e idrografica della during the years 1968–2004, Lecce. provincia di Lecce (a cura di A. Vignola), Centro Studi Sal., Ti- OFDA (Office of the US Foreign Disaster Assistance): Disaster his- pografia Mariano, Galatina, 1960. tory, significant data on major disasters worldwide, 1900–1995, Downing, T. E.: Assessing socio – economic vulnerability to US Agency for International Development, Washington, 265 pp., famine: frameworks, concepts and applications, FEWS Working 1996.
844                                                     F. Forte et al.: Historic records and GIS applications for flood risk analysis

Ricchetti, G.: Carta Geomorfica del Salento Meridionale, Quad.        Zito, G. M., Ruggiero, L., and Zuanni, F.: Zone climatiche omoge-
  Ric. Centro Studi Geot. Ing., 11, Lecce, 1988.                         nee in Puglia, Atti 2◦ Colloquio “Approcci metodologici per la
Spaliviero, M.: Historic fluvial development of the Alpine – fore-       definizione dell’Ambiente fisico e biologico del Mediterraneo”,
  land Tagliamento River, Italy, and consequences for floodplain         Lecce, 15–40, 1988.
  management, Geomorphology, 52, 317–333, 2003.                       Zito, G. M., Ruggiero, L., and Zuanni, F.: Aspetti meteorologici
Wang, R., King, L., and Jiang, T.: Flood vulnerability analysis and      e climatici della Puglia, Atti 1◦ Workshop “Clima, Ambiente e
  hazard management, Supported by GIS and remote sensing, Nat-           Territorio nel Mezzogiorno, Lecce, 1989.
  ural hazard Conference, Enschede, The Netherlands, 1999.
You can also read