Italian workers at risk during the Covid-19 epidemic - INAPP WP n. 46 WORKING PAPER - oa inapp
←
→
Page content transcription
If your browser does not render page correctly, please read the page content below
WORKING PAPER

INAPP WP n. 46

Italian workers at risk during the
Covid-19 epidemic

Teresa Barbieri
Gaetano Basso
Sergio Scicchitano

APRILE 2020
Italian workers at risk during the
Covid-19 epidemic

Teresa Barbieri
Istituto nazionale per l’analisi delle politiche pubbliche (INAPP), Roma
t.barbieri.ext @inapp.org

Gaetano Basso
Banca d’Italia, Roma
gaetano.basso@bancaditalia.it

Sergio Scicchitano
Istituto nazionale per l’analisi delle politiche pubbliche (INAPP), Roma
s.scicchitano@inapp.org

APRILE 2020

We thank Fabrizio Balassone, Marco Biagetti, Marco Centra, Federico Cingano, Francesco D’Amuri,
Maurizio Franzini, Andrea Lamorgese, Andrea Linarello, Andrea Petrella and Eliana Viviano for their
comments. We thank Andrea Lamorgese and Andrea Linarello for sharing the data on locked down
sectors, and Raffaella Nizzi and Salvatore Marsiglia for help with some background analysis. The
views expressed in this paper are those of the authors and do not necessarily reflect those of the
Bank of Italy nor those of INAPP.

CONTENTS: 1. Introduction and main message. – 2. How to measure the job-related risk of
exposure to Covid-19. – 3. Sectors at risk. – 4. The Italian sectoral lockdowns and workers at risk;
4.1 Descriptive evidence; 4.2 Workers most exposed at risk and sectoral lockdowns; 4.3 Additional
evidence on working from home and sectoral lockdowns. – 5. Conclusions. – Appendix. –
References

 INAPP – Istituto nazionale per l’analisi delle politiche pubbliche
 Corso d’Italia 33 Tel. +39 06854471
 00198 Roma, Italia Email: urp@inapp.org www.inapp.org
ABSTRACT

Italian workers at risk during the
Covid-19 epidemic
We analyse the content of Italian occupations operating in about 600 sectors with a focus
on the dimensions that expose workers to contagion risks during the Covid-19 epidemics.
To do so we leverage extremely detailed and granular information from ICP, the Italian
equivalent of O*Net. We find that several sectors need physical proximity to operate: the
workers employed in Italy in sectors whose physical proximity index is above the national
average are more than 6.5 million (most of them in retail trade). Groups at risk of
contagion and complications from Covid-19 (mainly male above the age of 50) work in
sectors that are little exposed to physical proximity, currently under lockdown or can work
remotely. The sectoral lockdowns put in place by the Italian Government in March 2020
seem to have targeted sectors which operate in physical proximity, but not those directly
exposed to infections (the health industry is not subject to lockdown). Most workers who
can operate from home have not been put under lockdown and are currently working.
Therefore, the number of workers who are not in workplaces could be up to 3 million
higher than those whose sector has been shutdown.

KEYWORDS: working conditions, safety, crisis policies, Covid-19 epidemics

JEL CODES: J28, J81, H12, I18
4 Italian workers at risk during the Covid-19 epidemic

1. Introduction and main message

The Covid-19 emergency in Italy is expanding at a fast pace and severe social and economic measures
have been adopted to preserve public health and keep most workers safe (Baldwin and Weder di
Mauro 2020), including locking down several industrial sectors. However, some workers are more at
risk than others because they work in physical proximity to other people (customers, co-workers) or
they are exposed to diseases and infections, or both1. In this paper, we analyse the content of Italian
occupations operating in about 600 sectors with a particular focus on the dimensions that expose
workers to contagion risks during the Covid-19 epidemics. First, we classify the occupations according
to the worker’s diseases exposure, physical proximity and possibility to work from remote and map
them into sectoral indexes. Then, we quantify the impact of the recent sectoral lockdowns put in place
by the Italian government on March 11 and March 25, 2020, with a particular focus on workers
exposed to disease risks.
We do so by leveraging extremely detailed information on the content of about 800 occupations
derived from the Italian Sample Survey on Professions (ICP) run by Inapp, and we combine these data
with the three most recent waves, from the first to the third quarter of 2019, of the Istat Italian labour
force survey (LFS). The main advantage of the ICP data is twofold: first, it is extremely granular in terms
of occupations and rich in terms of job characteristics; second, and most important, these
characteristics are specific of the Italian productive system, its labour market and institutions. Thus,
no international crosswalk (based for instance on US data) is needed. The analysis is run at the 4-digit
sectoral level, which we match to the ICP occupational data based on a crosswalk constructed on the
2018 LFS data, by weighing each occupation-specific index by the occupational employment share in
each sector (more details on the ICP data can be found at the end of this document).
The main results of the analysis are the following. First, workers in occupations that are exposed to
infection and disease risks tend to work in close physical proximity to other people. This is especially
true for occupations prevalent in sectors that are vital during an epidemic outbreak, mainly in the
health industry: these sectors can hardly be put on lockdown, but specific subsectors could probably
experience some restrictions (e.g., dentists). Second, several other sectors, mainly related to personal
services, leisure and recreation are not directly exposed to infections and diseases, but need physical
proximity to operate. The number of workers employed in the first three quarters of 2019 in sectors
whose physical proximity index is above the national average, excluding healthcare and necessary
goods, is above 6.5 million. Overall, the retail trade sector seems to be at higher risk of contagion
because of physical proximity in the workplace. Finally, groups that are at risk of contagion and
complications from Covid-19 (mainly male, and workers above the age of 50) work in sectors that are
either little exposed to physical proximity (such as agriculture), currently under lockdown or can, at
least in principle, work remotely (for instance, public administration and some education subsectors).

1
 This work was inspired by a recent article in The New York Times, which also contains a graph similar to our
figure 2 (L. Gamio, The workers who face the greatest coronavirus risk, The New York Times, March 15, 2020,
https://www.nytimes.com/interactive/2020/03/15/business/economy/coronavirus-worker-risk.html, last accessed
March 25, 2020).
Italian workers at risk during the Covid-19 epidemic 5

Moreover, we find that the first lockdown targeted sectors with a higher share of workers that
perform tasks in high physical proximity to other people, whereas the second decree involved more
sectors also more heterogeneous in terms of the proximity index score.
The sectors involved in the suspension of the activity, instead, do not have a higher share of workers
at high risk of infections than those that stayed open: if anything, such share is lower in shutdown
sectors. This result holds even if we do not include the health sector, which is currently operative. Last,
the share of workers who have the possibility to do their work from home is significantly higher in
sectors that were not forced to close. This implies that the number of people who needed to perform
their job in a workplace is much lower than that just implied by the lockdown measures. Therefore,
by working remotely, the risk of contagion among active workers in the service sectors has likely
declined while keeping these activities largely operational.
Finally, it is worth remarking some important limitations of the paper. First, the information contained
in the ICP survey noisily proxies of the real, unknown, characteristics of occupations. Yet, it is
informative to understand whether workers are exposed to risks, and who among them can work from
remote, in a context of an extremely sparse economic literature on these topics. Second, the scale of
the physical proximity, disease exposure and working remotely indexes is arbitrary; therefore, they
cannot be interpreted quantitatively, but only provide a qualitative judgment about these three job
characteristics. Third, our focus is on sectors and workers’ interactions among colleagues and with the
public, not among customers themselves, and thus is not informative for the overall extent of Covid-
19 contagion. For example, public transportation and theatres sectors do not necessarily involve high
level of physical proximity for workers, but do so for all other customers and users. Fourth, the LFS
data currently available refer to 2019, thus preceding the onset of the outbreak2. Finally, and most
importantly, the descriptive analysis of the lockdown measures should not be interpreted as an
evaluation of these policies for two reasons. On the one hand, the data are only cross-sectional and
refer to a period prior the implementation of the decrees. On the other, the aim of the decrees was
much broader, i.e., reducing the Covid-19 contagion among the entire population, while keeping open
core sectors, such as the health sector, the food industry and food retail trade, and all those producing
necessities. Our analysis offers only a simple descriptive characterization of the sectors that are
currently closed by the governmental decrees and of the workers who are in close physical proximity
and more exposed to diseases and infections.
Building up on the literature that studies the labour market effects of technological change and
classifies occupations according to their tasks (Autor et al. 2003; Firpo et al. 2011; Autor and Dorn
2013), this paper contributes to the characterization of economic activities along dimensions of risk
and safety for the workers during the recent epidemic. Four recent contributions complement our
work. Dingel and Neiman (2020) and Boeri et al. (2020) build indexes of working from home, but they
use different O*Net questions from the ICP ones we use. Leibovici et al. (2020) and Mongey and
Weinberg (2020) extended the occupational-level analysis by adding a measure of personal proximity
in the workplace. Our measures differ from theirs as they are aggregated at the sectoral level rather

2
 The analyses are robust if we use just the third quarter of 2019, the most recent one available, but it may suffer
of mild seasonal effects when looking at specific 4-digit subsectors. Moreover, the LFS could capture some
undeclared working arrangements and therefore overestimate regular employment.
6 Italian workers at risk during the Covid-19 epidemic

than at the occupational level. Moreover, we use data that are specific to the Italian economic
structure and account for different dimensions of safety by looking at the same time at three different
dimensions: proximity, diseases exposure and the possibility to work from home. A small, but
important economic literature also studies the diffusions of viruses through specific sectors of the
economy. Using data on viral diseases from France, Adda (2016) finds that measures aimed at reducing
interpersonal contacts by means of school and public transportation closures have a significant effect
on the incidence of a disease, although they are not cost-effective. National and international trade is
also an important vector for the spread of viruses (Boerner and Severgnini 2012; Adda 2016; Oster
2012). To our knowledge, this is the first paper that describes the characteristics of sectors in terms
of risks and possibility to work from remote relating it to the sectoral lockdowns that have now been
put in place in many countries. Such evidence will be useful in the next phase of a gradual exit from
the current lockdown, although it cannot provide a complete nor a sufficient picture, as we cannot
take into account actual working conditions of each individual worker.
The rest of the article is structured as follows. Section 2 presents the data and the methodology, while
section 3 shows some descriptive evidence on sectors at risk during an epidemic. A quantification
exercise of the lockdown measures is presented in section 4. Section 5 concludes.

2. How to measure the job-related risk of exposure to Covid-19

ICP is a survey last run in 2013 by National Institute for Public Policies Analysis (Inapp) of about 16.000
workers occupied in around 800 occupations, according to the 5-digit CP2011 classification (the Italian
equivalent of the ISCO-08 ILO’s classification). The ICP investigates the characteristics of the
occupations through a particularly rich and articulated questionnaire structured in seven sections
(knowledge, skills, attitudes, generalized work activities, values, work styles and working conditions).
The ICP directly asks workers to answer the questionnaire, rather than experts, to focus on the point
of view of those who exercise daily occupational activities under consideration and have a direct and
concrete assessment of the level of use of certain characteristics essential to carry out one’s job. The
survey describes all the professions existing in the Italian labour market: those operating in private
companies, those present in public institutions and state-owned enterprises, and those carried out by
the self-employed and regulated professionals. The survey is based on the US Occupational
Information Network (O*Net) run by the Bureau of Labor Statistics3. As the ICP is based on Italian
occupations, and not those in the US, it is more reliable in capturing characteristics of the Italian
production structure, technology and industrial relations. Thus, we possibly avoid potential biases
arising when information referring to the US occupational structure (those contained in the US O*Net
repertoire) are linked to labour market data referring to different economies such as the European
ones. The existing literature (Goos et al. 2014) and recent blog contributions (Boeri and Caiumi 2020)
use instead US O*Net data and crosswalks between US and European and Italian occupations,
respectively, which possibly reflect US-specific technology and ways of work.

3
 For reference see http://www.onetcenter.org/.
Italian workers at risk during the Covid-19 epidemic 7

The ICP survey includes questions that are particularly relevant to shed light on the potential risks for
workers in the current Covid-19 emergency4. In particular, the survey directly asks about physical
proximity and disease exposure for every profession, based on the following questions, respectively:
“During your work are you physically close to other people?” and “How often does your job expose
you to diseases and infections?”. A score that goes from a 0 to 100 scale (from less to more intense)
is then calculated for each 5-digit occupation (more details in the Appendix)5. Moreover, we built a
composite index (also ranging from 0 to 100) that proxies for the feasibility of a remote working
arrangement, which we use in additional analyses in section 4. The index is computed by taking the
average of the following seven questions: (i) importance of performing general physical activities
(which enters with reversely); (ii) importance of working with computers; (iii) importance of
maneuvering vehicles, mechanical vehicles or equipment (reversely); (iv) requirement of face-to-face
interactions (reversely); (v) dealing with external customers or with the public (reversely); (vi) physical
proximity (reversely); (vii) time spent standing (reversely; more details in the Appendix). Note that this
index is similar to the offshorability index by Autor and Dorn (2013), the face-to-face and on-site job
indexes by Firpo et al. (2011) and the measures of safe jobs recently developed by Boeri et al. (2020).
These indexes are based on similar O*Net questions to those contained in the ICP survey we use to
construct the remote working index.
In the spirit of Autor and Dorn’s routine employment share (RSH; see eq. 7, Autor and Dorn 2013), we
also calculate the percentage of sectoral employment in the top tercile of the employment-weighted
distribution of each index (physical proximity, disease exposure and working from remote) at the 4-
digit occupation level. For the physical proximity index, for instance, such percentage is calculated for
each sector as follows:

 % = 100 ∗ (∑ ∗ 1[ > 66 ]) ∗ −1 (1)

 is the employment in occupation in sector and 1[⋅] is the indicator function, which takes the
value of one if the occupation’s physical proximity is above the 66th percentile of the employment-
weighted index. To give a sense of which workers are considered in the top proximity category,
“Unqualified staff in restaurants and catering services” and “Motorboats conductors” are two of the
occupations just above the threshold of the top tercile of the employment-weighted proximity index.
Occupations that are just above the threshold of those with a highest exposure to disease are “Small
trade firms managers” and “General chemistry machine operators”, which are either exposed to

4
 The analysis by Gamio on The New York Times is based on O*Net data and carried out at occupation level,
rather than at the sector level as we do for Italy (see L. Gamio, The workers who face the greatest coronavirus
risk, The New York Times, March 15, 2020.
https://www.nytimes.com/interactive/2020/03/15/business/economy/coronavirus-worker-risk.html, last accessed
March 25, 2020).
5 −
 The standardization formula is = ( ) ∗ , where is the original answer (from 1 to 5) and
 −
and are the minimum and maximum value reported for that occupation. Each value for each occupation is
than standardized over the about twenty answers received from workers in that occupation. The index,
therefore, has no cardinal interpretation.
8 Italian workers at risk during the Covid-19 epidemic

customers or potentially hazardous material6. Last, work from remote is possible for occupations very
much heterogeneous among themselves: those just above the 66th percentile of the work from
remote index include “Members of municipal government bodies”, “Directors of service companies”,
“Radio announcers” and “Craftsmen of musical instruments”.
Finally, we derive the distribution of occupational employment at the 4-digit level across about 600 4-
digit sectors from the 2018 LFS (using the ATECO 2007 classification, the Italian equivalent of Nace
Rev. 2). These employment-based occupation weights are then used to derive indexes of physical
proximity, exposure to disease and infections and working remotely at the sectoral level, as well as
the percentage of workers in each of three top terciles of the indexes.

3. Sectors at risk

Sectors that are most exposed to infections and diseases heavily occupy workers in medical
occupations and health services7: among the top 10 sectors in terms of disease exposure index, the
first five are dentists, hospital services, veterinaries, general medicine and home care (figure 1, panel
A). While dentists and veterinaries are not at the forefront of the current health emergency, the other
are, as they are directly involved in the care of Covid-19-infected patients and in the care of the elderly
population. In terms of physical proximity, however, most sectors are currently under lockdown,
including bars, recreational and sport services, phones, clothes and shoes stores, as well as the
education industry (figure 1, panel B).

Figure 1. Top 10 sectors by diseases exposure and worker’s physical proximity
 Panel A. Top 10 sectors by disease exposure Panel B. Top 10 sectors by physical proximity

Note: The indexes go from 0 to 100 according to the definition in section 2, where 100 means the most exposed sector.
Source: Authors’ elaborations on ICP survey and LFS data

Note that hospitals are not among the top 10 sectors in terms of physical proximity possibly because
of two reasons. First, there is noise in the index (which is based on a 5-digit occupational classification

6
 Note that the diseases exposure index is very skewed and most occupations with high value of the index are in
the health sectors, while 42 percent of about 500 occupations have a value of zero.
7
 See The Lancet (2020).
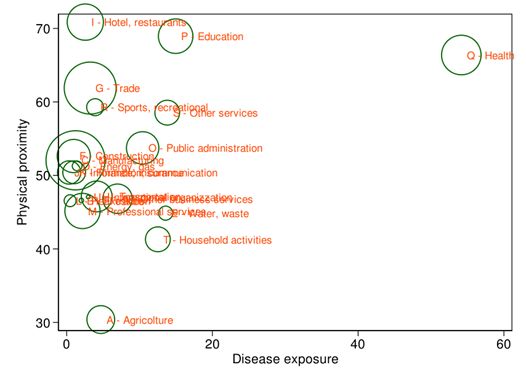
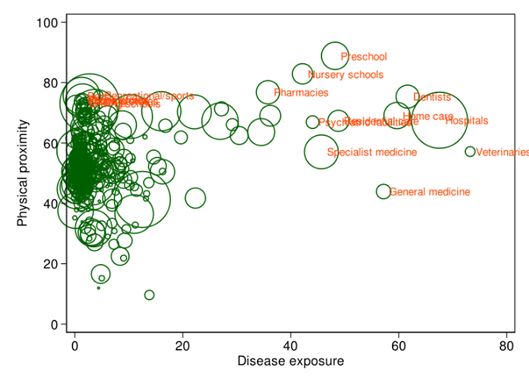
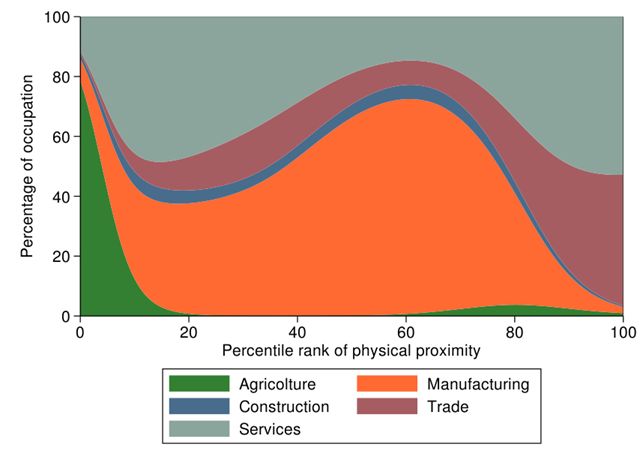
Italian workers at risk during the Covid-19 epidemic 9

and aggregated at the 4-digit sector). Second, the professional composition within the hospital sector
is more heterogeneous than, for example, in pharmacies, as it comprises doctors, but also nurses,
administrative and cleaning staff. Yet, the hospital industry is in the top 7 percent over about 600
sectors.
Figure 2 allows appreciating what sectors both require physical proximity and are exposed to diseases.
It shows, rather obviously, that workers in sectors most exposed to infectious diseases are also
operating in physical proximity, although there is a large degree of heterogeneity at the 4-digit level
(panel A). Some of these sectors are large as measured by the size of the bubble, which is proportional
to the sectoral occupation in 2019 (as better appreciated in panel B, which aggregates to 21 main
sectors). The health industry, in particular, records high values in both indexes (see also Ng et al. 2020).
However, many of its subsectors, which are among the most exposed to infectious diseases, cannot
be closed, as they serve primary needs, especially during the current health emergency. The figure
also shows that physical proximity risks are present in many large sectors of the Italian economy. Many
of these do not serve primary needs, and yet are exposed to personal contacts. The question on how,
whether and when allowing again such working activities is of outmost importance during the phase-
out of the lockdown, without compromising the efforts of the social distancing measures applied in
this recent period.

Figure 2. Correlation between exposure to infectious diseases and workers’ physical proximity
 Panel A. 4-digit sectors Panel B. 21 aggregate sectors

Note: The indexes go from 0 to 100 according to the definition in section 2, where 100 means the most exposed sector. The size of the
bubbles is proportional to sectoral employment.
Source: Authors’ elaborations on ICP survey and LFS data

To understand better the employment distribution across sectors exposed to a different degree of
personal contacts on the job we first a graph showing the occupational distribution in each percentile
rank of the physical proximity index in the main five sectors of the economy (figure 3). Most of the
employment in occupations highly exposed to interpersonal contacts is in the services sector
(including healthcare), and in retail trade. While manufacturing makes the bulk of employment
between the 30 and the 80 percentile of the physical proximity index distribution. Agriculture, which
also provides with necessary goods, accounts for most of the employment at the other end of the
spectrum (little to no physical proximity).
10 Italian workers at risk during the Covid-19 epidemic

Figure 3. Distribution of occupation by physical proximity and sector

Note: The indexes go from 0 to 100 according to the definition in section 2, where 100 means the most exposed sector. The size of the
bubbles is proportional to sectoral employment.
Source: Authors’ elaborations on ICP survey and LFS data

Table 1 shows additional information in finer sectors (21 categories), such as the average value of the
physical proximity and diseases exposure indexes (weighted by 4-digit sectoral employment), and the
percentage of workers in each sector who are in the top tercile of the nationwide index distribution
calculates as in equation (1)8. Moreover, the table provides information about the workers’
demographics distribution, namely gender and age, which appear to be crucial dimensions along
which the Covid-19 infection hits. In fact, according to the March 26 report from the Italian Centre for
Diseases Control (Istituto Superiore di Sanità), about 45 percent of the diagnosed cases to date were
males over the age of 50 and 30 percent were females over the age of 50 (overall, about 57 percent
are males)9. Note that, however, there is not yet international consensus on whether the Covid-19
disease is more lethal for males than for females.
Three main message emerges. First, as already seen, the sectors with the highest physical index are
hotel and restaurants, education, healthcare and trade (mainly retail), and whose average indexes are
all above 60. The healthcare sector is fully operational in Italy to date and it employs about 1.9 million
workers (about 8 per cent of total employment). The education sector, which employs mainly females
above the age of 50, is sizeable (1.5 million people, 6 percent of total employment), but is also largely
operational – in part, working from remote. While school and university teachers are working from
home, preschool and nursery schools – the top 2 sectors in terms of physical proximity (figure 1, Panel
B) – are currently shut down. The trade and the hotel, restaurants and bars sectors, instead, are largely

8
 Table B1 in Appendix B reports the same information for the index that capture the possibility to working from
remote.
9
 See https://www.epicentro.iss.it/coronavirus/bollettino/Bollettino-sorveglianza-integrata-COVID-19_26-marzo%202020.pdf.
Italian workers at risk during the Covid-19 epidemic 11

under lockdown (with the exception of food retail and other emergency stores such as pharmacies,
which amount to about 1 million workers): overall, they occupy almost 5 million workers, about a third
of them are over the age of 50. In the trade sector, moreover, there is high degree of heterogeneity
in terms of size and physical proximity. The index is high also in subsectors that are rather small and
involved in non-food retail (figure 4, panel A).

Table 1. Sectoral distribution: workers’ demographics composition, disease exposure and physical
 proximity
 Physical Disease
 % workers % workers % male %female % male %female
 Sectors proximity exposure Workers
 > 66th pct > 66th pct >50 y.o. >50 y.o.
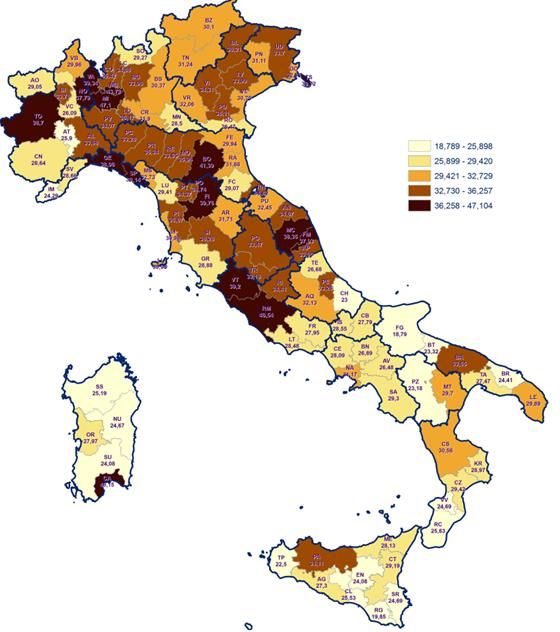
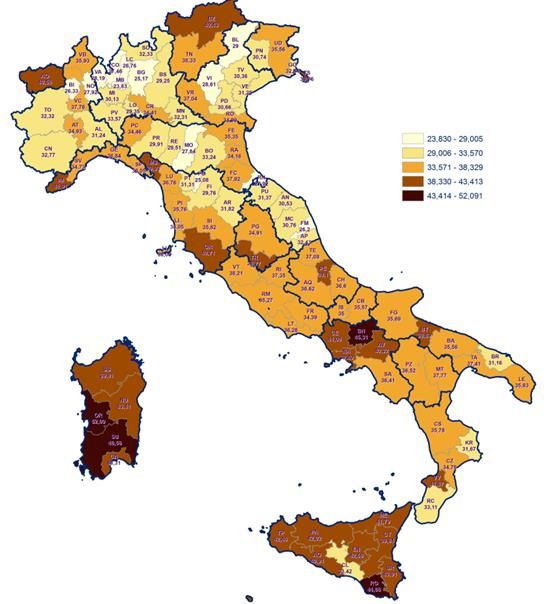
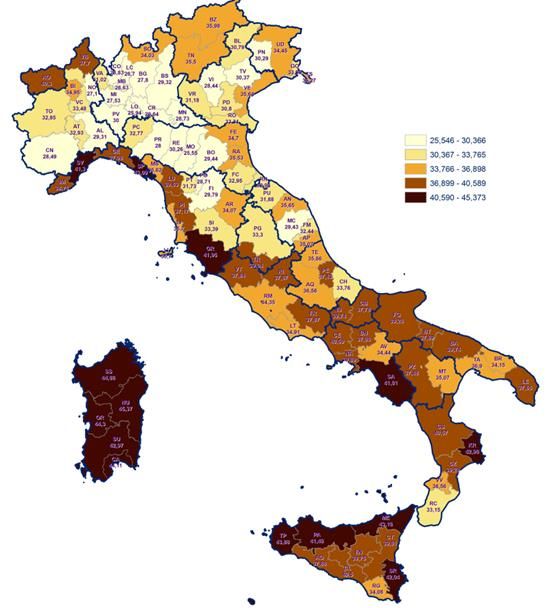
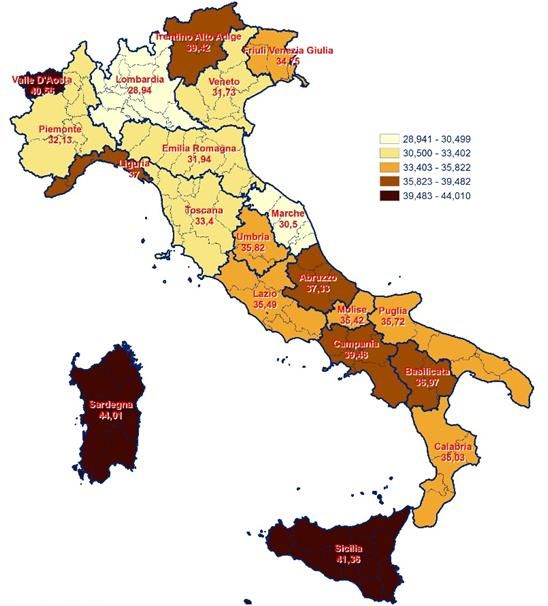
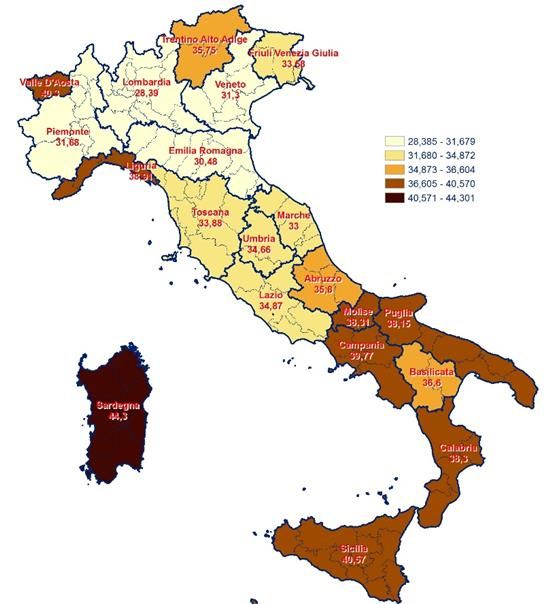
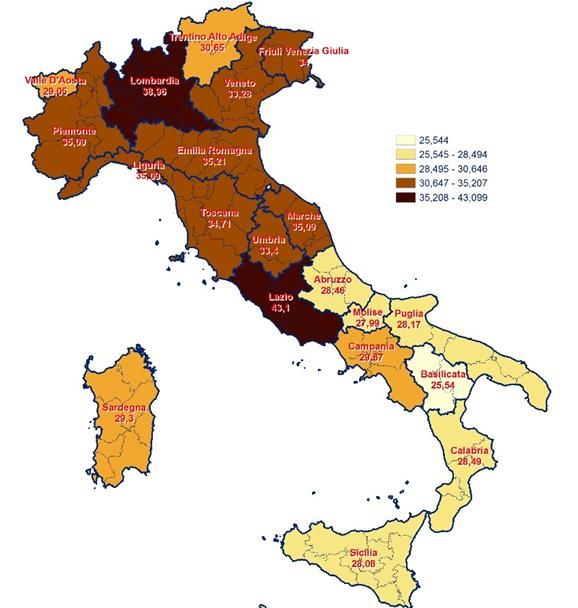
12 Italian workers at risk during the Covid-19 epidemic

remotely, but more than 50 percent of its employees are above the age of 50. Either those activities
most exposed to the public (e.g., clerks) are closed or public contacts are highly regulated.
Third, the manufacturing sector, which employs alone about the 18 percent of total employment, and
is indeed very heterogeneous in terms of physical proximity as seen in figure 3 and in figure 4 (panel
B), has an average index below the national average. Few subsectors that produce food, such as the
dairy industry and the production of fresh bread, are both large in size and workers are highly exposed
to other people in the workplace. Moreover, two thirds of the workers are below the age of 50 (about
3 million people) and are probably less exposed to the Covid-19 infections and its complications10.

Figure 4. Physical proximity index in trade and manufacturing subsectors (top vs. bottom five)
 Panel A. Trade Panel B. Manufacturing

Note: The index (Y axis) The index goes from 0 to 100 according to the definition in section 2, where 100 means the most exposed sector.
The size of the subsectors in terms of employment (X axis) is that recorded by the Istat LFS as of the the first three quarters of 2019.
Source: Authors’ elaborations on ICP survey and LFS data

Similar to table 1, table 2 reports the distribution of workers across regions, their main demographic
characteristics, the average indexes at the regional level (calculated as a regional weighted average of
sectoral the index, where weights are proportional to the employment of the sector in the region),
and the percentage of workers in the top tercile of each index. While the index rather obviously shows
much less variability, being averaged across many sectors, it is above the national average in regions
where tourism activities are prevalent (Valle d’Aosta, Trentino Alto Adige, Liguria and Sardegna).
Workers in other regions, especially in the South, may be at risk because of the demographic structure
of the local workforce: in Campania, Molise, Puglia and Basilicata about one in four workers is a male
above the age of 50, against a national average of about 22 percent. In northern regions that are
suffering from the Covid-19 epidemics, the share of male workers above the age of 50 is lower, close
to 20 percent11. Moreover, there is more variability in terms of the share of workers who are most
exposed, as measured by the two indexes.

10
 More detailed analyses down to the 4-digit sectoral level are available, but not reported in this document for
brevity.
11
 Note that Lombardia, where about 19 percent of the Italian workforce reside, also has almost 20 percent of
the workers aged 50-year-old or more, about 2.9 million people.
Italian workers at risk during the Covid-19 epidemic 13

Such variation largely depends on the sectoral distribution across regions and provinces, as better
depicted in the maps in figure B1 and B2, respectively, in the Appendix.

Table 2. Regional distribution: workers’ demographics composition, disease exposure and physical
 proximity
 Physical Disease
 % workers % workers % male %female % male %female
 Regions proximity exposure Workers
 > 66th pct > 66th pct >50 y.o. >50 y.o.
14 Italian workers at risk during the Covid-19 epidemic

the sectors that were forced to close their workplaces12. Other sectors, such as the health and food
industries as well as their value chains, were kept open; it was also strongly advised to work remotely
for those who could (including primary to college education). In this section, we describe the lockdown
in terms of employment, with a particular regard to workers exposed to risks because working in
proximity to other people, or exposed to diseases because of their age and gender. Note that our
focus is on sectors because the government enacted shutdown policies at this level. While we do not
take a stand on whether this is the optimal observational unit on which adopting this kind of policies,
it is a reasonable one, under the assumption that occupations within each sector act under perfect
complementarity. That is, within each sector, a certain amount of input in terms of occupations is
needed in order for the sector to produce output, where these amounts are given by the sector-
specific occupational employment weights13.
Table 3 reports the number of workers that were forced to stay home in each aggregated sector,
separately for the decree of March 11, and that enacted on March 25. The first decree has left 2.8
million of workers at home, which amounts to around 1.2 percent of total employment. The first
decree has specifically targeted two service sectors: “Accommodation and food service activities” and
“Arts, sports and recreational activities”. A relevant share of workers that score high in the proximity
index (e.g. bars, restaurant) characterizes “Accommodation and food service activities”. After the
March 25 decree, 78 percent of workers in this sector that perform tasks requiring a high level of
physical proximity has been forced to stop working and stay home. The stop involves a great share of
male over fifty that works in the sector (77.5 percent). The second decree enacted on March 25 shut
also all non-strategic production and trade activities, thus affecting about 8 million workers total.
Three sectors have been completely locked: “Real estate”, “Arts, sports and recreational activities”
and “Activities of extraterritorial organizations”. These sectors are small and characterized by a low
score of disease exposure index: only “Arts, sports and recreational activities” has a physical proximity
index above the national average. It is worth noting that the second decree has shut 67 percent of the
manufacturing sector, thus leaving about 2.8 million of workers at home, but only 54 percent of
workers that have a high score of physical proximity and 38 percent of those that are highly exposed
to disease have been secured by the decree. However, among manufacturing workers, almost 67
percent of those at high risk of COVID-19 infection, i.e. male over 50, were forced to stay home. On

12
 The decree of March 22, implemented on March 25, lists the sectors at the 6-digit level, which we aggregate
to 4-digit by taking simple means (the list used is the latest made available by the Ministry of Economic
Development). In about 1 percent of the cases, some 6-digit subsectors of a 4-digit sector were forced to shut
down and other were not. Thus, we attribute a value of zero if such share is below 0.5, and a value of 1 if equal
or above 0.5. Such classification may introduce measurement error in the number of workers affected reported
in table 3.
13
 Note that our quantification of the lockdown may differ from other available estimates because of different
sources of data, reference period or measurement error. In particular, we may overestimate the number of
people currently not working because the LFS accounts also for undeclared work and because the data refer to
the first three quarters of 2019. For instance, Istat reports two different, and lower, numbers of workers in the
document filed to the Italian Senate, one based on 2017 administrative data (table 4 of the Istat report) and the
other on the entire year of the 2019 LFS (table 5; see https://www.istat.it/it/files//2020/03/Aggiornamento-26-
marzo-2020-Memoria-Istat-AS-1766.pdf).
Italian workers at risk during the Covid-19 epidemic 15

the opposite, in the “Other services” sector, even if greatly affected by the lockdown – 60 percent of
workers forced to stay home – only 41 percent of male workers over 50 is affected.

Table 3. Sectoral lockdowns and workers affected
 % affected
 % affected
 among top % affected % affected
 Sector Workers % workers among top
 Sectors 66th among > 50- among males
 employment affected affected 66th physical
 diseases y.o. > 50-y.o.
 proximity
 exposure

 Panel A. Lockdown implemented on March 11, 2020
 G - Trade 3,283,268 1,070,839 32.6 43.1 13.7 29.9 25.6

 I - Hotel, restaurants 1,510,284 1,089,357 72.1 78.6 68.2 63.1 71.3
 J - Information,
 619,220 4,769 0.8 4.0 2.8 0.3 0.4
 communic.
 P - Education 1,580,162 40,324 2.6 2.6 2.1 1.2 2.1

 R - Sports, recreational 317,876 254,078 79.9 85.0 92.5 78.6 74.5

 S - Other services 709,981 392,794 55.3 78.4 71.8 44.1 27.1

 Total economy 2.852.160 12.2 27.4 13.2 8.5 7.4

 Panel B. Additional lockdown implemented on March 25, 2020
 A - Agricolture 887,192 53,235 6.0 41.1 1.9 8.4 10.5
 B - Mining and
 24,965 15,317 61.4 30.1 63.3 71.8 73.6
 quarrying
 C - Manufacturing 4,318,815 2,885,884 66.8 54.3 37.9 66.4 67.2

 F - Construction 1,331,231 809,392 60.8 78.9 48.8 63.7 64.3

 G - Trade 3,283,268 1,758,205 53.6 55.9 26.5 54.1 55.2

 I - Hotel, restaurants 1,510,284 1,171,420 77.6 80.5 71.9 70.7 77.5
 J - Information,
 619,220 4,769 0.8 4.0 2.8 0.3 0.4
 communic.
 L - Real estate 164,294 164,294 100.0 100.0 100.0 100.0 100.0
 M - Professional
 1,512,435 70,956 4.7 30.6 3.6 3.3 2.2
 services
 N - Other business
 1,034,091 407,059 39.4 43.4 23.3 38.1 46.8
 services
 P - Education 1,580,162 40,324 2.6 2.6 2.1 1.2 2.1

 R - Sports, recreational 317,876 317,876 100.0 100.0 100.0 100.0 100.0

 S - Other services 709,981 430,009 60.6 79.1 71.9 52.0 41.5

 T - Household activities 747,521 5,695 0.8 0.9 0.9 0.7 2.0
 U - International
 14,442 14,442 100.0 100.0 100.0 100.0 100.0
 organiz.
 Total economy 8,148,878 34,9 36.3 18.7 29.4 35.1

Note: The table reports the sectoral employment, as reported by the Istat LFS as of the first three quarters of 2019. The percentage of
workers exposed to physical proximity and disease exposure is calculated as described in equation (1).
Source: Authors’ elaborations on ICP survey, LFS data and sectors under lockdown listed in the governmental decrees of March 11 and
March 22 (implemented on March 25)

After March 25, only few sectors are fully operative: Energy and gas, Water supply and waste
management, Transportation and storage, Finance and insurance, Public administration and, rather
obviously, the Health and social assistance and the agricultural sectors (note that a very small
agricultural subsector involved in forestry activities has been put under lockdown). Many workers in
Energy, Finance, and in the Public administration have the possibility to work from remote. Given the
16 Italian workers at risk during the Covid-19 epidemic

share of those who can easily work from home (table B1 in the Appendix), there could up to 3 million
persons who are currently working in open sectors, but not in a workplace.14
To understand better whether sectors that were forced to close were also more exposed to risks, we
correlate the sectoral lockdowns with the physical proximity and disease indexes in a simple OLS
regression. Two main caveats about this analysis. First, the indexes have no quantitative meaning by
themselves, so the coefficients of the regression carries little information. Second, the goal of the
Government was not that of targeting most exposed sectors, but that of slowing down the epidemics
for the entire population. Therefore, our analysis is not meant at evaluating the governmental policies,
but to describe how these affected certain sectors and workers.
Table 4 reports the correlations at sectoral level between the lockdown indicators and the indexes of
physical proximity and diseases exposure. These results indicate that the first lockdown targeted
sectors where workers’ physical proximity was particularly high (panel A), while this was much less so
if we consider the March 25 lockdown that involved way more sectors. In terms of exposure to
diseases (panel B), instead, none of the policy measures seems to have interested sectors with a high
level of the index, and if anything they hit sectors with a lower value of the index. However, this is
partly expected because the health industry (the most exposed to diseases and infections) has never
been included among the shutdown sectors (and it is excluded from the analysis in columns (2) and
(4)), nor was the education industry, which is currently operating from remote15.

Table 4. Lockdowns and indexed and the sectoral level
 (1) (2) (3) (4)
 Panel A Physical proximity Physical proximity Physical proximity Physical proximity
 Lockdown 12.691** 13.031**
 11/3 (1.242) (1.239)
 Lockdown 1.800* 2.426**
 25/3 (0.746) (0.735)
 Obs. 603 591 603 591
 R2 0.127 0.144 0.009 0.018
 Health ind. No No
 Panel B Disease exposure Disease exposure Disease exposure Disease exposure
 Lockdown 0.320 1.264
 11/3 (0.833) (0.786)
 Lockdown -3.741** -2.072**
 25/3 (0.639) (0.423)
 Obs. 603 591 603 591
 R2 0.000 0.004 0.052 0.039
 Health ind. No No
Note: The table reports OLS regression coefficients and heteroscedastic-robust standard errors (in parenthesis). The average sectoral indexes
go from 0 to 100 according to the definition in section 2, where 100 means the most exposed sector. + p
Italian workers at risk during the Covid-19 epidemic 17

4.2 Workers most exposed at risk and sectoral lockdowns
The analysis above is uninformative about whether these policies implicitly also targeted workers at
high risk. Tables 5 and 6 report simple OLS regressions of the share of workers at high risk on the
sectoral lockdown dummies (column 1): in the other columns we report different specifications, in
turn excluding the health industry and weighting the regressions by sectoral employment16. Panel A
of table 5 reports as outcome variable the share of workers in the top tercile of the physical proximity
index, defined as in equation (1). These simple correlations suggest that the first decree involved
sectors with a relatively higher percentage of workers at high risk, having involved workers in the
restaurants and accommodation industries and in some retail stores: such percentage is higher by up
to 52 percentage points. The second decree, by targeting many more sectors, was not significantly
associated with a high share of workers at risk: notably, also the R-squared drops from 0.28 in column
(3) to 0.01 in column (6). Similar to what is shown in the previous table, the correlations differ when
looking at the share of workers exposed to the disease: the first decree did not keep home people at
high risk of diseases, while the second one, if anything, lets sectors open where the percentage of
people exposed to diseases was higher by up to 17.8 percentage points. Again, this is partly due
because education was not a targeted sector, but it does not explain the entirety of the effect (results
available upon request).

Table 5. Percentage of workers in the top tercile of risk indexes and sectoral lockdown
 (1) (2) (3) (4) (5) (6)
 % Empl. Top66 % Empl. Top66 % Empl. Top66 % Empl Top66 % Empl. Top66 % Empl. Top66
 Panel A
 Proximity Proximity Proximity Proximity Proximity Proximity
 Lockdown 41.977** 42.968** 51.956**
 11/3 (4.487) (4.480) (6.476)
 Lockdown 0.624 2.344 6.936
 25/3 (2.093) (2.057) (7.919)
 Obs. 603 591 591 603 591 591
 R2 0.181 0.204 0.279 0.000 0.002 0.010
 Health ind. No No No No
 Empl-we'd Yes Yes
 % Empl. Top66 % Empl. Top66 % Empl. Top66 % Empl. Top66 % Empl. Top66 % Empl. Top66
 Panel B
 Disease Disease Disease Disease Disease Disease
 Lockdown 3.876 5.346 8.609
 11/3 (4.314) (4.298) (11.173)
 Lockdown -13.563** -11.127** -17.879**
 25/3 (1.978) (1.899) (6.851)
 Obs. 603 591 591 603 591 591
 R2 0.002 0.003 0.008 0.071 0.055 0.074
 Health ind. No No No No
 Empl-we'd Yes Yes
Note: The table reports OLS regression coefficients and heteroscedastic-robust standard errors (in parenthesis). The average sectoral indexes
go from 0 to 100 according to the definition in section 2, where 100 means the most exposed sector. + p
18 Italian workers at risk during the Covid-19 epidemic

Table 6 shows another important dimension of risk, that of workers’ demographics: in particular, we
focus on male workers above the age of 50. The regressions results indicate that there was a negative
association between the sectors locked-down and their percentage of above-50 male workers;
namely, the sectors that stayed open had a higher share of workers who were male above the age of
50. The second lockdown, by targeting many sectors, hits indistinctively sectors regardless of their
percentage of above-50 male workers.

Table 6. Percentage of male workers above the age of 50 and sectoral lockdown
 (1) (2) (3) (4) (5) (6)
 % Males >50- % Males >50- % Males >50- % Males >50- % Males >50- % Males >50-
 y.o. y.o. y.o. y.o. y.o. y.o.
 Lockdown -6.798** -7.076** -10.407**
 11/3 (2.454) (2.455) (1.674)
 Lockdown 1.778 1.320 -0.653
 25/3 (1.218) (1.223) (2.176)
 Obs. 603 591 591 603 591 591
 R2 0.014 0.016 0.104 0.004 0.002 0.001
 Health ind. No No No No
 Empl-we'd Yes Yes
Note: The table reports OLS regression coefficients and heteroscedastic-robust standard errors (in parenthesis). The percentage of male
workers is calculate over the total sectoral employment. + p
Italian workers at risk during the Covid-19 epidemic 19

The results in table 7 confirm this hypothesis: on average, the sectors that were shut down by the two
decrees, had a lower share of workers with a high possibility to work from remote: this goes from
about 29 percent after March 11 decree, to 18 percent after the March 25 adoption of the second
decree. The much broader scope of this latter lockdown, also reflected in a lower R-squared (see
columns (3) and (6)), may have contributed few workers with a lower need to work from a specific
workplace to keep working from home.

5. Conclusions

This paper is the first, to our knowledge, that describes the sectors and workers most exposed to risks
during an epidemic, such as the recent COVID-19 outbreak. We do this in the Italian context by creating
synthetic indexes that proxy for physical proximity in the workplace, exposure to diseases and
infections, and the possibility to work remotely at the occupational level. Such information is obtained
from a very detailed occupational characteristics survey, ICP, the Italian equivalent to the BLS O*Net.
These indexes, on about 800 occupations, are then matched to sectoral employment data recorded
by the 2019 Italian LFS. We find that several activities, mainly in trade, personal services and leisure
sectors are not exposed to infections and diseases, but need physical proximity to operate. The
number of workers employed in Italy whose physical proximity index is above the national average,
excluding healthcare and necessary goods, is above 6.5 million.
We then describe whether, and to what extent, the lockdown measures adopted by the Italian
Government involved sectors with a relatively higher percentage of workers at high risk of proximity
and disease, and a higher proportion of workers whose activities can be easily carried out from home.
The sectoral lockdowns put in place by the Italian Government in March 2020 involved up to about 8
million workers. The lockdowns targeted sectors that, on average, had a relatively higher share of
workers who operate in physical proximity, but not sectors with a higher exposure to infections, even
excluding the health and the education industries. Our results also show that the sectors whose
activities have not been suspended involve a larger share of workers who can work from home.
The evidence we provide in this paper can inform policy decisions on the implementation of the
lockdown phasing-out, without compromising the efforts of the recently adopted social distancing
measures, and by preserving workers’ health. For instance, it can provide valuable information for
policy makers who plan to adopt strategies such as letting young adults coming back to work (and
being isolated from the elderly even in their private lives), while those at higher risk, because of their
demographics characteristics, should work from home as much as possible (Ichino et al. 2020). The
paper, however, does not take into account many important dimensions, such as interactions across
sectors and among workers’ of different sectors (through input-output linkages) and interactions
occurring during commuting. Further research in these areas, as well as research that strengthen our
understanding of which professional groups and sectors can safely operate from remote (as in Boeri
et al. 2020), is clearly warranted.
20 Italian workers at risk during the Covid-19 epidemic

Appendix

A. Further description of the Italian Sample Survey on Professions

A1. Institutional details
The Italian Sample Survey on Professions (ICP) was jointly created by the National Institute for Public
Policy Analysis (Inapp) and the National Institute of Statistics (Istat), late in 2004. It is currently carried
out by Inapp in the context of the initiatives launched for the construction and constant updating of a
permanent national system for the observation of professional needs. The survey, of institutional
relevance, is included in the National Operational Program - Systems of active employment policies
(PON SPAO), co-financed by the European Social Fund, 2014-2020 programming period. It provides an
innovative contribution to the production of statistical information on employment. Traditional data
on employment regard methods and degrees of participation in the labour market. They usually
quantify the composition of main aggregates of the working - age population and sometimes
investigate some the qualitative aspects, the tasks performed and the equipment used by the various
occupations.

The information recorded during the survey is used to improve public policies and investments for the
training of workers in our country and to reduce the gap between the current knowledge of workers'
skills and those really necessary for the productive world to respond in effective way to market
demands. Thus, ICP may represent a relevant instrument to design tailored policies on specific local
needs.

A2. Sample design
The workers interviewed in the context of the sample survey are around 16.000, representative of the
approximately 800 professional units (PUs), which cover the entire Italian Classification of professions
(CP 2011, the Italian equivalent to the international classification ISCO-08) at the highest level of detail
(5-digit). Few occupations are not covered by the survey, mainly armed forces officers, supervisors
and troops (about 240,000 workers in 2018). The selection of the sample of workers takes place from
lists of companies or entities in which it is highly probable to identify the PUs under investigation. A
mixed strategy is envisaged for sample selection. The procedures for extracting the names of the
workers to be interviewed vary in fact, depending on the context in which the work is carried out:
i) occupations in private businesses: for each profession a list of 120 companies is extracted from
 the statistical archive of the active enterprises (Istat ASIA). The extraction is carried out on the
 subset of companies that they declare to carry out an economic activity pertaining to the PU in
 question, that is to say those which maximize the probability of identifying within them the
 workers of such a profession. Moreover, in the extraction, the stratification based on the
 geographical location of companies and their size in terms of number of employees is ensured.
ii) occupations in public institutions: a list of 120 entities is created. It is extracted from Istat internal
 archives or requested ad hoc to external institutions. Also in this case the extraction is carried
 out on archives of institutions related to the professions being investigated, stratifying on the
 basis of the single geographical location of entities.
Italian workers at risk during the Covid-19 epidemic 21 iii) occupation in regulated professions: For each profession of this third type, i.e. regulated by a specific professional register, a list of 120 names is created, being extracted from the members of the Order. The archives of the members of the registers are requested from the provincial colleges selected by Istat on the basis of a territorial representativeness criterion. The administration of the questionnaire requires a random rotation of the sections based on methodological needs. The sampling plan was defined in close scientific and methodological collaboration between Inapp and Istat. A3. Structure of the survey and main variables The survey is composed by seven sections: knowledge (33 questions, regarding both importance and complexity); skills (35 questions, regarding both importance and complexity); attitudes (52 questions, regarding both importance and complexity); generalized work activities (41 questions, regarding both importance and complexity); values (21 questions); work styles (16 questions); working conditions (57 questions). The main variables used in the paper, exposure to disease or infection, physical proximity and working remotely, are constructed on the ICP questions described in table A1. The answer to these questions are on a 0-5 scale based on how frequent or important is the activity, work style or working conditions (where 5 means very frequent or very important). Table A1. Variables description Entered as Code Title Question its reverse Exposure to disease or infection H.29 Exposed to disease or How often does this job require exposure to disease/infections? infections Physical proximity H.21 Phisical proximity To what extent does this job require the worker to perform job tasks in close physical proximity to other people? Working remotely G.16 Performing general physical Performing physical activities that require considerable use of your arms and yes activities legs and moving your whole body, such as climbing, lifting, G.19 Working with computers Using computers and computer systems (including hardware and software) to program, write software, set up functions, enter data, or process information. G.20 Maneuvering vehicles, Running, maneuvering, navigating, or driving vehicles or mechanized yes mechanical vehicles or equipment, such as forklifts, passenger vehicles, aircraft, or water craft. equipment H.1 Face-to-face discussions How often do you have to have face-to-face discussions with individuals or yes teams in this job? H.8 Deal with external customers How important it is in carrying out your work to interact in first person with yes external customers (for example in a retail store) or in general with the public (such as the traffic policeman) H.21 Physical proximity To what extent does this job require the worker to perform job tasks in close yes physical proximity to other people? H.39 Spend Time Standing How much does this job require standing? yes
22 Italian workers at risk during the Covid-19 epidemic

B. Additional tables and figures

Table B1. Sectoral and regional distributions: working from remote

 Working from % workers > Sector Working from % workers > Regional
 Sectors Regions
 remote index 66th pct employm remote index 66th pct employm.

 A - Agricolt. 46.4 9.2 887,192 Piemonte 49.6 35.1 1,823,579

 B - Extraction 53.8 38.6 24,965 Valle d’A 46.6 29.0 55,631

 C -Manufact. 51.7 33.9 4,318,814 Lombardia 50.6 39.0 4,478,052

 D - Energy 59.1 70.4 113,241 Trentino 47.8 30.6 499,500

 E - Water 52.0 29.0 241,209 Veneto 48.9 33.3 2,169,356

 F - Construct. 42.2 13.6 1,331,231 Friuli VG 48.9 34.0 510,690

 G - Trade 40.3 15.3 3,283,268 Liguria 48.2 35.1 612,689

 H - Transp. 50.6 30.2 1,137,764 Emilia R. 49.8 35.2 2,030,784

 I - Accomod. 34.6 7.4 1,510,283 Toscana 48.6 34.7 1,603,042

 J - Info, com. 66.8 91.5 619,220 Umbria 48.3 33.4 360,764

 K - Finance 61.6 72.9 635,502 Marche 49.0 35.1 636,423

 L - Real est. 60.3 47.2 164,294 Lazio 50.7 43.1 2,392,163

 M - Profess. 65.5 92.5 1,512,434 Abruzzo 47.5 28.5 497,186

 N - Other bus 53.5 31.4 1,034,091 Molise 47.2 28.0 108,224

 O - Public ad 55.3 73.0 1,244,711 Campania 47.2 29.7 1,653,137

 P - Education 48.6 19.0 1,580,162 Puglia 46.8 28.2 1,237,639

 Q - Health 42.9 23.0 1,923,859 Basilicata 47.3 25.5 189,381

 R - Sports 48.6 44.4 317,876 Calabria 47.3 28.5 544,714

 S - Oth. Serv. 43.5 26.8 709,981 Sicilia 46.7 28.1 1,356,139

 T - HH act. 53.5 54.6 747,521 Sardegna 46.1 29.3 592,970

 U - Inter. Org. 61.2 74.4 14,442

 Tot. economy 49.0 34.6 23,352,062 Italy 49.0 34.6 23,352,062

Note: The table reports the sectoral and regional employment, as reported by the Istat LFS as of the first three quarters of 2019. The average
working from remote indexes reported are weighted by the 4-digit employment in each sector and region, respectively. The average sectoral
indexes go from 0 to 100 according to the definition in section 2, where 100 means the most exposed sector. The percentage of workers
that have the possibility to work from remote is calculated as described in equation (1).
Source: Authors’ elaborations on ICP survey and LFS data
Italian workers at risk during the Covid-19 epidemic 23

Table B2. Percentage of workers in the top 25 percent of risk indexes and sectoral lockdown
 (1) (2) (3) (4) (5) (6)
 % Empl. Top75 % Empl. Top75 % Empl. Top75 % Empl Top75 % Empl. Top75 % Empl. Top75
 Panel A
 Proximity Proximity Proximity Proximity Proximity Proximity
 Lockdown 27.672** 28.740** 44.653**
 11/3 (3.605) (3.592) (8.114)
 Lockdown
 25/3 -0.928 0.945 4.941
 Obs. (1.643) (1.565) (7.732)
 R2
 Health ind. 603 591 591 603 591 591
 Empl-we'd 0.127 0.158 0.263 0.001 0.001 0.007
 % Empl. Top75 % Empl. Top75 % Empl. Top75 % Empl. Top75 % Empl. Top75 % Empl. Top75
 Panel B
 Disease Disease Disease Disease Disease Disease
 Lockdown 5.378 6.957+ -0.563
 11/3 (3.865) (3.842) (8.674)
 Lockdown
 25/3 -11.871** -9.205** -16.998**
 Obs. (1.740) (1.611) (5.135)
 R2
 Health ind. 603 591 591 603 591 591
 Empl-we'd 0.004 0.008 0.000 0.070 0.052 0.083
Source: Authors’ elaborations on ICP survey and LFS data and sectors under lockdown listed in the governmental decree of March 11 and
March 22 (implemented on March 25)
Note: The table reports OLS regression coefficients and heteroscedastic-robust standard errors (in parenthesis). The percentage of workers
in the top 25 percent of each index is calculated as described in equation (1). + p
24 Italian workers at risk during the Covid-19 epidemic

Table B4. Percentage of workers in the top 50 percent of risk indexes and sectoral lockdown
 (1) (2) (3) (4) (5) (6)
 % Empl. Top50 % Empl. Top50 % Empl. Top50 % Empl Top50 % Empl. Top50 % Empl. Top50
 Panel A
 Proximity Proximity Proximity Proximity Proximity Proximity
 Lockdown 31.609** 32.349** 40.954**
 11/3 (3.704) (3.703) (5.130)
 Lockdown
 25/3 4.391* 5.752** 15.757*
 Obs. (2.174) (2.170) (6.200)
 R2
 Health ind. 603 591 591 603 591 591
 Empl-we'd 0.094 0.103 0.195 0.007 0.012 0.059
 % Empl. Top50 % Empl. Top50 % Empl. Top50 % Empl. Top50 % Empl. Top50 % Empl. Top50
 Panel B
 Disease Disease Disease Disease Disease Disease
 Lockdown 33.299** 34.527** 22.302*
 11/3 (4.132) (4.125) (8.644)
 Lockdown
 25/3 -14.196** -12.306** -17.729**
 Obs. (2.399) (2.390) (6.623)
 R2
 Health ind. 603 591 591 603 591 591
 Empl-we'd 0.081 0.093 0.048 0.055 0.043 0.062

Note: The table reports OLS regression coefficients and heteroscedastic-robust standard errors (in parenthesis). The percentage of workers
in the top half of each index is calculated as described in equation (1). + p
You can also read