Flood Mapping for the Nation - A Cost Analysis for Completing and Maintaining the Nation's NFIP Flood Map Inventory January 2020 - Naturally ...
←
→
Page content transcription
If your browser does not render page correctly, please read the page content below
Flood Mapping for the Nation
A Cost Analysis for Completing and Maintaining the
        Nation’s NFIP Flood Map Inventory

                     January 2020

                ASFPM Flood Mapping for the Nation Report
                             January 2020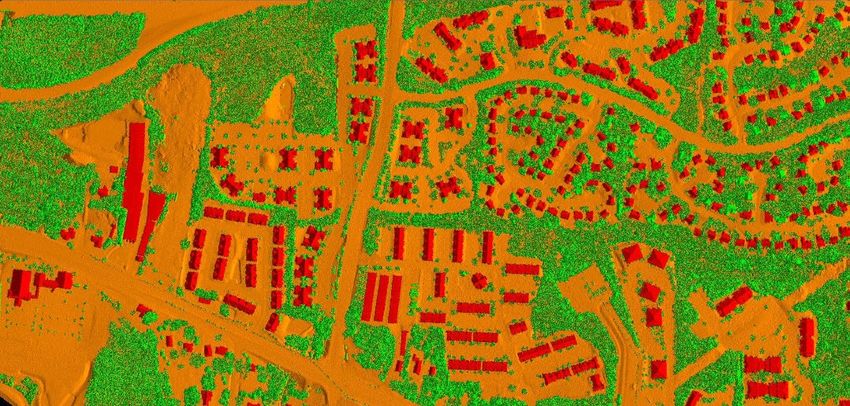
Cover Image: Estimated Base Flood Elevation (estBFE) Viewer
Screenshot of FEMA Region VI BFE viewer. Base Level Engineering (BLE) assessments are
produced using high resolution ground data to create technically creditable flood hazard
information that may be used to expand and modernize FEMA’s current flood hazard inventory.
https://webapps.usgs.gov/infrm/estBFE/ (accessed December 2019)

                        Flood Mapping for the Nation
A Cost Analysis for Completing and Maintaining the Nation’s
                  NFIP Flood Map Inventory
                                      January 2020

                    Association of State Floodplain Managers, Inc.
                                 8301 Excelsior Drive
                              Madison, Wisconsin 53717
                                     608.828.3000
                                    www.floods.org

The Association of State Floodplain Managers Inc. (ASFPM) published this report as part of its
mission to promote education, policies and activities that mitigate current and future losses,
costs and human suffering caused by flooding. Founded in 1977, the organization had over
19,000 members in 2019, including members in 37 state chapters. ASFPM supports professionals
involved in floodplain management, flood hazard mitigation, flood preparedness and flood
warning and recovery. Members represent local, state and federal government agencies, citizen
groups, private consulting firms, academia, the insurance industry and lenders.

Suggested Citation:
Association of State Floodplain Managers. 2020. Flood Mapping for the Nation: A Cost Analysis
for Completing and Maintaining the Nation’s NFIP Flood Map Inventory. Madison, WI.

                               ASFPM Flood Mapping for the Nation Report
                                            January 2020

                                                   i
Flood Mapping for the Nation

Executive Summary
Since the inception of the National Flood Insurance Program (NFIP) in 1969, the nation has
invested $6.6 billion ($10.6 billion in 2019 dollars) in flood hazard mapping to date, and
realized multiple benefits from that investment. These benefits go beyond its uses for the NFIP
to include community planning, design and construction of key infrastructure such as highways,
bridges, water treatment facilities and much more. Commercial, private and public safety uses of
flood hazard information reduce flood losses that would otherwise be paid for by taxpayers
through federal and state disaster assistance. With a 2-to-1 benefit ratio, the $10.6 billion in
investment equates to nearly $22 billion in savings from avoided flood damages.
Direct average annual flood losses have increased from approximately $4 billion per year in the
1980’s to roughly $17 billion per year between 2010 and 2018. These direct losses are likely
under-reported and do not include indirect losses related to business closures, lost tax revenue,
and public and mental health costs that often disproportionality impact socially vulnerable
communities more. With increases in frequency and amount of heavy rainfall and hurricanes due
to climate change and increased development pressure in coastal areas and watersheds, flood
losses are expected to continue their upward trend.
We are far from completing the initial job of mapping the nation. Complete and adequate flood
hazard mapping for the nation would reduce current and future flood losses. Roughly 1.14
million miles of streams have been mapped out of the approximately 3.5 million miles of
streams in the country, meaning only 33% of the rivers and streams in the country have flood
hazard information available. Existing maps must be continually reviewed and updated to keep
them accurate and the remaining 2.3 million miles of streams need flood hazard maps.
The Association of State Floodplain Managers (ASFPM) has developed an estimate of the total
cost to adequately complete and maintain flood hazard mapping for all U.S. communities based
on the parameters specified in the Biggert-Waters Flood Insurance Reform Act of 2012. This
estimate shows the cost to complete flood mapping for the nation ranges from $3.2 billion to
$11.8 billion (basis for cost difference explained on p. 14). The steady-state cost to then
maintain accurate and up-to-date flood maps ranges from $107 million to $480 million
annually. Congress will need to decide how quickly we need to have flood mapping available to
every community, and then set a level of funding that will achieve that goal.

                                ASFPM Flood Mapping for the Nation Report
                                             January 2020

                                                   1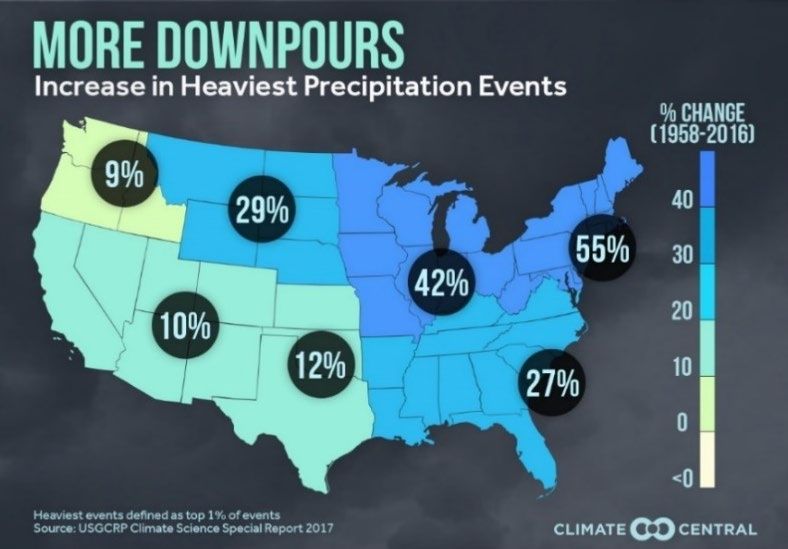
Costs and Impacts of Flooding
Since the beginning of 2017, the nation
has experienced 11 U.S. billion-dollar
weather disasters resulting from
hurricanes and flood-related events.
Sadly, three of the costliest hurricanes
resulting in heavy flood losses occurred
in 2017. Hurricane Harvey was the
second costliest on record and 2017 set
the record for the most disasters and
costs in the US. The cost of the top five
hurricanes since Katrina in 2005 reach
almost $500 billion.
Floods are the leading cause of natural
disaster losses in the United States, having cost approximately $155 billion in property damage
since 2010 and accounting for a majority of federally declared natural disasters.
Direct average annual flood losses have jumped from approximately $4 billion per year in the
1980s, to nearly $17 billion per year between 2010 and 2018, with some years far beyond that.

        Average annual flood losses have continually increased since 1990 based on analysis of the Spatial
        Hazard Events and Losses Database for the U.S. (SHELDUS) (CEMHS, 2019). www.sheldus.org

                                     ASFPM Flood Mapping for the Nation Report
                                                  January 2020

                                                        2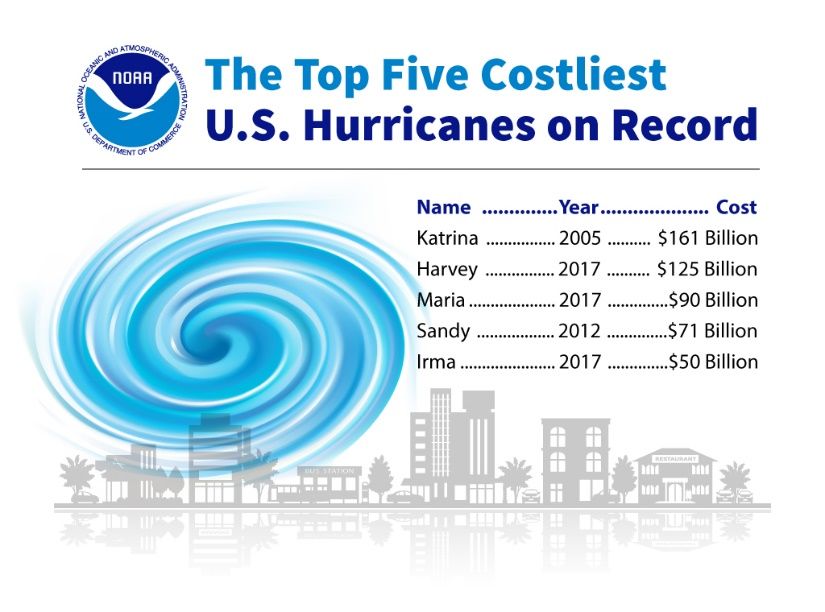
But the costs of flooding go far beyond these direct losses not included here. Unfortunately, the
direct losses reported here are likely under-reported and do not include indirect losses related
to business closures, lost tax revenue, and public and mental health costs that often more
disproportionality impact socially vulnerable communities.

Individuals and businesses.
The effects of direct flood losses on individuals has been well documented. In addition to
physical property losses, other indirect costs include lost
wages, agricultural losses for crops and livestock, expenses
for evacuating, risk for first responders and significant
physical and mental health issues following the event,             Across the nation, about 8.7
which for the most part have not been documented. For             million properties are located
businesses, the effect of flooding is pronounced.                   within flood-prone areas.

Approximately 40 to 60 percent of small businesses do not
reopen after a disaster (FEMA, 2015) and another 25            Roughly 40 to 60 percent of
percent fail within one year according to FEMA. Similar       small businesses never reopen
statistics from the United States Small Business             their doors following a disaster.
Administration indicate that over 90 percent of businesses
fail within two years after being struck by a disaster.
Businesses also experience indirect losses, such as lost
revenues from being closed which, in turn, means lost
taxes, jobs, and wages throughout the community. Businesses can additionally be impacted by
employees being unable to get to work due to transportation system failures or their own
homes being devastated. Supply lines can also be disrupted.

Communities. Communities suffer as well. Local funds earmarked for other uses must
instead go to flood repair and recovery, physical and mental health, and the use of community
resources (staff, equipment, and infrastructure) for response and rescue. Community
infrastructure can be severely impacted, including the costliest elements such as water and
wastewater treatment facilities. Debris collection and environmental cleanup can be significant.
Local taxes (income, property, etc.) are reduced, both in the short and long term. While some of
these costs will be reimbursed by the federal taxpayers in large disasters, smaller and more
common disasters do not get federally declared and those costs are borne by states and
communities as well as the property owners.

States. State infrastructure such as roads, bridges, and emergency facilities can be damaged
or destroyed. State impacts of flooding include the diversion of state resources from necessary
programs to response and recovery programs. State taxes (income, property, etc.) are reduced.

                                ASFPM Flood Mapping for the Nation Report
                                             January 2020

                                                   3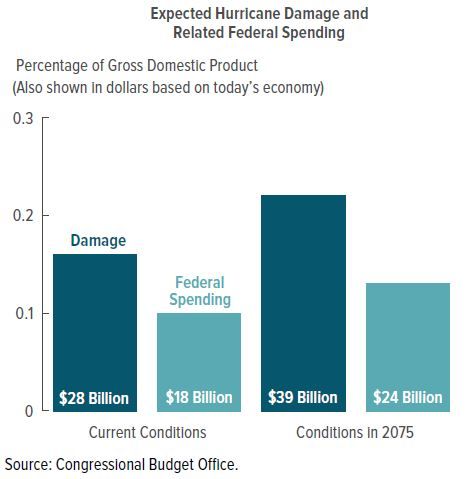
Federal Government. All taxpayers pay for the consequences of flooding. If property
owners do not have flood insurance, taxpayers provide assistance through disaster relief. The
casualty loss deduction allowance and lost wages due to business closure result in forgone tax
revenue. Insurance subsidies, through either crop or flood insurance, result in costs to the U.S.
Treasury.

What Does Flood Mapping for the Nation Mean?
FEMA is responsible for undertaking studies nationwide to
identify areas having special flood, mudslide, and flood
related erosion hazards; assess flood risk; and designate                          “All flood hazard areas
insurance zones. FEMA develops, in coordination with                               need to be mapped in
participating communities, Flood Insurance Rate Maps                                 order for the NFIP to
(FIRMs) that depict the community’s flood hazards. With the                         fulfill its potential for
passage of the Biggert-Waters Flood Insurance Reform Act of                          reducing the rate of
2012, the National Flood Mapping Program (NFMP) was                                 flood-related disaster
officially authorized and required FEMA to identify several                            costs.” (Technical
new types of flood hazards including future conditions                                Mapping Advisory
mapping described in the next section.                                                  Council, 2000)

Section 100216 of the Biggert-Waters Flood Insurance
Reform Act of 2012, Pub. L. No: 112-141, established the NFMP and describes the responsibility
of FEMA to develop and maintain flood maps that are adequate to: 1) Make flood risk
determinations and 2) Be used by state and local governments in managing development and
reduce the risks associated with flooding. To accomplish this, the 2012 Act requires that FEMA
shall review, update, and maintain NFIP maps with respect to:
    1. All populated areas and areas of possible population growth located within the 100-year
       and 500-year floodplains 1;
    2. Areas of residual risk, including areas that are protected by levees, dams, and other flood
       control structures and the level of protection provided by those structures;
    3. Ensuring that current, accurate ground elevation data is used;
    4. Inclusion of future conditions risk assessment and modeling incorporating the best
       available climate science; and
    5. Including any other relevant data from NOAA, USACE, USGS and other agencies on
       coastal inundation, storm surge, land subsidence, coastal erosion hazards, changing lake
       levels and other related flood hazards.

1ASFPM defines areas of possible population growth as any area that a property owner has the legal right to develop.
Many rural floodplain managers will attest that rural subdivisions may be developed far away from existing
population centers.

                                      ASFPM Flood Mapping for the Nation Report
                                                   January 2020

                                                         4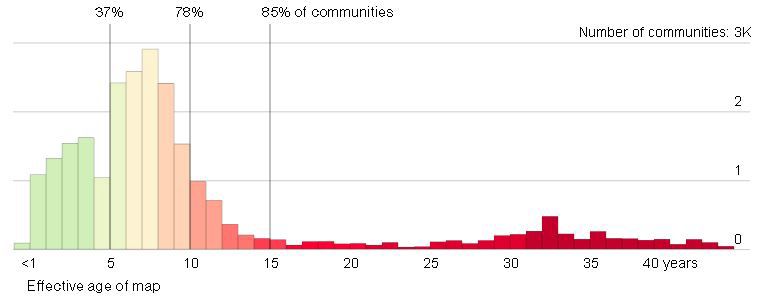
Future Conditions, Costs, and Impacts
The United States currently has a population of about 329 million, which is expected to be about
380 million by 2040 and 417 million by 2060. This population increase, combined with our desire
to live near water, will lead to significantly increased pressure to develop in flood risk areas.
Recent reports from the Government Accountability Office (GAO) and the National Climate
Assessment and Development Advisory Committee indicate that there will be significant risk
exposure to families, communities, infrastructure, and federal assets due to climate change and
sea level rise.

What is the future condition?
Future costs and impacts of flooding will be driven primarily by two factors: development and
climate change. Development occurs as a result of population changes, land use policies, and
redevelopment of existing sites. Development anywhere in the watershed increases impervious
surfaces, thus increasing runoff and flooding, Climate change is primarily realized through sea
level rise, and more intense storms (including rainfall and hurricanes). One study on the impact
of climate change and population growth on the NFIP indicated that by 2100, the 1% annual
chance floodplain would increase in size by 45% in riverine areas (AECOM, 2013). Of that
growth, 30% would be attributable to development and 70% to climate change. The same study
predicted that coastal special flood hazard areas would increase by as much as 55% by 2100.
Newer studies show that sea level rise
is accelerating (R.S. Nerem, 2018), and
that a majority of coastal communities
will experience 30 days of high tide
flooding annually by 2050 (NOAA
Office for Coastal Management, 2020).
All areas of the country are
experiencing more heavy rainfall
events, which means more flooding.
Trend data over the past 60 years –
which is not even accounting for future
conditions – shows this well. According
                                           The number of days each year with extreme rainfall is, on
to the Fourth National Climate             average, increasing in every region of the U.S. (Climate Central,
Assessment (USGCRP, 2018) “Heavy           2019)
precipitation is becoming more intense
and more frequent across most of the United States, particularly in the Northeast and Midwest,
and these trends are projected to continue in the future.”
Today, stormwater systems that were designed to handle rainfalls of 1-2 inches per hour cannot
handle 4 inches in a half hour without serious flooding.

                                    ASFPM Flood Mapping for the Nation Report
                                                 January 2020

                                                       5
In coastal areas, these conditions are exacerbated by sea level rise and more intense tropical
storms. These, in turn, mean storm surges that push further inland and more frequent high tide
flooding, sometimes referred to as “nuisance” flooding, estimated to be from 300% to 900%
more frequent within US coastal communities than it was just 50 years ago (NOAA Office for
Coastal Management, 2020).
What are the costs and impacts?
Financial impacts of flooding are high and will
be higher in the future. Trends indicate that the
federal taxpayer is paying a greater share of
disaster costs than any time in history. A recent
analysis shows that from 1989 to 2004, federal
aid as a percentage of all economic costs from
major hurricane events averaged 26% (J. David
Cummings, 2010). Currently, the federal aid
proportion has jumped dramatically to 64%
and has been forecast to stay above 60%
through the year 2075 (Congressional Budget
Office, 2016).
Importance of Flood Mapping
It is nearly impossible to take action and reduce risk from flood hazards that haven’t been
identified. While it is estimated that 13 million Americans live in the FEMA identified 1% annual
chance floodplain (or the 100-year floodplain or special flood hazard area), new models estimate
that as many as 41 million Americans may live in the true 1% annual chance floodplain today
(Wing, et al., 2018). That number increases to over 60 million for those that live in both the 1%
and the 0.2% annual chance floodplain (or the 500-year floodplain).
Maps will not prevent floods from occurring, but they are
an essential tool in avoiding or minimizing the damage to
Complete and updated
property and loss of life caused by floods, and for
flood hazard mapping for
communicating flood risk. Without complete or accurate
the nation is the
flood maps, local officials face serious difficulties in guiding
foundation to any
development away from the most hazardous areas or to
subsequent actions to
ensure that development is properly built to protect lives
reduce flood risk.
and property. The lack of maps showing which areas would
flood in the mid-20th century was the reason the private
insurance sector would not provide private flood insurance.
ASFPM Flood Mapping for the Nation Report
January 2020
6Consider the following two scenarios:
• A developer proposes a new residential subdivisions of hundreds of new homes. The
piece of land has a small stream on it which has never had a floodplain identified by
FEMA because the land was previously farmed and had low flood risk. Because the
minimum NFIP land use/development standards and community subdivision regulations
do not require the developer to generate flood data or maps, the subdivision is
developed, and homes encroach on the natural – but unidentified – floodplain. Roads
serving the homes are too low and bridges in the subdivision are undersized. Later,
because the area is now at risk (since there is now development on the former farm
field), FEMA maps the area and the identified floodplain shows the newly built structures
at risk from flooding. Homeowners are angry, local officials are angry, and everybody is
fighting the new flood maps because they don’t want flood insurance mandated for their
home. But the worst part is that we are creating tomorrow’s flood problems today
because we have not identified floodplains on all of the rivers and streams that could
potentially be developed. Flood maps must be done ahead of development.
• A homeowners’ association owns a dam. Unfortunately, the residual risk areas of that
dam (areas protected by the dam, areas impacted by a downstream release of the dam
or failure of the dam) have never been identified and several new residential subdivisions
have since been built below the dam. Then, one year, a storm strikes, weakening the
dam. The next year a bigger storm hits and the dam fails. Because nobody ever knew the
residual risk in the first place, several homes were flooded and lives were lost.
In both scenarios, complete, up-to-date flood maps would have averted disaster losses to life
and property. Yet both of these scenarios happen all over the country – hundreds of
subdivisions are being built right now on streams and rivers with no identified floodplains and
thousands of unknowing homeowners live in residual risk zones below dams.
The reality is that flood maps are used for many purposes. FEMA’s Flood Insurance Rate Maps
(FIRMs) – the primary type of flood maps in the United States – are used not only for flood
insurance, but also development regulations, and flood preparation, evacuation, and response
planning for those at risk.
Government officials use flood maps to:
• establish zoning, land-use and building standards;
• to support land use, infrastructure, transportation, flood warning, evacuation, and
emergency management planning;
• and to prepare for and respond to floods.
ASFPM Flood Mapping for the Nation Report
January 2020
7Insurance companies, lenders,
realtors, and property owners
depend on these maps to
determine flood insurance needs.
For citizens, businesses, and
communities, the FEMA flood
maps are the nation’s default
source of flood hazard
information, even though they
are primarily designed for flood
insurance.
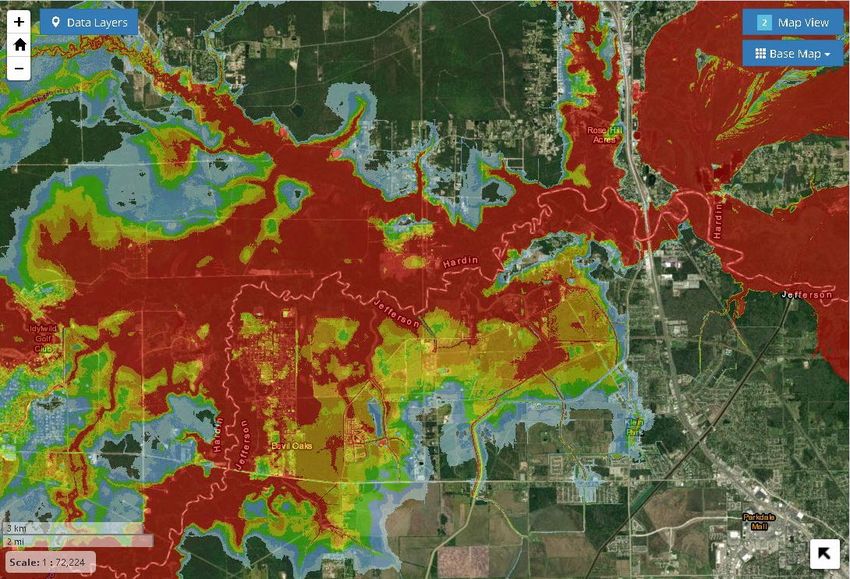
Maps depicting flood hazard
areas are not only the foundation
of the NFIP, but also the basis of
sound floodplain management
policies at the local, state, and
federal levels. Adequate, accurate Flood hazard maps showing the depth and velocity of flooding along
with buildings impacted by the flood water helps both emergency
and current maps are essential
managers and developers understand flood risk.
for the NFIP to function. If a
potential flood prone area is not
mapped, the community has no tool to adequately guide development to be safer and to
mitigate future flood losses. Local governments, with state assistance and authority, are the level
of government with the tools to reduce future flood losses. Those tools are land use standards
and building codes, which are used to guide development to lower flood risk areas, and to build
resilience in flood risk areas so future damages and risk are reduced. Without flood mapping of
the flood prone area there is no real tool to communicate flood risk to community officials,
citizens or businesses. The sale of flood insurance is not mandated in areas outside special flood
hazard areas mapped on FIRMs. Without adequate, accurate, and current maps, neither
construction nor the insurance regulatory elements of the program can be effective (Technical
Mapping Advisory Council, 2000).
Floodplain mapping is a cost-effective taxpayer investment. In 1997, FEMA conducted a
benefit-cost analysis of its proposed flood mapping program (at that time it was called Map
Modernization). Based on that analysis, floodplain mapping showed a benefit to the taxpayer of
over $2 for every $1 invested in flood mapping.
In 2008, the State of North Carolina used the same methodology as FEMA, and calculated a
benefit-cost ratio of 2.3 to 1. The North Carolina report further determined the following range
of values of avoided losses per stream mile studied:
ASFPM Flood Mapping for the Nation Report
January 2020
8Range of losses avoided
Flood Study Type
(per stream mile)
Detailed Study $5,482 - $6,166
Limited Detailed Study $1,713 - $2,539
Approximate Study $721
The North Carolina report indicates that for the 29,733 stream miles studied throughout the
state, the average benefit provided is $3,400 per year per mile and clearly shows significantly
higher benefits of having more detailed flood studies (State of North Carolina, 2008).
Also, the flood mapping program tries to maximize diverse funding sources. The program
operates through fees and appropriated funds. It incentivizes cost-sharing and leverages state
and locally collected data. In fact, for every dollar appropriated since 2012, $1.30 has been
added by alternative state, local and other funding sources.
Flood mapping reduces disaster costs. Development that complies with the floodplain
management requirements is better protected against major flood-related damage. Since flood
mapping is the basis for community floodplain management regulations, then it stands to
reason that new construction in mapped floodplains would have to comply with such codes and
be constructed to be more resilient in future disasters. In fact, buildings constructed in
compliance with NFIP building standards suffer approximately 80 percent less damage annually
than those not built in compliance (Federal Emergency Management Agency, 2012). Lower
damage amounts can be a proxy for lower impacts and demands on disaster assistance. In its
final report the TMAC indicated that a small investment in mapping can result in huge savings in
flood-related disaster assistance in the future (Technical Mapping Advisory Council, 2000).
Importance of Elevation Data
High-quality topographic or elevation data is essential in the creation of high quality flood maps
and flood hazard data. The 3D Elevation Program (3DEP) managed by the U.S. Geological Survey
(USGS) National Geospatial Program has responded to the growing needs for high-quality
topographic data. The goal of 3DEP is to complete acquisition of nationwide Lidar by 2023 to
provide the first-ever national baseline of consistent high-resolution elevation data. 3DEP is
based on the National Enhanced Elevation Assessment (NEEA) that documented “… more than
600 business uses across 34 federal agencies, all 50 states, selected local government and tribal
offices, and private and nonprofit organizations.” (USGS, 2019).
ASFPM Flood Mapping for the Nation Report
January 2020
9The 3DEP program
began in 2016 and
provides more than
$690 million annually in
new benefits to
government entities,
the private sector, and
citizens and realizes a
5:1 return on
investment. Through
Federal fiscal year 2018,
$382 million has been Lidar data can be used to extract building footprints (in red) and identify the finished
spent with an estimated floor elevation in order to quantify potential damage based on flooding depths and
to determine if buildings are above the base flood elevation. Image courtesy of John
$629 million needed to Dorman, North Carolina Flood Mapping Program.
complete high-quality
topographic data for
the country (USGS, 2019). Acknowledging how essential quality topographic data is to credible
flood hazard information, FEMA has invested over $190 million since fiscal year 2014 in LiDAR
through the 3DEP program.
History and Current Status of Flood Hazard Mapping
Funding Sources – Appropriations and Fee Income
Flood hazard mapping and risk analysis is funded through the NFIP by two methods: direct
annual appropriations from Congress, and since 1990, a Federal Policy Fee collected on receipts
from premiums of flood insurance policies. Overall funding for the nation’s flood hazard
mapping and risk analysis program varies from year to year, with direct appropriations being as
low as only $89 million as recent as FY2013, and reaching $262.5 million in direct appropriations
in FY2019. Spending authority from fee collection for FY2019 includes $188.3 million for
floodplain management and flood mapping. The combined total for FY2019 is $450.8 million
(Congressional Research Service, 2019).
As identified in the original 2013 Flood Mapping for the Nation report, the majority of the
floodplain mapping funding to produce new flood maps is derived from the direct annual
appropriation for floodplain mapping. The majority of the Federal Policy Fee is used for
operating the flood mapping program, including staffing, program management, IT
infrastructure, maintaining a call center to support FEMA customers, acquisition services, and
research and development. It also supports the cost for processing Letters of Map Change
including Letters of Map Amendments (LOMA) and Letters of Map Revision (LOMR), all of which
do not provide a significant contribution to the effort to develop new or updated maps.
ASFPM Flood Mapping for the Nation Report
January 2020
10Since the inception of the NFIP, an estimated $6.6 billion ($10.6 billion in 2019 dollars) has
been invested in the nation’s flood hazard mapping and risk analysis program. This amount
includes both appropriated and fee generated funds.
Historical Funding for FEMA Flood Mapping & Risk Analysis
$500
Original Funding
$450
Funding (2019$)
$400
$350
Dollars (Millions)
$300
$250
$200
$150
$100
$50
$0
1969
1971
1973
1975
1977
1979
1981
1983
1985
1987
1989
1991
1993
1995
1997
1999
2001
2003
2005
2007
2009
2011
2013
2015
2017
2019
Federal Fiscal Year
Return on Existing Investment in the Nation’s Flood Maps
What have been the results of investing in the nation’s flood maps to date? The NFIP now
claims there are $1.6 billion in avoided damages every year for buildings constructed in
compliance with NFIP standards (FEMA, 2018). The Federal taxpayer would have largely paid for
these losses through disaster relief and other programs. These losses avoided would have not
been possible without the flood maps. So the investment in flood mapping since the inception
of the program until now can be offset by losses avoided in just over six years.
• Over 22,000 communities participate in the NFIP. Those that have reasonably good flood
data have been able to reduce flood damages to new development. Nearly, 5.1 million
flood insurance policy holders have their financial investment in homes and businesses
protected by flood insurance. These are all potential damages that are paid through an
insurance mechanism rather than disaster assistance. Those who live at risk pay for at
least part of the cost of those decisions. NONE of this would be possible without flood
maps.
• Investment in floodplain mapping since 2003 has resulted in the creation of a digital
platform for flood maps. This was a huge undertaking given that previous flood maps
were developed using multiple, older cartographic methods. Now, the digital platform is
ASFPM Flood Mapping for the Nation Report
January 2020
11compatible with modern Geographic Information Systems, which means the maps can
be integrated into federal, state, and local systems; positioning the nation to move
quickly and more cost effectively to develop new and updated maps for every
community in the nation. Furthermore, additional informational GIS datasets can be
provided on the platform for use at the state and local level.
Cost of Flood Mapping for the Nation
Key Assumptions
To complete flood maps and flood risk data for the nation, it is necessary to make certain key
assumptions about the mapping program. Below is the list of the key assumptions made in this
report as it relates to what constitutes mapping the nation.
Assumption #1: The framework for mapping the nation going forward has been
established in the 2012 Reform Act and dovetails well with FEMA’s Risk MAP program and
previous recommendations to improve floodplain mapping. In the past, and in the absence
of clear Congressional direction, the mapping program was almost solely focused on supporting
flood insurance rating as well as serving as a tool for the adoption and enforcement of local
floodplain management regulations. However, the purpose of the National Flood Mapping
Program is clearly meant to fulfill a broader mandate – to create the nation’s flood risk data set
so states, communities, and individuals can take action to reduce losses.
FEMA’s Risk MAP program moved the discussion of flood hazard identification away from just
the 1% annual chance flood and Flood Insurance Rate Maps to identifying multiple types of
flood hazards and frequencies of flood risk. Further, the discussion has been shifted more to
future and current risk, and what the property owner/community can do to reduce or mitigate
risk, rather than whether a person is in or out of the Special Flood Hazard Area for purposes of
determining mandatory flood insurance.
The Act makes a clear and unequivocal statement that flood maps produced by FEMA will be
forward looking and inclusive of several types of flood risk data. Congress has, in effect,
acknowledged what most state and local officials already know – that the FEMA flood map data
should be the default and minimum national dataset for flood risk.
Assumption #2: Flood data and maps are developed for the entire nation. Based on the
National Hydrography Dataset (NHD), there are approximately 3.5 million miles of streams in the
nation. Currently, about 1.14 million stream miles have flood maps or just over 33% of the 3.5
million stream miles. For coastal or shoreline mapping, NOAA's official value for total length of
U.S. shoreline is 95,471 miles (NOAA, 2018). Currently, about 44,158 miles of shoreline have
flood maps or just over 46% of NOAA’s total.
FEMA’s floodplain mapping programs to this point have chosen to prioritize limited resources to
those areas of greatest population and flood insurance policies on the assumption these are the
highest risk areas. While this approach has produced accurate and detailed maps in counties
ASFPM Flood Mapping for the Nation Report
January 2020
12and communities with higher population levels (even in these communities there are flood
prone areas that have not yet been mapped), there remains much more to be done. There are
an estimated 2.3 million river and stream miles and just over 50,000 coastal miles that are
not mapped as part of a Special Flood Hazard Area (SFHA).
FEMA Community Needs Management System (CNMS) Unmapped Stream Miles. Source: FEMA
There are over 6,500 counties and communities throughout the nation identified as not having
flood maps at all and roughly 3,300 communities that have maps over 15 years old, with several
of these having paper maps over 30 years old and based on using obsolete mapping methods.
Roughly 3,300 communities (or 15% of about 22,000 NFIP communities) around the nation have
flood hazard maps that are over 15 years old, many of which are 30 years or older. Source: FEMA
Data obtained by Bloomberg News (Bloomberg News, 2017)
ASFPM Flood Mapping for the Nation Report
January 2020
13The current approach ignores lesser populated areas that have considerable flood risk, especially
in relation to the local economy, and may have rapidly developing areas with no flood data to
guide development. These communities are found all over the nation and continue to find
themselves less able to be resilient because the foundational flood data does not exist.
Unmapped flood hazard areas present a serious threat to people who may choose to buy or
build within them (Technical Mapping Advisory Council, 2000). Furthermore, much of that
development may occur without regulation and pay less than full actuarial flood insurance rates,
contributing to the NFIP deficit.
Nearly 1 million miles of streams exist on federal and state lands. While some development and
infrastructure exists on these lands, the low future development potential coupled with other
federal agencies primacy over such areas, this cost model only includes the cost to map federal
and state lands in the high-cost range scenario. ASFPM believes that mapping these areas could
have benefits; however, flood mapping could, and probably should be, developed by the owner
agency as required by the federal Executive Order 11988.
Assumption #3: The minimal flood mapping level for the nation should be based on
engineering models and include the ability to readily obtain flood elevation information.
With advances over the past decade in automated technologies to map flood hazards and risk,
and with high quality topographic data, the ability exists to map large geographic areas using
methods such as Base Level Engineering (BLE) (FEMA, 2018). This mapping would be done at a
cheaper cost and the quality would be much improved over maps produced 30+ years ago.
Even if FEMA has correctly identified the general flood hazard area, communities and citizens
need flood elevation data for important things like insurance rating, assessing actual flood risk
and making development decisions, and to plan for resilient community growth in order to truly
manage the flood risk at the local level.
Assumption #4: Up to date detailed elevation data (LIDAR or other topographic maps)
are needed anywhere flood mapping and data are to be generated. The accuracy of
elevation data has an enormous impact on the accuracy of flood maps. Having accurate
topographic data for floodplain mapping is especially critical in regions with low relief, such as
coastal areas –the very areas seeing the most significant population growth and development.
Assumption #5: Residual Risk is defined in this cost model as risk associated with levees
and inundation/failure areas below dams; however, other residual risk areas should be
identified. There is a new mandate in the law that all residual risk areas be identified, such as
those areas repeatedly flooded by stormwater. The cost of mapping urban stormwater flooding
is not included in the cost estimates for this report. It is important that TMAC work to help
further define the term and criteria.
Assumption #6: The flood map inventory must be continuously updated. Flood map data
is not static; it changes over time. Drivers of change include: 1) Change in hydrology, i.e.
ASFPM Flood Mapping for the Nation Report
January 2020
14updated rainfall records and changing storm patterns, 2) Changes in land use such as
population growth or development causing changes in runoff, 3) Need for detailed flood studies
as new areas develop, 4) Update of data based on new models, and 5) Technological
advancements that allow for more dynamic analyses and presentation of flood risk. While the
initial mapping effort for the nation must be completed, there too is an annual maintenance
cost for the entire flood map and data inventory. The federal government’s investment in the
development of flood hazard data is considerable and must not be allowed to decay as
happened in the mid-1980s and 1990s (see chart on Historical Funding for FEMA Flood
Mapping).
The Cost
The national mapping program funding needs, shown in the table below, has been broken down
into major program elements and provides a low and high cost associated with each. The basis
for these costs are the assumptions explained in the preceding section and actual cost
information obtained from FEMA, state flood mapping programs and other state and federal
agencies involved in flood mapping efforts. Due to its complexity, the data behind these
estimates is not included in this report, but is available from ASFPM upon request.
The most significant source of variability between the high and low range is due to assumptions
made related to level of riverine flood studies for a given geographic area. While good cost data
is currently available, it is important to note that changing technology as well as an assumption
of nation-wide Lidar could result in reduced costs.
Program Element Lower Range Upper Range
Topographic Data Development – 3DEP Program $ 630,000,000 $ 630,000,000
Discovery, Scoping, Risk Communication &
$ 39,000,000 $ 90,000,000
Outreach
Riverine Flood Study $ 1,819,000,000 $ 9,828,000,000
Coastal Flood Study $ 13,300,000 $ 14,900,000
Levee $ 373,000,000 $ 651,000,000
Dam Failure Inundation $ 97,000,000 $ 199,000,000
DFIRM Production with QA/QC $ 156,700,000 $ 206,000,000
Non-Regulatory Flood Risk Products $ 50,000,000 $ 153,000,000
Total $ 3,178,000,000 $ 11,772,000,000
The lower range does not include nearly 1 million miles of rivers and streams on federal and
state lands, but does use the lower cost estimates associated with the latest mapping
technology to generate minimal flood hazard data for rural areas. The upper range includes
mapping flood hazard areas on all federal and state lands to ensure mapping of the 3.5 million
ASFPM Flood Mapping for the Nation Report
January 2020
15miles of rivers and streams in the nation. The upper range also considers the higher costs
associated with urban areas and future development areas that as they become more developed
(and thus more at-risk) there is an increased need for higher levels of detailed, engineered flood
studies and thus higher costs. There is also significant variability for levee studies reflecting the
relative uncertainty of the number of levee miles and the needed level of analysis.
Program Element Lower Range Upper Range
Steady-State Map Maintenance (Annual) $ 106,900,000 $ 479,700,000
Total $ 106,900,000 $ 479,700,000
In terms of map maintenance, the largest variable has to do with assumptions of map decay – or
the accuracy of the map over time. Flood maps change over time due to several factors
including changes in topography in the watershed, changes in development and growth,
changes in precipitation, additional stream gage data, and changes in water levels in lakes and
oceans. In areas where all of these are changing rapidly, maps need to be updated much more
frequently than in some rural areas that have little growth and development. Also, accelerated
sea level rise and climate change could result in higher decay rates than are presented in this
cost estimate. All flood maps need to be periodically updated, but some more frequently than
others. The more the flood maps reflect future conditions, the less the cost of updating those
maps.
Cost Savings
The cost model developed by ASFPM for this report includes estimates based on available
information from states and FEMA, and is also based on current technology and methods of
providing flood map data, as well as the assumptions stated earlier. ASFPM believes there are
ways to achieve cost savings by leveraging funding, advances in technology and other
approaches. A few of these are presented below.
1. Efficiencies in mapping using better technology. Throughout the FEMA Map Modernization
program and in Risk MAP, FEMA has been successful in driving program efficiencies. This is
also a result of changing and improving technologies. One promising approach is called
Base Level Engineering (BLE) which uses automated flood modeling of more rural riverine
floodplain areas where high quality topographic information exists. Given that the single
biggest cost variable is riverine flood studies, the use of BLE could be a significant cost
savings to the program.
2. Leveraging other federal, state and locally collected elevation data. Some states routinely
collect and maintain statewide, high-quality LIDAR data that can be used by FEMA for flood
mapping. While contributing to the aforementioned 3DEP program, FEMA is still leveraging
considerable benefits from 3DEP to the nation’s flood mapping program.
3. Maintaining/expanding the Cooperating Technical Partners Program. The CTP Program is an
innovative approach to creating partnerships between the FEMA and participating NFIP
communities, regional agencies, state agencies, tribes and universities that have the interest
ASFPM Flood Mapping for the Nation Report
January 2020
16and capability to become more active participants in the FEMA flood hazard mapping
program. The result can be the leveraging of partner contributions to flood mapping
projects.
What remains to be done?
We are far from completing the initial job of mapping the nation. The framework for flood
mapping as prescribed by the National Flood Mapping Program (NFMP) in the Biggert-Waters
2012 Reform Act, recognizes many of these existing needs and sets a robust course for moving
forward. Unfortunately, as of January 2020, much remains to be done:
• Based on the National Hydrography Dataset (NHD) and NOAA shoreline data, there are
approximately 3.5 million miles of streams and rivers, and 95,471 miles of coastlines in the
nation. Currently, only 1.14 million stream miles and 45,128 shoreline miles have flood maps.
By this metric, only about 1/3 of the nation has been mapped.
• Over 3,300, or roughly 15%, of NFIP communities have maps over 15 years old, with many of
these over 30 years old and still having “unmodernized” paper maps. About 6,550
communities have never been mapped. Addressing both of these needs should be a priority
for FEMA.
• Many of the added mapping requirements from 2012 are still not being addressed. This
includes residual risk mapping around flood control structures and future conditions
mapping. A 2016 TMAC report reviewing the National Flood Mapping Program stated “To
create technically credible flood hazard data, FEMA needs to address residual risk areas in
the near term. Residual risk areas associated with levees and dams are of great concern.”
(Technical Mapping Advisory Council, 2016)
It should be noted that over the past several years, FEMA has stated that 90% plus of the
population has been covered by a modernized map. However, this metric grossly overstates the
population covered by a modernized map. This problem is discussed in the 2015 TMAC Future
Conditions Assessment and Modeling Report:
However, this population metric has two challenges for moving forward. First, the metric
over-predicts the population covered by a modernized map. FEMA generally studies streams
that drain a drainage area of greater than one square mile. If a census block group has 10
miles of stream and only 1 mile is studied, the current metric will count 100 percent of the
population within the census block group as being covered by a modernized map, as
opposed to the 10 percent that may actually be covered. Therefore, the current metric can
lead to a significant over-prediction of the population covered by a modernized map. This
could lead policy makers to believe that flood hazards have been more widely identified
than the reality. If the metric is changed to be more reflective of the streams studied within a
census block group, then it may more realistically illustrate that the country has flood hazard
areas defined for only somewhere between 16 percent and 22 percent of all streams.” (FEMA
Technical Mapping Advisory Council, 2015).
ASFPM Flood Mapping for the Nation Report
January 2020
17Recognizing that much of the nation still needs to be mapped to adequate standards, FEMA is
exploring ways to leverage new technologies to provide flood information more efficiently,
accurately, and consistently across the nation through the Future of Flood Risk Data initiative.
FEMA aims to provide a more comprehensive and dynamic picture of the nation's flood hazards,
accounting for residual risks and multiple flood frequencies. This information could serve as a
basis for a range of flood risk products. In moving towards this future, FEMA will need to
develop strategic partnerships with other federal agencies, the private sector, and state, local,
tribal, and territorial stakeholders. These partnerships will ensure that FEMA is leveraging the
latest data and technologies, while serving the diverse needs of its customers.
Considerations for Congress and FEMA
The National Flood Mapping Program has yet to achieve its aim: to produce a reasonably
complete set of flood data/maps for the country that identifies multiple types of flooding
hazards and also future conditions. As Congress and FEMA consider the future and funding of
the National Flood Mapping Program, the following factors should be included:
• We do what we measure. There must be an easily verifiable metric developed for the
National Flood Mapping Program that more accurately reflects the extent of the flood
mapping completed in the nation than what is currently being used. We suggest the NFIP
measure the percent of miles mapped as a metric. Unmapped miles must be studied and
added to FEMA’s inventory so that flood risk information is available to communities ahead
of development.
• Congress will need to decide how quickly we need to have flood mapping available to every
community, and then set a level of funding that will achieve that goal. The current FY2019
authorization of about $450 million for the flood hazard mapping and risk analysis program
is misleading because a much smaller amount of money is actually available (closer to $300
million) to create new flood maps. Using the median funding level of about $6-8 billion, one
could divide by 10 if we agree the mapping should be available in 10 years. Congress should
consider increasing the annual appropriation (ignoring the policy fee income since that is
spent for operating costs like LOMA, LOMR, LOMC) for the national flood mapping program
to accomplish that goal. Alternatively, some members of Congress have proposed a faster
five-year effort in which a funding surge is appropriated to finish the job of initially mapping
the nation.
• As directed by Congress in 2012, FEMA should begin providing residual risk and future
conditions products as part of all flood mapping studies as soon as possible. The TMAC in its
2015 Future Conditions Report and in its 2016 National Flood Mapping Program Review
support this view.
• The TMAC also identified the public policy hurdle related to the public availability of dam
and related facility inundation maps. Congress may want to consider a specific provision as
ASFPM Flood Mapping for the Nation Report
January 2020
18part of a future NFIP reform bill or WRDA bill that would override the DHS Security
Classification Guide for the Protection of Critical Infrastructure and Key Resources for dam
failure inundation maps as “For Official Use Only.”
• While not directly part of the National Flood Mapping Program, there is a critical need to
ensure the intentional, funded update of the nation’s rainfall frequency information which is
a major data input into flood models. This past November, ASFPM testified that NOAA
should be given the mandate and full budget to update our nation’s rainfall frequency
information at least every 10 years and this update must include future climate projections
into precipitation frequency analysis.
• ASFPM also made a similar recommendation to fully fund the critical national stream gage
and tidal gage networks. While more than 4,700 locations meet the criteria for inclusion in
the Federal Priority Streamgage (FPS) Network, only 3,600 FPS are active due to funding
limitations. These gages provide critical datasets over time so that trends can be identified.
ASFPM Flood Mapping for the Nation Report
January 2020
19Bibliography
AECOM. (2013). Impact of Climate Change and Population Growth on the National Flood
Insurance Program.
Bloomberg News. (2017). Outdated and Unreliable: FEMA’s Faulty Flood Maps Put Homeowners
at Risk. New York, New York. Retrieved from
https://www.bloomberg.com/graphics/2017-fema-faulty-flood-maps/
CEMHS. (2019). Spatial Hazard Events and Losses Database for the United States, Version 18.1.
(Online Database). Phoenix, AZ, U.S.A: Center for Emergency Management and
Homeland Security, Arizona State University.
Congressional Budget Office. (2009). The National Flood Insurance Program: Factors Affecting
Actuarial Soundness. Washington DC: The Congress of the United States.
Congressional Budget Office. (2016). Potential Increases in Hurricane Damage in the United
States: Implications for the Federal Budget. Congressional Budget Office. Retrieved from
https://www.cbo.gov/publication/51518
Congressional Research Service. (2011). National Flood Insurance Program: Background,
Challenges and Financial Status. Washington DC: Congressional Research Service.
Congressional Research Service. (2019). Introduction to the National Flood Insurance Program
(NFIP) (R44593). Congressional Research Service. Retrieved from
https://crsreports.congress.gov/
Federal Emergency Management Agency. (2012, July 24). Protecting Our Communities. Retrieved
November 15, 2012, from FEMA: http://www.fema.gov/vi/node/29615
FEMA. (2015). Retrieved February 21, 2013, from FloodSmart: https://www.fema.gov/media-
library/assets/documents/108451
FEMA. (2018). 50th Anniversary of the National Flood Insurance Program. Retrieved from 50th
Anniversary of the National Flood Insurance Program: https://www.fema.gov/nfip50
FEMA. (2018, June 6). Base Level Engineering Overview. Retrieved from Base Level Engineering
(BLE): https://www.fema.gov/media-library/assets/documents/160060
FEMA Technical Mapping Advisory Council. (2015). TMAC Future Conditions Risk Assessment
and Modeling. Washington DC.
J. David Cummings, M. S. (2010). Federal Financial Exposure to Natural Catastrophe Risk. In D.
Lucas, Measuring and Managing Federal Financial Risk. Chicago: University of Chicago
Press.
National Research Council. (2009). Mapping the Zone: Improving Flood Map Accuracy.
Washington DC: National Academies Press.
ASFPM Flood Mapping for the Nation Report
January 2020
20NOAA. (2018, June 25). How long is the U.S. shoreline? Retrieved from National Ocean Service -
Ocean Facts: https://oceanservice.noaa.gov/facts/shorelength.html
NOAA Office for Coastal Management. (2020, 01 02). Fast Facts: High Tide Flooding. Retrieved
from https://coast.noaa.gov/states/fast-facts/recurrent-tidal-flooding.html
R.S. Nerem, B. B. (2018). Climate-Change-Driven Accelerated Sea-Level Rise Detectied in the
Altimeter Area. Proceedings of the National Academy of Sciences of the United States of
America.
State of North Carolina. (2008). North Carolina Floodplain Mapping Program: 2000 - 2008
Program Review. State of North Carolina.
Technical Mapping Advisory Council. (2000). Final Report: A Summary of Accomplishments and
Recommendations 1995-2000. Washington DC.
Technical Mapping Advisory Council. (2016). TMAC National Flood Mapping Program Review.
Washington DC.
United States Geological Survey. (2011). Overview of the ARkStorm Scenario: Open File Report
2010-1312. Reston: US Geological Survey.
USGCRP. (2018). Impacts, Risks, and Adaptation in the United States: Fourth National Climate
Assessment, Volume II. U.S. Global Change Research Program, Washington, DC.
USGS. (2019). 3DEP By the Numbers. Retrieved from 3D Elevation Program (3DEP) :
https://www.usgs.gov/core-science-systems/ngp/3dep/3dep-numbers
Wing, O. E., Bates, P. D., Smith, A. M., Sampson, C. C., Johnson, K. A., Farigone, J., & Morefield, P.
(2018). Estimates of present and future flood risk in the conterminous United States.
Environmental Research Letters, 13(3). Retrieved from
https://iopscience.iop.org/article/10.1088/1748-9326/aaac65
ASFPM Flood Mapping for the Nation Report
January 2020
21You can also read