TOURISM STRATEGY 2020 - ACT Government
←
→
Page content transcription
If your browser does not render page correctly, please read the page content below

2020
TOURISM
STRATEGY
Growing the visitor
 economy 2014-20
Contents
MINISTER’S FOREWORD                                              4

INTRODUCTION                                                     5

LOOKING AHEAD TO 2020 – BACKGROUND AND CONTEXT                   6
   CURRENT NATIONAL TOURISM PERFORMANCE                          6

THE VISITOR ECONOMY – A KEY DRIVER FOR THE ACT                   9
   DOMESTIC TOURISM IN THE ACT – YEAR ENDING JUNE 2013           9
   INTERNATIONAL TOURISM IN THE ACT – YEAR ENDING JUNE 2013     10
   TOTAL ACT VISITATION IMPACT (DOMESTIC AND INTERNATIONAL)     10
   – YEAR ENDING JUNE 2013

2020 TOURISM STRATEGIC FRAMEWORK FOR THE ACT                    11
   THE APPROACH                                                 11
   2020 DEMAND OUTLOOK                                          11
   CONSUMER DEMAND TESTING                                      12

THE 2020 GOAL FOR THE ACT                                       17

ACHIEVING THE POTENTIAL — 7 KEY PILLARS                         18
   1. DOMESTIC MARKETING INNOVATION                             18
  2. ESTABLISH INTERNATIONAL AIR ACCESS AND INCREASE DOMESTIC   20
		 AVIATION CAPACITY
   3. FOCUS ON DIGITAL                                          23
   4. LEVERAGING MAJOR CONTRIBUTORS TO THE VISITOR ECONOMY      24
  5. ENCOURAGING INVESTMENT AND CREATING THE RIGHT              26
		 BUSINESS ENVIRONMENT
   6. INDUSTRY DEVELOPMENT                                      27
   7. INDUSTRY PARTNERSHIPS                                     29

GROWING THE VISITOR ECONOMY — KEY ACTIONS                       30

Chief Ministers Message
                                 Tourism is big business for the Canberra region. It currently
                                 contributes $1.65 billion to the ACT economy and remains one of our
                                 largest private sector employers, supporting an estimated 16,000 jobs.

                                 Canberra as a tourism destination today is significantly different to
                                 what it was ten years ago. For example, we’ve seen the introduction of
                                 a host of new tourism-related products and infrastructure that have
                                 enhanced the experiences we provide to our many domestic and
                                 international visitors.

This includes the $480 million investment in the Canberra Airport terminal and supporting
infrastructure. The Airport is now a fitting gateway for the national capital that provides a solid
platform for future economic growth – including the capacity to support direct international
flight access.

So in a time where the range and quality of our tourism offering continues to evolve, the outlook for
the industry in the Canberra region is very exciting.

At a national level, the stretch goal under the Tourism 2020 framework is to grow overnight tourism
expenditure from $70 billion in 2009 to $140 billion in 2020. Consistent with this approach, the aim of
the ACT’s 2020 Tourism Strategy is to achieve overnight visitor expenditure of $2.5 billion by 2020 (from
a current base of $1.58 billion).

Achieving this stretch goal for the ACT will require a coordinated effort. The 2020 Tourism Strategy will
help challenge and shape the way we do business as an industry and guide us on a path towards
maximising the tourism potential of the Canberra region.

I would particularly like to thank the broad range of government and industry stakeholders who
were consulted and who provided feedback throughout the process of developing this strategy.
Your participation, enthusiasm and commitment will ensure that we commence our journey towards
2020 on a strong footing.

It is my great pleasure to present the ACT’s 2020 Tourism Strategy.

Andrew Barr MLA
Chief Minister
Treasurer
Minister for Tourism and Events
Minister for Economic Development
Minister for Urban Renewal

4     2020 Tourism Strategy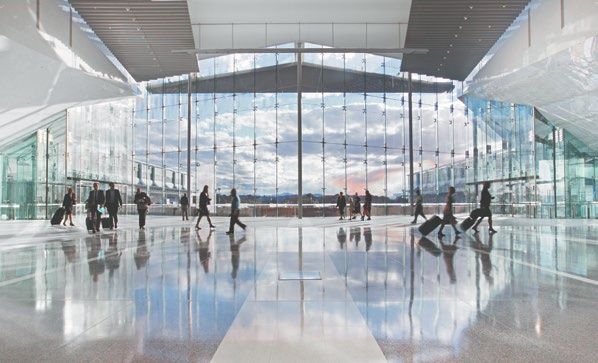
Introduction
The ACT Government, through VisitCanberra, has developed this 2020 Tourism Strategy to provide a
framework for informing programs and activities that can help realise the tourism potential of the
Canberra region.

The goal is to grow the value of overnight visitor expenditure in the ACT from a current base of
$1.58 billion to $2.5 billion by 2020. The strategy will align with the intent of the national Tourism 2020
framework which aims to double overnight visitor expenditure in Australia from $70 billion in 2009 to
$140 billion by 2020.

The foundation of the ACT’s 2020 framework has been established by undertaking a robust
assessment of the market through a consumer demand research project. This project has allowed
a detailed assessment of the current products and experiences available to visitors in the region
and an assessment of the latent demand potential that exists in key domestic and international
target markets.

Over the next six years, some of the areas of focus that will assist in realising the ACT’s 2020 tourism
potential include:
• Investment in destination marketing activities that drive visitation from domestic and international
  target markets.
• Access initiatives including securing direct international flight services and growing domestic
  aviation capacity.
• Growing the digital capability of the industry.
• Supporting the key drivers of the visitor economy including business events, education tourism
  and major tourism events.
• Creating the right business environment by encouraging investment and reducing
  regulatory burdens.
• Experience and industry development initiatives to complement investment in new product.

The actions outlined in this strategy are not achievable by the ACT Government alone. It will require
commitment and coordinated effort from all parts of the industry – including peak industry bodies,
Commonwealth funded attractions and all other tourism businesses.

Importantly, the intent of the 2020 Tourism Strategy is for tourism to be viewed as a business that adds
diversity and broadens the ACT economy. Its continued growth relies on influencing broad parts of the
economy including business development, labour and skills, education, employment, investment,
transport and aviation.

The 2020 Tourism Strategy provides a clear vision for tourism in the ACT by establishing a measurable
stretch target that we can all strive for.

                                                 Growing the visitor economy 2014-2020                        5
Looking ahead to 2020
                  – background and context
                  The national Tourism 2020 strategy, released in December 2011, provided a framework to help
                  Australia reach its tourism potential by setting a goal of doubling overnight expenditure from a base of
                  $70 billion in 2009 to $140 billion in 2020.
                  In achieving the national ‘stretch’ target of $140 billion, some of the key priorities identified included
                  investment in new product, boosting productivity, increasing uptake of digital technology, and
                  addressing labour and skills shortages – all of which ultimately impact on improved product and
                  service quality.
                  Federal and State/Territory Tourism Ministers have actively led and endorsed a national work program,
                  and the ACT has committed to contributing proportionally to the Tourism 2020 framework and the
                  national ‘stretch’ target.

                                                                             Tourism Industry Potential - International + Domestic
                                                               Total expenditure (includes pre-paid international airfares and packages in nominal terms)

                                               $150
                                                                                                                                                                       $140B
Total overnight expenditure nominal Billions

                                               $130

                                               $110
                                                                                                                                                                       $115B

                                                $90

                                                $70
                                                                             $70B                                                                          Trend
                                                                             as at YE Jun 2011                                                             Potential
                                                $50

                                                $30
                                                      Dec 09

                                                                    Dec 10

                                                                              Dec 11

                                                                                       Dec 12

                                                                                                 Dec 13

                                                                                                          Dec 14

                                                                                                                   Dec 15

                                                                                                                              Dec 16

                                                                                                                                        Dec 17

                                                                                                                                                  Dec 18

                                                                                                                                                                   Dec 19

                                                                                                                                                                               Dec 20

                  CURRENT NATIONAL TOURISM PERFORMANCE
                  The latest State of the Industry 2013 report released by Tourism Research Australia highlights
                  improvement on most key tourism indicators over the last 12 months – including visitor expenditure,
                  accommodation supply, aviation seat capacity and tourism employment. This comes despite the
                  continued high Australian dollar and a range of challenges in the global macroeconomic environment.
                  An overview of national visitor expenditure for 2012-13 is outlined below:

                                               International overnight visitor expenditure:                                 $28.2 billion (up 5.9% on 2011-12)

                                               Domestic overnight visitor expenditure:                                      $51.4 billion (up 3.2%)

                                               Total overnight visitor expenditure (2020 MEASURE):                          $79.6 billion (up 4.2%)

                                                  plus

                                               Domestic day visitor expenditure:                                            $18.1 billion (up 3.0%)

                                               TOTAL VISITOR EXPENDITURE (DAY + OVERNIGHT):                                 $97.7 billion (up 3.9%)

                  6                                   2020 Tourism Strategy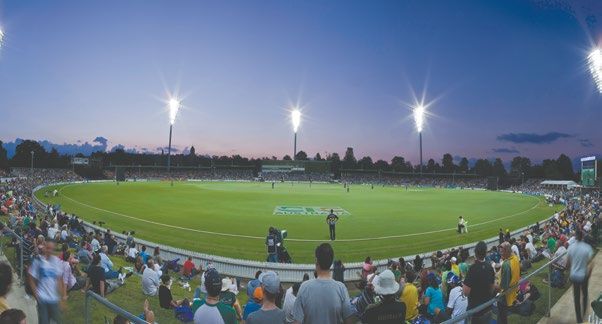
At present, industry is on track to achieve the lower end of the tourism potential’s target (i.e. $115
  billion for overnight visitor expenditure) by 2020. This is within expectations given Tourism 2020 is still
  in the ‘setting the foundation’ phase, with growth expected to gather momentum in 2015 and beyond.
  International visitation is up 5% on the previous year, with a new record of 6.3 million visitors – driven
  largely by key Asian markets, including China in particular (up 17%), along with Singapore and
  Malaysia. Arrivals from traditional markets also improved, with the USA up 6% and the UK seeing
  growth for the first time in 5 years (up 1.2%).

           Top 10 international source markets to Australia – by Visitor Numbers (‘000s)

          India                     154

    Hong Kong                        166

         Korea                         180

      Malaysia                                   242

         Japan                                           310

     Singapore                                            320

          USA                                                               465

   New Zealand                                                                          574

         China                                                                                647

United Kingdom                                                                                                                     1,087

                  0                  200                         400                    600             800             1,000              1,200
                                                                   International Visitor Numbers (‘000s)

       Top 10 international source markets to Australia – by Visitor Expenditure ($ millions)

      Germany                        542

    Hong Kong                              663

      Malaysia                                   787

        Korea                                      865

        Japan                                      886

     Singapore                                     895

          USA                                                       1,347

  New Zealand                                                               1,582

United Kingdom                                                                      1,770

         China                                                                                                             3,367

                  0            500                1,000             1,500             2,000         2,500       3,000      3,500           4,000
                                                                International Visitor Expenditure ($ million)

                  Source: International Visitor Survey, Tourism Research Australia, Canberra

                                                                            Growing the visitor economy 2014-2020                             7
Growth has also been seen in domestic tourism nationally, including growth in overnight trips (up 3%)
  well above the long term trend rate.

                                                              Domestic Overnight Visitation (Australia)

                                         76                                                                                                  300
                                                                                                                                 75.268m
                                         75                                                                                                  295
Domestic Overnight Visitors (millions)

                                                                                                                                                   Domestic Visitor Nights (millions)
                                         74                                                                                                  290
                                                                                                      73.369m                     287.524m
                                         73                                                                                                  285

                                         72                                                                                                  280
                                                                                                                278.348m
                                                                                70.977m
                                         71                                                                                                  275

                                         70                                                                                                  270
                                                              264.260m                    266.235m
                                         69    263.405m                                                                                      265
                                                  68.539m
                                         68                         68.143m
                                                                                                                                             260

                                         67                                                                                                  255

                                         66                                                                                                  250
                                                Y/E June 09   Y/E June 10        Y/E June 11           Y/E June 12         Y/E June 13
                                                                              Visitors        Visitor Nights

  The number of Australian outbound visitors has increased by 5%, which represents the slowest growth
  for this segment since 2008-09. However, since the year 2000, the propensity of Australians to take an
  overseas trip has doubled from 19 trips per 100 people to 39 trips in 2013.
  Meanwhile, the propensity of Australians to travel domestically has fallen from 480 trips per 100
  people in the year 2000 to 400 trips in 2013.

  8                                           2020 Tourism Strategy
The visitor economy – a key driver for
       the ACT
       According to the most recent Tourism Satellite Account for the ACT prepared by Tourism Research
       Australia (based on 2011-12 data), the tourism industry contributes around $1.65 billion to the ACT
       economy and is one of the territory’s largest private sector employers – supporting an estimated
       16,000 jobs.
       Outlined below is a snapshot of tourism performance in the ACT over the past five years, with specific
       reference to the previous 12 months. This data has been taken from the National Visitor Survey (NVS)
       and International Visitor Survey (IVS) produced by Tourism Research Australia and incorporates
       overnight visitor expenditure, which forms the basis of the ACT’s 2020 stretch target.

       DOMESTIC TOURISM IN THE ACT – YEAR ENDING JUNE 2013
       The ACT received 2.05 million domestic overnight visitors for the year ending June 2013, a 9.0%
       increase compared to the year ending June 2012 (1.88 million). This increase was well above the
       national average (2.6%) for the same period.
       Visitor nights in the ACT increased by 23.5%, up from 5.05 million for the year ending June 2012 to
       6.23 million for the year ending June 2013. Nationally, there was a 3.3% increase in visitor nights
       across the same 12 month period.

                                                              Domestic Overnight Visitation (ACT)
                                         2.5                                                                                      10

                                         2.4                                                                                      9
Domestic Overnight Visitors (millions)

                                                                                                                                       Domestic Visitor Nights (millions)
                                         2.3                                                                                      8

                                         2.2                                                                                      7
                                                                                                                        6.233m
                                         2.1                                                                                      6
                                                                  5.551m
                                                                                                     5.049m              2.049m
                                          2                                                                                       5
                                               5.020m        2.012m
                                                                                      4.683m
                                         1.9                                                                                      4
                                               1.896m                                                      1.879m
                                         1.8                                                                                      3
                                                                                       1.751m
                                         1.7                                                                                      2

                                         1.6                                                                                      1

                                         1.5                                                                                      0
                                               Y/E June 09   Y/E June 10       Y/E June 11           Y/E June 12    Y/E June 13
                                                                           Visitors       Visitor Nights

       Key points of note:
       • The Visiting Friends and Relatives (VFR) market is driving much of the growth for visitors and visitor
         nights, although in the last 12 months gains were also experienced under both the Holiday and
         Business sectors.
       • The VFR sector clearly remains the ACT’s largest, with a 38 per cent share of the visitor
         market – followed by Business (29 per cent) and Holiday (27 per cent).
       • New South Wales currently accounts for two-thirds of the ACT’s domestic overnight visitors
         (on the back of 2% growth over the last 12 months), with Victoria and Queensland the next biggest
         source markets.
       • Domestic overnight visitor expenditure in the ACT for the year ending June 2013 totalled
         $1.207 billion, an increase of $159 million on the previous year.

                                                                              Growing the visitor economy 2014-2020                              9
INTERNATIONAL TOURISM IN THE ACT – YEAR ENDING JUNE 2013
The ACT welcomed 180,380 international visitors in the year ending June 2013, an increase of 10.4%
compared to the year ending June 2012 (163,375). This was compared to a 5.1% increase in
international visitation to Australia.
International visitors to Canberra stayed for a total of 4.77 million nights in the year ending June 2013,
up 13.3% from the year ending June 2012 (4.21 million). This once again exceeded the average
increase experienced nationally (7.8%) across the same period.
International Visitation (ACT)
185,000 7
180,380
180,000 6.5
International Visitor Nights (millions)
175,000 6
170,000 5.5
International Visitors
165,000 163,375 5
4.766m
159,615
160,000 4.5
156,829
4.207m
155,000 4
151,120
150,000 3.5
3.514m
145,000 3
2.983m 2.947m
140,000 2.5
135,000 2
Y/E June 09 Y/E June 10 Y/E June 11 Y/E June 12 Y/E June 13
Visitors Visitor Nights
Key points of note:
• The ACT performed strongly under the leisure sector in the past 12 months, with international
Holiday visitation up by 10.3% and those Visiting Friends and Relatives (VFR) up by 7.9%.
International Business visitation was down by 4.9%, while visitation for other purposes (including
Education and Employment) was up by 37.1%.
• The top five international travel markets to the ACT in the year ending June 2013 were China
(12.3% share), the USA (11.2%), Singapore/Malaysia/Thailand/Hong Kong (10.7%), the United
Kingdom (9.8%) and New Zealand (7.3%).
• International visitor expenditure in the ACT for the year ending June 2013 totalled $376 million, an
increase of $30 million on the previous year.
• With Canberra’s impending capacity for hosting international flights, the development of aviation
partnerships in key international markets would present significant opportunities for the Territory.
TOTAL ACT VISITATION IMPACT (DOMESTIC AND INTERNATIONAL)
– YEAR ENDING JUNE 2013
Overnight Visitors: 2.23 million
Visitor Nights: 11.0 million
Overnight Visitor Spend: $1.583 billion
10 2020 Tourism Strategy2020 Tourism Strategic Framework
for the ACT
VisitCanberra engaged BDA Marketing Planning (BDA) to assist with the formulation, preparation and
delivery of strategic modelling to identify an industry and organisational goal for tourism in the ACT
out to the year 2020.
BDA was a key provider of input for the national Tourism 2020 strategy and the 2020 targets for the ACT
align with the methodology adopted nationally.
THE APPROACH
STEP 1 STEP 2 STEP 3 STEP 4 STEP 5
The Market Outlook Current demand Strategic direction Tracking & evaluation
Market Demand Establish 2020 Assessment of Recommendation Tracking,
and Supply Audit outlook Current latent for 2020 Goal & evaluation of Goal
• Assessment of • Tourism ‘market demand strategic and KPI progress
tourism opportunity’ outlook
performance vs to 2020
• Original research imperatives • Establish regular
conducted • Generation of 2020 performance
industry & economy • Identify markets with monitoring
–– Consumers demand scenarios
• Summary of key most growth exposed to (quarterly reporting)
and the required
economic influences opportunity ‘brochure style’ • Update of Market
performance gains
• Analysis of current • Provide a ‘par stimulus of needed to achieve Demand & Supply
tourism trends: performance’ various experience each scenario level Audit
broad demand outlook to 2020 & event options • Update of 2020
• Alternative
streams & trend in • BDA AUSMO –– Performed Market Opportunity
‘Competitive Gaps’
consumer forecasting model domestically as Outlook
between Trend &
preference/ used to generate a well as in key Goal quantified • Goal / KPI progress
behaviour ‘Trend’ outlook for international • Recommendation for evaluation
• Assessment of key markets markets an appropriate Goal • Communications
performance across –– Key Outputs: • Outputs include: & key KPIs effectiveness
key demand streams Forecasts of trips –– Understanding of • Establish required tracking
• Summary of key and expenditure consumer growth in airline • Strategic summary
competitive tourism across all key awareness for supply & and imperatives
indicators, including: markets… each option tested accommodation
–– Travel –– … Includes development to meet • Concept testing of
–– Measure of appeal new experiences as
consideration and interstate and 2020 level of
intention inbound overnight –– Establish latent demand required
demand demand potential
–– Visitor satisfaction for each • Direction for
–– Destination choice experience/event marketing mix
motivations priorities
• Ranking of demand
–– Visitation triggers potential for
–– Planning/booking experiences/events
behaviour tested
• Status summary of • Identification of
current competitive consumer markets
supply, e.g. & segments which
are most productive
–– Accommodation to target
infrastructure
–– Occupancy levels
–– Air supply by
origin
2020 DEMAND OUTLOOK
Current Domestic Outlook (if ACT continues to hold market share – i.e. ‘Trend’ Growth)
• Minimal trips growth – improving somewhat out to 2020.
• Spend growth largely inflationary.
Current Inbound (International) Outlook (if ACT continues to hold market share – i.e. ‘Trend’ Growth)
• More growth opportunity internationally.
• 25% trips growth and 72% expenditure growth forecast out to 2020.
• Could be further enhanced with introduction of direct flights.
Growing the visitor economy 2014-2020 11CONSUMER DEMAND TESTING
Consumer demand testing was undertaken domestically and in three key international markets
(China, Singapore and New Zealand). This involved original research where consumers were exposed
to stimulus presenting a variety of current experience and event options for the Canberra region.
Outputs included awareness of each option tested, along with appeal and latent demand potential for
each experience/event – which in turn determined the potential for marketing to influence increased
demand performance.
DOMESTIC – KEY TAKEOUTS
• Low awareness is evident – only 20% of respondents had a high awareness of tourism experiences
in the Canberra region pre-stimulus.
• Post stimulus, iconic attractions were clearly the most preferred Canberra tourism experience, with
a big gap to the other concepts.
Most appealing Canberra Experience: Post-stimulus
% of Australian respondents
Iconic attractions 30
Food & Wine 12
Family Fun 12
Arts & Culture 11
Outdoors & Adventure 10
Events 9
Shopping & Markets 9
Question: From the information you have been given, which of the following is the most appealing to you?
• Communication/advertisement examples covering multiple experiences tested strongly across a
number of key metrics, including:
–– positive advertising appeal.
–– ability to prompt respondents to seek further information.
–– ability to convey new, interesting and valuable experiences.
–– ability to reflect Canberra’s strengths.
–– ability to lift consideration for the region.
–– ability to best communicate ‘Canberra’ to respondents.
• visitcanberra.com.au featured prominently as the preferred method for then seeking more
information about the Canberra region.
• There was a positive shift in intention to visit the Canberra region post-stimulus, with 29% ‘likely’ or
‘certain’ to travel to Canberra in the next two years (versus 21% pre-stimulus).
• This indicates that latent demand does exist for the Canberra offer.
Canberra intention – Pre Stimulus Canberra intention – Post Stimulus
% of Australian respondents % of Australian respondents
-34 21 -31 29
Questions: How likely are you to visit the Canberra Region in the next two years?
‘Very likely’ – ‘certain’ to travel
‘Not likely’ – ‘not at all’ to travel
12 2020 Tourism Strategy• In terms of visitation barriers, the majority of those not intending to visit the Canberra region have
other destinations higher on their list.
• Some also cite past visitation as a reason for not visiting in the next two years, while 20% say they
would like to visit, but further into the future.
• No ‘hard’ barriers are particularly evident, with the main reasons provided being possible to
overcome with development of more experiences.
Key reasons for not intending Canberra travel
% of Australian respondents “not at all’ or “not likely” to travel to Canberra Region in next 2 years.
Prefer other places 62
Been before 29
Not interested 22
Don’t see value 21
Like to go, just not now 20
Accommodation expensive 12
Too far from where I live 12
Not enough to do / activities 11
Cost too much to get there 10
Activities too expensive 9
Too long / hard to get there 7
Not easily accessible 5
Not suitable for my family 4
Not enough 3
accommodation option
Don’t know enough about it 3
Don’t want to take long holiday 2
Other 22
Question: You indicated you are not likely to travel to the Canberra region in the next two years. What are the reasons for not
travelling to this region?
Growing the visitor economy 2014-2020 13INTERNATIONAL (CHINA, SINGAPORE, NEW ZEALAND) – KEY TAKEOUTS
• Most international respondents were aware of Canberra – although there was lower awareness in
the Singapore market.
• Relatively few had visited Canberra before – with New Zealand having the highest number of
previous visitors.
• The highest desire to visit Canberra came from China (42%), followed by Singapore (15%) and New
Zealand (4%).
International Profile – Pre stimulus
70
China 17
Canberra awareness
42
Previous Canberra travel
Desire to visit Canberra
58
Singapore 6
15
86
New Zealand 22
4
0 10 20 30 40 50 60 70 80 90 100
% of international respondents
• Similar to the domestic market, there was also generally low awareness of specific Canberra
region tourism experiences across all three countries (see chart on page 21 for detailed results).
14 2020 Tourism Strategy• Post stimulus, ‘Food and Wine’ had the strongest appeal – particularly for Chinese respondents.
• ‘Iconic Attractions’ were in the mix, but much lower than for the domestic audience, while ‘Arts and
Culture’ and ‘Events’ were the least popular across all three markets.
Most appealing Canberra Experience: Post-stimulus
% of International respondents
10
Canberra Events 3
5
18
Outdoors and Adventure 16
13
14
Iconic Attractions 14
13
32
Food & Wine 19
17
9
Shopping & Markets 18
16
9
Family Fun 20
16
6
Arts & Culture 2
9
2
None of the above 9
11
Question: From the information you’ve been given, which of the following is most appealing to you?
China
Singapore
New Zealand
• Communication testing across all three international markets again clearly indicated that multiple
experience advertisements had the most appeal and best reflected Canberra’s strengths.
• However, in terms of preferred sources for then seeking more information on the Canberra region,
there were some clear differences between markets. New Zealand and Singapore were similar to
the domestic profile with visitcanberra.com.au and general internet search performing strongly.
China was very different, with guide books, agents and brochures stronger, while travel advice
websites were the top online source.
Growing the visitor economy 2014-2020 15• Intention to visit the Canberra region was clearly higher across all three international markets
post-stimulus. This again indicates latent demand.
Canberra intention – Pre Stimulus Canberra intention – Post Stimulus
% of International respondents % of International respondents
China -9 43 China -8 57
Singapore -27 16 Singapore -22 26
New Zealand -64 5 New Zealand -56 10
Question: How likely are you to visit the Canberra Region in the next two years?
‘Very likely’ – ‘certain’ to travel
‘Not likely’ – ‘not at all’ to travel
• In terms of barriers to visiting Canberra, there were some clear differences across the three
markets. Cost was a bigger issue for those from China, while those from Singapore indicated that
they preferred other places or didn’t see value in the destination.
• Nearly 60% of respondents from New Zealand preferred other places or cited a lack of interest in
the destination.
Key reasons for not intending Canberra travel (%)
% of International respondents “not at all’ or “not likely” to travel to Canberra Region in next 2 years.
26 6
Prefer other places 46 Been before 3
57 13
26
21
Accommodation expensive 10
Not interested 18
7
30
3
24 Too far from where I live 6
Like to go, just not now 17 6
25 3
Not easily accessible 5
59
Costs too much 6
to get there 18
16 18
Too long / hard to get there 3
3 4
Don’t see value 21
9
19
Don’t know enough about it 7
2
18
Not enough 13 3
to do / activities
9 Not suitable for my family 8
2
26
Don’t want to 3
take long holiday 14 Not enough
accommodation options 3
6
0
35 6
Activities too expensive China
11 Other 13
Singapore
6 New Zealand 18
Questions: You indicated you are not likely to travel to the Canberra region in the next two years. When do you think you will travel
there? What are the reasons for not travelling to this region?
16 2020 Tourism StrategyThe 2020 Goal for the ACT
Trend Forecast (i.e. if we keep doing what we do now and maintain market share):
• $2.2 billion in overnight visitor expenditure by 2020 (currently $1.58b)
‘Stretch’ Goal
• $2.5 billion in overnight visitor expenditure by 2020 (70% domestic, 30% international)
Competitive Gap (between trend forecast and ‘stretch’ goal)
• $300 million
ACT Tourism Expenditure
Domestic and International overnight expenditure ($billions) – 12MMT
Derived by BDA from ABS
2.6 ACT Goal = $2.5b
2.4 Competitive
Gap = $0.3b
2.2
2.0
2020 ‘Trend’ = $2.2b
1.8
1.6
1.4
1.2
1.0
0.8
Dec 07
Dec 08
Dec 09
Dec 10
Dec 12
Dec 13
Dec 15
Dec 16
Dec 17
Dec 18
Dec 19
Dec 20
Dec 14
Dec 11
Implications
Gap to be filled by effective strategy development:
• i.e. development and marketing of most appealing and new experiences.
• i.e. appropriate infrastructure to maximise demand potential.
Growing the visitor economy 2014-2020 17Achieving the potential — 7 key pillars
The following seven pillars will form the foundation from which targeted programs and activities can
be developed to achieve the 2020 tourism potential for the ACT. These pillars will be reviewed on an
annual basis.
1. DOMESTIC MARKETING INNOVATION
Domestic visitation is the foundation of the visitor economy in the ACT, currently responsible for over
90% of the ACT’s overnight visitors.
The ongoing domestic challenge
• Low national awareness of Canberra, but a high level of appeal for the breadth of destination
experiences. This is particularly evident for Canberra’s iconic attractions – a key attribute of the
destination.
• Negative perceptions and low association as a market leader in delivering quality tourism
experiences.
Canberra Region awareness Canberra Region appeal
% of Australian respondents % of Australian respondents
-35 20 -17 61
‘High – very high’ awareness ‘Somewhat’ – ‘very’ appealing
‘Low – No’ awareness ‘Somewhat’ – ‘very’ unappealing
Addressing the challenge
VisitCanberra will play a key role with industry to address this awareness challenge and the
opportunity to unlock latent demand through implementation of its Domestic Marketing Strategy
2013–15. The domestic marketing strategy is a high-level road map that includes key travel insights
and outlines activities that will be used to increase economic return from domestic leisure travel.
The following activities and principles underpin the delivery of the domestic marketing strategy:
• Engagement with the Roy Morgan Socially Aware and Visible Achiever visitor segments to raise
awareness of Canberra as a short break destination. Whilst these segments are big spenders and
have the highest desire to take a short break, they also have relatively low awareness levels of
Canberra. There is a significant opportunity to increase visitation by focusing marketing efforts on
these segments.
These two visitor segments communicate to a broad set of market lifestyle choices. This will ensure
the destination is promoted to a range of niche consumer groups including the Grey Nomads market.
• Implementation of an annual media plan that responds to changing consumer behaviour by
focusing on the following:
–– An ‘always on’ approach that includes destination advertising 365 days of the year. This approach
responds to consumers’ active search behaviour and keeps the destination top of mind.
–– Bursts of tactical advertising activity at key times of the year. These will promote Canberra’s
four key experience pillars: Arts and Culture, Food and Wine, Family Fun, and Outdoors and
Adventure – providing compelling reasons to visit.
–– An annual campaign activation. VisitCanberra will evolve the Human Brochure campaign,
creating an activation in 2014 that will:
◊ shine a spotlight on the destination and profile Canberra’s unique experiences.
◊ enhance the destination’s brand and increase the pool of Canberra advocates.
◊ engage, attract and convert potential visitors.
18 2020 Tourism Strategy• Redeveloping core promotional channels including visitcanberra.com.au to engage and enhance
the visitor experience at all stages of the consumer decision making cycle – i.e. dreaming, planning,
booking, in destination etc.
• Working with industry to create, aggregate and distribute engaging content including blogs, videos
and photos that profile Canberra’s unique experiences. Content marketing activities that engage
audiences through storytelling are key to attracting and converting potential visitors.
• Promoting short breaks that offer valuable and rewarding experiences and enable friends and
families to relax and connect.
• Continuing to administer the ACT Government’s Special Event Fund (SEF) to broaden the ACT
annual events calendar and drive visitation to the destination. The ACT Government is already
supporting three summer blockbuster exhibitions in 2013 through the SEF including the
National Gallery of Australia’s Gold and the Incas – Lost worlds of Peru, the National Library of
Australia’s Mapping Our World – Terra Incognita to Australia and the National Portrait Gallery’s
Elvis at 21 exhibition.
Priority
• Implementation of the Domestic Marketing Strategy 2013–15
(More information on the Domestic Marketing Strategy 2013–15 can also be
viewed at www.tourism.act.gov.au)
Growing the visitor economy 2014-2020 192. ESTABLISH INTERNATIONAL AIR ACCESS AND INCREASE DOMESTIC AVIATION
CAPACITY
Key supply side requirement to achieve the ACT’s 2020 goal
Aviation – Seat Supply:
• At current load factors, another 650,000 seats per annum would be required to achieve the
stretch goal (current average load factor 66%).
• At an 80% load factor average, the requirement for additional seats drops to 180,000.
• Securing daily direct international services from two international destinations will provide
the required seats at an 80 percent load factor scenario.
The $480 million investment in the Canberra Airport terminal and supporting infrastructure provides a
foundation and unique opportunity to achieve the supply goal.
In particular, the opportunity to establish direct international flight services and to open Canberra
to the international marketplace will secure the city’s long term future as a key business and
tourism hub.
INTERNATIONAL
Opportunity
• Providing access to new leisure markets with projected growth.
• Education partnerships and increased international student numbers.
• Enhancing the tourism impact of visiting friends and relatives (VFRs) associated with international
students.
• Foreign direct investment opportunities.
• Economic growth for the surrounding regions of New South Wales, in particular the South Coast,
the Snowy Mountains and nearby inland New South Wales.
• Growing business-to-business links and export opportunities for businesses in the ACT and region.
• Establishing Canberra as a freight and transport hub.
Key market focus
• Singapore – As a global hub, Singapore presents the opportunity to realise the potential of the fast
growing Asian markets, particularly China – while also opening up access to and from Europe.
• New Zealand – The largest market by volume to Australia that provides an opportunity to grow
leisure, government, business, education and diplomatic visitation to the ACT.
20 2020 Tourism StrategyThe 2020 consumer demand research confirmed low awareness, but high latent demand for
Canberra’s core experiences in the Singapore, New Zealand and China markets. This is highlighted in
the graph below. Food and wine in particular, along with events, nature and shopping experiences have
the highest appeal.
Awareness of Canberra
experiences Awareness of Canberra Uniqueness of Canberra
% of international respondents % of international respondents % of international respondents
China -44 14 -7 69 -9 62
Singapore -67 4 -14 45 -18 43
NZ -69 5 -23 41 -30 32
‘High – very high’ ‘Somewhat’ – ‘very’ ‘Somewhat’ – ‘very’
awareness appealing unique
‘Low – No’ ‘Somewhat’ – ‘very’ ‘Not very’ – ‘not at all’
awareness unappealing unique
The Economic Development Directorate (EDD), through VisitCanberra, is leading the effort to attract
direct international services in partnership with the Canberra Airport Group.
However, securing and sustaining direct services requires commitment from all parts of Government
and industry. Aligning effort to influence markets where flights are likely to originate from is a
fundamental requirement and includes:
• Advocating the opportunity Canberra presents to international carriers through business and
political networks.
• Securing and growing the value of international business events.
• Trade and investment activities.
• International education and study programs.
Growing the visitor economy 2014-2020 21DOMESTIC
The graph below highlights domestic overnight leisure trips (Holiday and VFR) for the ACT since 2003.
The trend shows flat performance apart from increased visitation as a result of major event activity.
ACT Interstate leisure trips
Trips (000’s) – 12 MMT
Derived by BDA from NVS
1000
VFR trips
800
Series Break
600
400
Holiday trips
200
0
Mar 03
Mar 04
Mar 05
Mar 06
Mar 07
Mar 08
Mar 09
Mar 10
Mar 11
Mar 12
Mar 13
The ACT currently receives 65% of total domestic overnight visitation from Sydney and regional New
South Wales. The majority of this market is self drive.
Broadening the ACT’s visitation mix is critical to growing the value of the domestic market and
ensuring its sustainability.
Therefore, establishing new domestic aviation routes, and in particular securing low cost carriers, will
provide better and more cost effective access to the destination from other parts of Australia. The
addition of a low cost carrier will add competition and options for consumers and assist in making the
destination more affordable and accessible to new domestic visitors.
Priorities
• Establish a capable international function within VisitCanberra. The business
unit will focus on development and implementation of international programs,
including marketing and aviation partnerships.
• Secure direct international services focusing on Singapore as a major global
hub and New Zealand as Australia’s largest visitation market.
• Secure ongoing funding to support direct access initiatives and partner with
Tourism Australia and airlines to create international marketing campaigns
that stimulate demand and unlock existing latent demand.
• Facilitate a coordinated, whole of region approach to destination marketing in
the international marketplace.
• Support established domestic services through cooperative marketing
initiatives.
• Maintain and grow viable capacity on existing domestic routes.
• Encourage competition and choice in domestic routes through the introduction
of a low cost carrier.
22 2020 Tourism Strategy3. FOCUS ON DIGITAL
The way tourism destinations reach and engage with audiences has evolved considerably to keep pace
with developments in the digital world.
The fragmented media landscape has provided audiences with a myriad of choices—from new online
activities and services to new devices from which to source information and gain inspiration.
Consumer behaviour has also fundamentally changed, particularly the way people research, share
their opinion and interact with destination experiences. Consumers are always on, always connected
and want easy access to accurate information on tourism offerings.
The internet is a primary media source with people now spending upwards of 14 hours per week
searching online. Time spent accessing mobile internet continues its upward trend with a 74 per cent
increase in mobile page views in 2012.
The top four activities that people perform on their mobile phones are:
• browsing websites and searching for information.
• accessing sport and news.
• using social network sites.
• streaming audio or video content.
Consumers draw on a variety of sources and resources to support their decision making, with 71%
reading other consumers’ opinions and discussions about brands online, while 59% view online videos
to help inform their purchase choices.
VisitCanberra will provide leadership through a commitment to investing in campaign activity that
engages people through digital channels. This includes continued use of social media as a key vehicle
to increase the volume of positive noise about the city and to engage with consumers in an authentic,
believable way.
Key learning
The Human Brochure campaign provided a foundation to ensure that a whole of industry
approach could be adopted when using digital channels to not only influence consumer decision
making, but importantly grow industry capability through active involvement in a program. The
campaign accelerated industry’s digital capacity and provided a lasting legacy for businesses to
use social media as a vehicle to promote their own product.
Building the competitive digital capability of the tourism industry is essential in both marketing
Canberra and in the distribution of tourism product. Business capability will be enhanced through:
• Encouraging participation in campaign initiatives – i.e. learning through involvement.
• Partnering with and informing programs delivered by other parts of Government and industry.
• Development of assistance tools and training packages (such as the VisitCanberra Social
Media Playbook).
• Making the latest market intelligence and research available to ensure industry has up to date
advice and information available to use the digital space effectively.
Priorities
• Informing digital business development programs delivered by Government
and industry bodies and increasing tourism business participation.
• Implementing innovative campaign initiatives that involve industry and engage
consumers to encourage content creation and distribution.
• Continuing to develop and invest in digital assets that ensure the destination is
at the forefront of digital marketing and distribution trends.
Growing the visitor economy 2014-2020 234. LEVERAGING MAJOR CONTRIBUTORS TO THE VISITOR ECONOMY
MAJOR EVENTS
Events are proven visitation drivers and play a crucial role in providing a tangible reason for people to
visit, especially during traditionally low visitation periods. Events also have the capacity to generate
overnight stays on weekends, an important means of maintaining occupancy outside of Canberra’s
busy weekday business visitation.
Blockbusters
Blockbuster exhibitions in particular have delivered outstanding return on investment for the Canberra
region. The ACT Government has invested $1.2 million in five completed blockbuster exhibitions since
2009 – Masterpieces from Paris, Renaissance, Handwritten, Toulouse Lautrec and Turner from the
Tate – delivering $260 million in economic value to the city. The establishment and success of the
Special Event Fund (SEF) is a great example of Government and industry working in partnership to
deliver benefits that flow to all parts of the tourism sector.
Value of blockbuster exhibitions:
• Five major exhibitions completed since 2009.
• $1.2 million ACT Government investment.
• $5.6 million total interstate marketing investment leveraged.
• 72% average attendance ratio from interstate/overseas.
• $260 million total economic value generated.
Major international and milestone events
• The Centenary year has further demonstrated the value of events, with a full calendar contributing
to the ACT’s strongest domestic overnight visitation results since 2004.
• There are a number of major events on the horizon that Canberra will play host to which provide
additional opportunities to drive visitation to the destination, including:
–– The 2015 AFC Asian Cup football tournament.
–– The 2015 ICC Cricket World Cup.
–– The Anzac Centenary (including the 100th anniversary of the Gallipoli landings in 2015),
which looms as one of the most significant commemorations to take place in the lives of
current generations.
Event development and acquisition
• The destination’s flagship event, Floriade, continues to be the foundation of the ACT visitation
calendar and is renowned as Australia’s celebration of Spring. The event must continue to evolve,
provide new reasons to visit and engage consumers in new and innovative ways.
• Ongoing investment from Government and industry to grow the appeal of emerging events such as
Enlighten is also required. In addition, working with event organisers to grow and acquire events
that drive visitation will assist in filling hotels on weekends and other traditionally quiet times of the
year. This includes participation based events.
Business events
The current value of the business sector to the ACT (for the year ending June 2013) is outlined below:
• Domestic overnight business visitors – 591,000.
• Domestic business visitor nights – 2,099,000.
• Domestic overnight business visitor spend – $510 per visitor ($301.4m in total).
The ACT Government, through VisitCanberra, invests in the operations of the Canberra Convention
Bureau (CCB) together with a wide range of local businesses and other stakeholders. This enables the
CCB to deliver programs that seek to grow the number and scale of business events held in the
national capital.
Business events will play an important role in contributing to and achieving the 2020 potential for
the ACT. For the year ending June 2013, 42,000 domestic overnight visitors indicated that they came
to Canberra for the purpose of a business event (conferences, exhibitions, conventions or tradefairs).
Direct international air services will provide further opportunity to grow the value of this sector by
attracting international business events and providing easier access for international delegates.
The value of business events could be further enhanced by maximising the opportunity to showcase
the national capital to delegates. This would provide the chance for delegates to discover a wider
range of destination experiences, change perceptions of Canberra, create advocates for the city and
stimulate repeat visitation.
24 2020 Tourism StrategyPrimary and secondary educational tourism
A total of 160,681 primary and secondary school students visited Canberra in 2012-13 for the purpose
of educational tourism. In 2012, the direct economic impact in the ACT as a result of interstate school
excursions was valued at $105 million.
In a joint venture partnership with the National Capital Attractions Association (NCAA), VisitCanberra
supports the activities of the National Capital Educational Tourism Project (NCETP) to market
Canberra as an educational tourism destination.
A major barrier to growth of this market is availability of low cost accommodation that caters to the
needs of visiting school groups. If addressed, the value of educational tourism to the Canberra region
would grow and play an important role in achieving the ACT’s 2020 potential.
International education
The total number of enrolments in the ACT in 2012 by international students who entered Australia on
a student visa was 13,200. The data indicates that 74% of students were from China, South East and
North Asia.
There were also an estimated 26,200 international visitors to the ACT who stated that a reason for
their trip to Australia was to visit a friend or relative who was an international student in Australia.
Direct international air access will provide a new opportunity to stimulate additional visiting friends
and relatives (VFR) visitation. VisitCanberra will actively seek to develop a closer working relationship
with the ACT’s key academic institutions to assist efforts in delivering innovative approaches to
influencing this market.
Priorities
• Continuing to support the staging of major exhibitions with broad appeal
through the Special Event Fund (SEF).
• Implementing programs and campaigns that effectively leverage the
opportunities associated with future major events including the Asian Cup
Football tournament, the ICC Cricket World Cup and the Centenary of Anzac.
• Continuing to support programs that grow the value of business events and
educational tourism to the ACT Economy
• Implementing programs that leverage the opportunity associated with the
international student market and the associated VFR potential.
Growing the visitor economy 2014-2020 255. ENCOURAGING INVESTMENT AND CREATING THE RIGHT BUSINESS ENVIRONMENT
VisitCanberra will work with the Federal and ACT Governments to ensure that the ACT tourism
industry is able to effectively leverage priority investment and regulatory reform initiatives.
This includes:
• Ensuring tourism has an appropriate share of voice through the implementation of the ACT
Government’s Business Development Strategy – Growth, Diversification and Jobs, including:
–– Accelerating business innovation.
–– Supporting business investment.
–– Fostering the right business environment.
• Effectively leveraging national Tourism 2020 investment and regulatory reform initiatives.
Investment
Investment in tourism product plays a vital role in providing new reasons for people to visit, changing
perceptions of the destination, catering to the needs of new markets, improving product quality and
increasing job opportunities.
Anticipating product and infrastructure needs that will support future market demands is vital.
For example, accommodation supply has not kept pace with demand from visiting school groups.
There is currently a critical shortage of low cost accommodation, leading to missed opportunities to
grow the value of the educational tourism market.
Other considerations include:
• Business/event facilities and event infrastructure, including sporting venues.
• Public transport required to connect the airport to the city.
• Digital infrastructure.
Key supply side requirement to achieve the ACT’s 2020 goal
Room Supply
• At current occupancy, 1,550 new rooms would be required to achieve the stretch goal
(current average occupancy 68%).
• At 75% occupancy, this reduces the number of new rooms required to 930.
• Canberra currently has just under 5,000 available rooms for properties with 15 rooms or
more. This figure has decreased by 119 rooms since 2003.
InvestCanberra is responsible for the ACT Government’s investment promotion activity. It coordinates
investor facilitation across Government to provide a case-managed service for major investors.
Through InvestCanberra, the ACT Government will play an ongoing role in influencing investment
decision making, providing advice on investment priorities and driving investment outcomes for the
tourism industry. This includes:
• Identifying the most suitable land for tourism product development.
• Bringing sites to an ‘investment ready’ stage that meet international investor expectations.
• Marketing of tourism investment opportunities to global and domestic investors.
• Providing an effective and efficient investment facilitation service.
• Leveraging the international investment promotion and facilitation partnership established between
Tourism Australia and Austrade.
Priorities
• Through InvestCanberra, encouraging and securing investment in key
infrastructure including short term accommodation.
• Supporting investment in infrastructure that enhances existing product and
contributes to the development of new product aligned to core experience
pillars.
• Ensuring the tourism opportunities associated with major infrastructure
projects such as the City to the Lake project and Capital Metro are maximised.
• Ensuring tourism issues are addressed through red tape reduction initiatives
such as Fix My Red Tape.
• Contributing to cross jurisdictional regulatory reform initiatives.
26 2020 Tourism Strategy6. INDUSTRY DEVELOPMENT
Tourism quality and experience development
The 2020 consumer demand research highlighted several areas where latent demand exists for
quality tourism experiences. However, the ACT is not associated as a national leader in any
experience attribute.
The graph below highlights that in the eyes of Australian travellers, the ACT does not rank above any
other state or territory for the listed product and experience associations.
State associations (% of travellers from other States). Which States do you most associate
with this attribute?
ACT NSW Vic Qld SA Tas WA NT
Available 4–5 star
premium accommodation 38 63 59 55 40 40 42 34
Availability of
accommodation with 31 56 54 48 33 34 34 28
high levels of service
Arts and culture 28 40 54 16 25 22 16 17
History and heritage 27 45 45 23 30 51 26 29
A family holiday
destination 23 41 37 61 30 36 29 27
A great place for touring
holidays and road trips 18 42 46 44 37 45 38 37
Great food and wine 17 41 52 25 48 35 32 15
Festivals 17 40 44 23 29 16 15 12
A progressive place 14 34 33 23 13 13 19 12
A value for money
destination 13 21 24 30 20 26 16 16
Distinctive dining and 43
fresh regional produce 12 31 40 26 38 30 19
A world class 46
natural setting 9 23 22 38 2040 46 33
#1 state
Note: Results reflect responses from those who don’t live in each state
Whilst this issue is also influenced by perceptions and can be in part addressed through campaign
initiatives, engaging experiences are the key to changing perceptions, growing visitor satisfaction and
building advocacy for the destination.
Consumers are seeking experiences that:
• Appeal to the needs and expectations of target markets.
• Deliver quality and value for money.
• Provide authentic, personalised interpretation and a high quality of service.
• Allow engagement with people and elicit social interaction.
• Allow visitors to engage with the destination in an unexpected way.
VisitCanberra will work with industry to guide the development of experiences that align with visitor
needs and expectations, with a focus on experience development in the following areas:
• Food and wine.
• Arts and culture.
• Nature and outdoor adventure.
• Indigenous.
• Events and festivals.
Growing the visitor economy 2014-2020 27Business development and assistance
Experience delivery is also enhanced by ensuring businesses have access to relevant development
programs and tools and can address barriers to growth.
VisitCanberra will work with industry partners to ensure the tourism industry has access to business
and skills development programs.
Opportunity
Coordinate the efforts of all sectors and industry bodies to ensure that investment in business
development programs is targeted, reduces duplication and meets the expectations and needs
of ACT businesses.
Canberra’s tourism industry is not immune to national labour and skills challenges as it competes
with the wages and secure jobs offered by the Commonwealth and the ACT public service.
The Australian tourism industry faces the ongoing challenge of:
• A job vacancy rate over four times the national average.
• An estimated 56,000 workers required nationally to fill expected vacancies in 2020.
VisitCanberra will work with national and local partners to ensure local solutions can be activated
that address availability, service standards and training. This includes investigating opportunities to
encourage greater Indigenous participation in the tourism industry.
Priorities
• Providing the latest research and market intelligence to guide the development
of experiences.
• Creating and promoting the benefits of accreditation, aligning business with
appropriate accreditation programs and providing opportunities for accredited
businesses to feature in campaign initiatives.
• Ensuring industry is able to leverage national business development initiatives
such as the ATEC China Ready program, Enterprise Connect and other grant
programs.
• Leveraging national labour and skills initiatives and applying local solutions.
• Advocating reform initiatives that contribute to increased labour supply
(e.g. recognition of tourism and hospitality as an eligible industry under the
12-month extension program for the second year of the Working Holiday
Makers Visa).
28 2020 Tourism Strategy7. INDUSTRY PARTNERSHIPS
Realising the ACT’s 2020 potential requires the commitment and involvement of all parts of the
industry. This includes relevant parts of the ACT Government, the Commonwealth Government,
industry bodies and the private sector.
All parts of our industry can demonstrate leadership and deliver programs that will help achieve the
stretch goal of $2.5 billion in overnight visitor expenditure for the ACT by 2020.
Peak industry bodies
The ACT Government through VisitCanberra will continue to build productive working relationships
with peak industry bodies including the National Capital Attractions Association (NCAA), Australian
Hotels Association (AHA), Canberra Business Council (CBC), ACT Chamber of Commerce and the
Canberra District Wine Industry Association (CDWIA).
VisitCanberra will work with these bodies to ensure a whole of industry approach to campaign delivery
and the development of cooperative programs that will contribute to achieving the ACT’s 2020
potential. These organisations also play an integral role in championing the intent of the 2020
framework and aligning their own programs to assist in maximising overnight visitor expenditure.
Canberra Convention Bureau (CCB)
The ACT Government through VisitCanberra will continue to support the operations of the CCB to grow
the value of domestic and international business events to the ACT economy. The CCB helps plan and
facilitate these events in Canberra and works with convention organisers to make their Canberra
experience positive and unique. VisitCanberra will work with the CCB to ensure their activities align
with and support programs under the core pillars of the 2020 framework – e.g. growing business
event visitation through the facilitation of direct international flight services for Canberra.
National Capital Educational Tourism Project (NCETP)
The ACT Government through VisitCanberra will continue to support the operations of the NCETP (and
support the joint venture agreement with the NCAA) to grow the value of the educational tourism
market to the ACT economy. This includes ensuring the activities undertaken by the NCETP align with
and support programs under the core pillars of the 2020 framework.
Canberra Airport
The ACT Government through VisitCanberra will continue to work with Canberra Airport to attract
direct international flight services to Canberra and develop domestic routes, including the addition of a
low cost carrier.
ACT Government
VisitCanberra will ensure relevant parts of the ACT Government can contribute to delivering solutions
for the tourism industry including investment, land supply, regulatory reform, policy initiatives and
experience delivery through Government-owned and operated assets.
Commonwealth Government
The ACT Government through VisitCanberra will represent the ACT tourism industry at relevant
Commonwealth forums to support and influence the implementation of the national Tourism 2020
framework. This includes influencing the national tourism policy agenda to assist in meeting the ACT’s
2020 potential – e.g. aviation access and visa reform.
Tourism Australia
The ACT Government through VisitCanberra will work in partnership with Tourism Australia to ensure
the ACT (and region) is represented in relevant Tourism Australia led campaign initiatives. In particular,
efforts will be focused on working with Tourism Australia to implement cooperative international
programs designed by Tourism Australia, VisitCanberra and airline partners.
NSW Tourism Organisations, boards and businesses
The ACT Government through VisitCanberra will work with Destination NSW, Tourism Snowy
Mountains, Inland NSW Tourism and South Coast Tourism to ensure a whole of region approach to
destination development activities and relevant campaign initiatives. This is particularly important in
positioning Canberra and the region as a major international gateway.
Growing the visitor economy 2014-2020 29You can also read