Inference of fault and fracture systems beneath the Matatlan waste dump basement, a VLF study
←
→
Page content transcription
If your browser does not render page correctly, please read the page content below
Geofísica Internacional (2014) 53-3: 241-257
                                                                                                Original   paper

Inference of fault and fracture systems beneath the Matatlan waste
dump basement, a VLF study

Miguel Ángel Alatorre-Zamora*, José Oscar Campos-Enríquez, Salvador Isidro Belmonte-
Jiménez and Jaime Ibarra-Nuño
Received: December 13, 2012; accepted: November 20, 2013; published on line: July 01, 2014

Resumen                                                       sitio. La estructura N-S tiene la misma
                                                              dirección que el Cañón del Río Grande de
Se utilizó la técnica VLF para inferir zonas de               Santiago, mientras que los rasgos NW-SE
fallas o de grandes fracturas que pudiesen                    coinciden con las direcciones del rift Tepic-
servir como conductos para fluidos de                         Zacoalco. Hacia el centro del área aparecen
desechos contaminantes en el vertedero de                     otros rasgos con direcciones NE-SW. Todos
Matatlán, en Guadalajara, al oeste de México.                 estos rasgos y sus direcciones coinciden
Para interpretar los datos se usaron los filtros              de manera fuerte con la predominancia
de Fraser y de Karous-Hjelt.                                  de grupos de fracturas mostrados en el
Se interpretaron perfiles de forma directa                    análisis estadístico de fracturas, y podrían
empleando el filtro modificado de Karous-                     servir como conductos para la migración de
Hjelt. Se aplicaron los filtros de Fraser y de                lixiviados hacia el Cañón Coyula, al sur, y
Karous-Hjelt conjugados a todos los datos.                    hacia el Cañón del Río Grande de Santiago,
Los resultados de ambas técnicas muestran                     al este del sitio.
similitud en las posiciones y orientaciones de                Un análisis estadístico de direcciones de
rasgos anómalos que se asocian a zonas de                     fracturas mostró 4 direcciones principales
fracturas o de fallas. Se observa una zona de                 N-S (A), N75-80E (B), N60-65W (C) y N25-
falla en el centro del sitio, que tiene un rumbo              30W (D), y dos direcciones secundarias que
NEE-SWW. Otros rasgos importantes inferidos                   son N45-55E (E) y 90E (F). El patrón primario
tienen direcciones NW-SE y se observan en la                  A coincide con la dirección del Cañón del Río
parte occidental del área.                                    Grande de Santiago, mientras que el patrón
El uso conjunto de las técnicas basadas en                    secundario F tiene una dirección paralela a la
los filtros de K-H y de Fraser dan resultados                 del Cañón Coyula.
como una estructura N-S inferida en el
límite occidental del vertedero, así como                     Palabras clave: very Low Frequency, vertedero
rasgos anómalos de dirección NW-SE,                           de Matatlán, zonas de fracturas, distribución
principalmente en la mitad occidental del                     de corriente, filtros Fraser y Karous-Hjelt.

M.A. Alatorre-Zamora*                                         S. Belmonte-Jiménez
Departamento de Ingeniería Civil y Topografía                 Centro Interdisciplinario de Investigación
Centro Universitario de Ciencias Exactas e Ingeniería         para el Desarrollo Integral Regional
Universidad de Guadalajara                                    Instituto Politécnico Nacional
*
 Corresponding author: alatorre2004@hotmail.com               Unidad Oaxaca

J.O. Campos-Enríquez                                          J. Ibarra-Nuño
Instituto de Geofísica                                        Departamento de Física
Universidad Nacional Autónoma de México                       Universidad de Guadalajara
Delegación Coyoacán, 04510
México D.F., México

                                                        241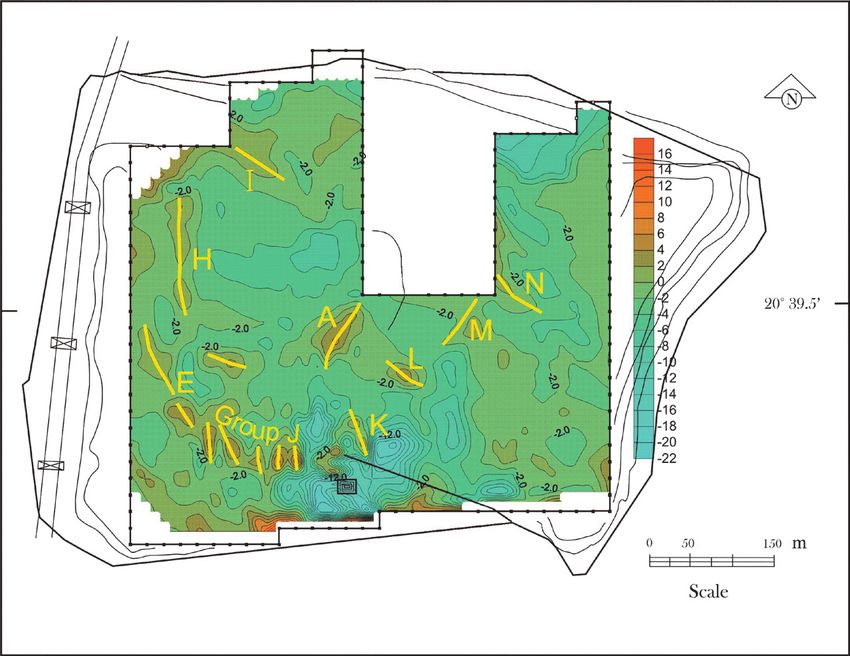
M. A. Alatorre-Zamora, J.O. Campos-Enríquez, S. Belmonte-Jiménez and J. Ibarra-Nuño

Abstract                                                         western half of the site. The N-S structure
                                                                 has the same direction as that of Rio Grande
We used the VLF technique to infer fault or                      de Santiago Canyon. The NW-SE features
major fracture zones that might serve as path                    coincide with the directions of the Tepic-
for contaminant waste fluids in the Matatlan                     Zacoalco rift. Others NE-SW lineaments
dumpsite, in Guadalajara, western Mexico.                        are located towards the centre of the area.
To interpret the data we used the Fraser, and                    These facts coincide strongly with the
Karous-Hjelt filters.                                            predominance of fracture groups show in
Profiles were interpreted with 2D direct modeling                the fracture analysis. The inferred structures
based on Karous-Hjelt modified filter (K-H). The                 could serve as conduits for the leachates
Fraser and Karous-Hjelt conjugated filter were                   to migrate towards the Coyula canyon as
applied to the entire data. The results of both                  well as towards the Rio Grande de Santiago
techniques show similarities in the directions                   Canyon.
and positions of anomalous features, which are                   Statistic analysis of fracture orientations
assumed fault or fracture zones. We observed                     showed N-S (A), N75-80E (B), N60-65W (C),
one fault zone at the centre of the site, with                   and N25-30W (D) main directions, and N45-
a NEE-SWW strike. Other important inferred                       55E (E), and 90E (F) secondary directions.
structures have NW-SE directions at the western                  Group A coincides with the direction of the Rio
part of the site.                                                Grande de Santiago Canyon, whereas pattern
The cooperative use of both techniques,                          F have the same direction as Coyula Canyon.
based on K-H filter and the Fraser filter
give results as an N-S inferred structure in                     Key words: Very low frequency, Matatlan
the westernmost part of the zone, as well                        dumpsite, fracture zones, current distribution,
as NW-SE linear anomalies, mainly in the                         Fraser and Karous-Hjelt filters.

Introduction                                                     ground. This field is elliptically polarized and
                                                                 characteristics of magnetic secondary field
Very Low Frequency technique (VLF) is based                      can be represented by polarization ellipse
on measurements of parameters of the                             parameters. In particular, two parameters of
polarization ellipse arising from the vector                     this ellipse are usually used to analyze the
sum of magnetic components of primary and                        secondary field: the tilt angle a (inclination of
secondary electromagnetic fields. Primary                        major axis) and the eccentricity or ellipticity
VLF field sources are generated by powerful                      e=H2/H1 (the rate between minor and major
transmitting antennas specially designed for                     axis). Moreover, since secondary field intensity
transoceanic communication; these antennas                       is always smaller than primary field intensity,
are disseminated in the north hemisphere.                        they can be written as
Several antennas do not transmit actually,
representing a disadvantage for the method.                                    a = Re/Hp          e = Im/Hp
The frequency of some transmitters have
changed over time; for example, Cutler, Maine                    (see for example, Saydam, 1981; Sinha, 1990a)
(NAA), transmitting with 17.8 kHz in 1970                        and therefore it is possible to evaluate both in-
(after Paterson and Ronka, 1970), transmitted                    phase, Re, and out-phase or quadrature, Im,
in 1996 with 24.8 kHz, and Jim Creek,                            components, both normalized with respect to
Washington (NLK/NPG) transmitting with                           the Hp main field.
18.6 kHz, now transmits with 24.0 kHz. The
VLF band itself has been modified: 15-25 kHz                        Considering main components of the
(Kaikkonen, 1979), 10-30 kHz (Olsson, 1980),                     polarization ellipse, tilt angle and ellipticity
and 15-30 kHz (Beamish, 1994).                                   would be:

    The emitted primary field travels along the                                            2( H z / H x )cos ∆φ
entire world, and at distances of more than                                 tan 2α =
100 km, its magnetic component is almost                                                     1 − ( H z / H x )2
horizontal and perpendicular to the source
azimuth (Bozzo et al., 1994). In presence of a                   and
conductor, the primary EM field penetrates into
the ground and generates a secondary field that
                                                                                           H z H x sin ∆f
interacts with the primary field. The resultant                                       e=
field is controlled by the electric structure of                                                 H 12

242      Volume 53 Number 3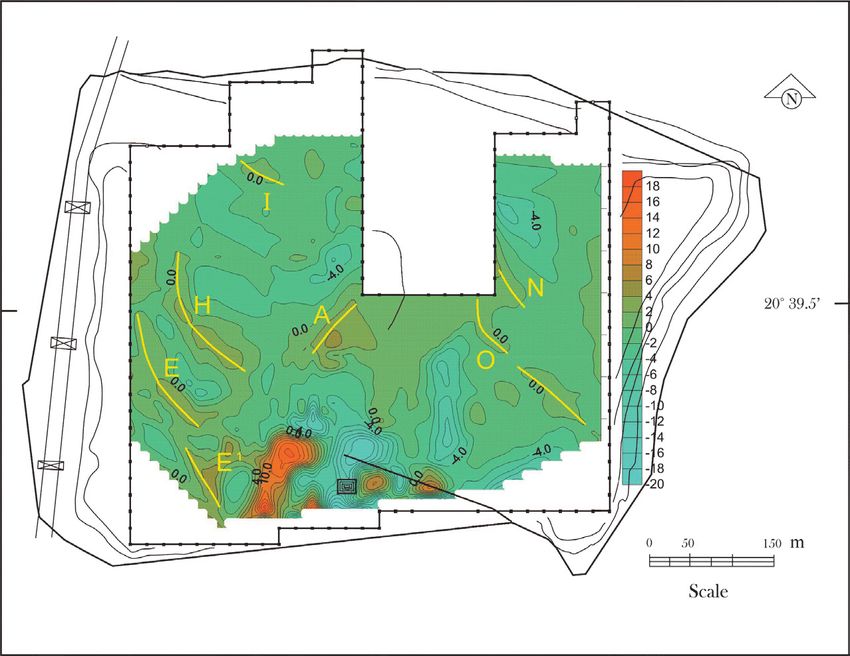
Geofísica Internacional

   Where f is a tilted angle (it is a wavetilt      support the presence of the path-sources
parameter).                                         inferred by mean of VLF anomalies.

    Tilt angle tangent and ellipticity are good     Study area description
approximations to in-phase and quadrature
components of vertical secondary field, respec-     The area corresponds to the urban waste
tively; both components can be employed to          Matatlan dumpsite of Guadalajara, Jalisco,
represent those components in acceptable            at western Mexico (Figure 1a). This dumpsite
limits, and to conduit an interpretation of         is named Matatlan that has been developed
results.                                            on top of a small plateau at the edge of the Rio
                                                    Grande de Santiago Canyon; this Canyon limits
Applications                                        to the north and east, the Guadalajara urban
                                                    area (Figure 1b). It comprises andesitic flows
VLF method is widely used in detection and          intercalated with rhyolithic emissions from
delineation of shallow conductors as well as        Cerro de la Reyna (Figure 1b). This dumpsite
in groundwater exploration and in engineering       started to work in 1989, receiving about 800
studies. The method has been combined with          tons per day, and closed in 2004 with a daily
seismic and magnetic methods to locate and          uptake of 1,500 tons.
to investigate fractures and cavities in carstic
environments, which constitutes an engineering          A private company controlled the dumpsite
and hydrogeology problem (Armadillo et al.,         several years, interspersed the waste with soil
1998); also has been used in mineral location       and coarse grain geologic material, constituted
(Bayrak, 2002), in Earth surface structure          mainly by andesitic and tobaceous fragments;
studies (Alexandros et al., 1999), in filtration    in this way, organic matter degradates and
studies of oil derived products at groundwater      non-contaminant organic gases are expulsed
(Benson, et al,1997), in archaeological zones,      to the atmosphere.
or in monitoring and assessing impact from
volcanic areas, in geological mapping, and             During summer there exists a large quantity
particularly to locate narrow fault zones           of leachates, when rainy season occurs.
(Phillips and Richards, 1975). In particular, VLF   Although there are catchment pits for the
has been employed with success in sites with        leachates in the edges of the site, high grade
pollution problems (Greenhouse and Harris,          fracturing at the andesitic basement could
1983), and in studies from mineralized areas        permit without-control migration of leachates
(Paál, 1968; Paterson and Ronka, 1971).             outside the dumpsite; this could impact
                                                    in a severe way the Canyon environment,
    One of the main impacts produced by             considered as a natural area that should be
dumpsites is ground and surface water               environmentally protected.
contamination, caused by leachates. The
contamination may lasts over 20 or 30 years         Adjacent local geology
after closure of the dumpsite (Kjeldsen et al.,
2002; Jones and Dixon, 2005; Christensen et         The dumping site is located in an island-plateau,
al., 2000; Bekaert et al., 2002). A leachate        surrounded by three canyons. Coyula Canyon
is the liquid that seeps to lower levels of         surrounds the site at its southwestern limits,
ground and extracts, dissolves or suspends          along the southern, and almost all its western
materials. The VLF method is very sensitive         portion to turn then into an E-W direction to
to water quality, as well as to the presence of     join the N-S to NW-SE Rio Grande de Santiago
hydrocarbons. Pollution is often favored by the     Canyon. In the north, the study area is limited
presence of large fractures and faults that acts    by a small canyon that also intersects the Rio
as conduits for the migration of contaminating      Grande de Santiago Canyon with an E-W to NE-
fluids. The VLF method is also sensitive to         SW direction (Figure 1b).
the presence of wet faults and fractures.
                                                       Dumpsite geologic features correspond to
    In this work is described a study in which      a boundary environment between two major
the VLF method was applied with success to          geologic provinces: the Sierra Madre Occidental
infer fractures. The case comprises an urban        (SMOc) and the Trans-Mexican Volcanic Belt
waste dumpsite, located at western Mexico.          (TMVB) (Figure 1a). Both provinces impose
VLF data in this area are analyzed with             their structural signature at the dumpsite.
Fraser (1969) and Karous-Hjelt (1983)               The dumpsite basement is formed by basaltic
techniques. At the dumpsite, it is expected         andesites and acid tuffs, according to
to recognize ground areas contaminated              petrographic analysis (Alatorre-Zamora, 2003).
with leachates. Fracture measurements               These volcanic products seem to proceed from

                                                                          July - September 2014    243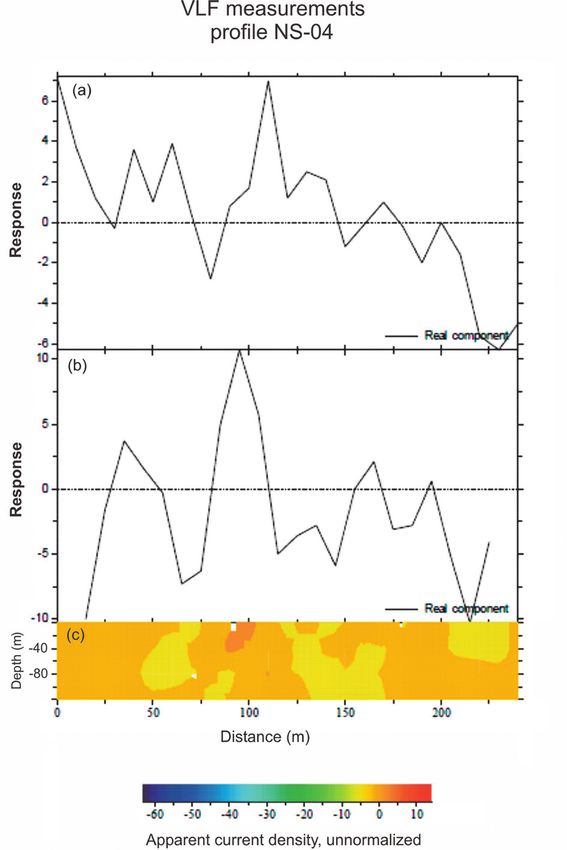
M. A. Alatorre-Zamora, J.O. Campos-Enríquez, S. Belmonte-Jiménez and J. Ibarra-Nuño

Figure 1. (a) Western Mexico showing main geologic features. CB-Ceboruco volcano; TZG- Tepic-Zacoalco Graben;
T-Tequila volcano; LP-La Primavera Caldera; G-Guadalajara urban area. (b) Detail of Guadalajara City and Matatlan
dumpsite location, marked with a gray triangle at the east of Guadalajara. A black circle south of the grey triangle
indicates the position of the andesitic volcano Cerro de la Reyna. The topographic curves are in meters above sea
level. (c) Detailed topography at Matatlan dumping site; the Rio Grande de Santiago Canyon is clearly observed.

244      Volume 53 Number 3
Geofísica Internacional

Cerro de la Reyna volcano. The outcroppings                    The zone is surrounded by major faults.
exhibit a high fracture degree (Figure 2) due               Neotectonic control from Quaternary volcanic
to a combination of tectonism (characterizing               activity reveals NW-SE alignments one of
a secondary porosity) with fractures originated             which is approximately tangent to Guadalajara
at cooling lava moment (characterizing a                    urban area (Luhr and Lazaar, 1985; Alatorre-
primary porosity). Tectonic origin is proposed              Zamora and Campos-Enríquez, 1991; Rosas-
by observation of fault striae in the outcrops,             Elguera    and    Urrutia-Fucugauchi,  1998).
although fractures due to listric movements                 Extensions occurring from Late Miocene at
are also possible.                                          the Guadalajara area have been postulated
                                                            in response to an initial opening of the S of
   First geological works in neighboring areas              California Gulf (Ferrari, 1995).
were done by Watkins et al. (1971), Mahood
(1980), Gilbert et al. (1985) and Luhr and Lazaar           Methodology
(1985). The surrounding area is characterized
by volcanic rocks successions, mainly pumitic                  Equipment
deposits with ignimbrites, rhyolites, andesites
and basaltic andesites intercalations. Into this            Equipment used in this case-study is an
general volcanic sequence the San Gaspar and                OMNI MAG Scintrex VLF equipment with three
Guadalajara ignimbrites are distinguished as                channels (Wright, 1988), to have access to three
good stratigraphic indicators (Gilbert et al.,              transmitting stations. For its management one
1985); standing out also are the so-called                  must know both the locations and frequency of
Guadalajara and San Cristobal groups, both                  power stations and parameters as provided by
from the Río Grande de Santiago Canyon and                  the instrument itself.
the Los Altos plateau, respectively.

Figure 2. Detailed diagram of the Matatlan dumpsite. Points are measuring stations, with 20 m of separation.
The box in the south is a pre-Columbian mound, whereas the boxes with two lines in diagonal, along the west
side, correspond to towers of high-voltage wire lines. Andesitic outcrops, showed as shaded areas, are indicated.
             The continuous lines that surround the site are indicators of the limits and topography.

                                                                                   July - September 2014     245
M. A. Alatorre-Zamora, J.O. Campos-Enríquez, S. Belmonte-Jiménez and J. Ibarra-Nuño
The OMNI MAG measures in-phase (Hx) geometric bodies (Paterson and Ronka, 1978).
and quadrature (imaginary, Hy) components Baker and Myers (1979) from laboratory
normalized with the main field, along with modeling obtain VLF responses similar to that
complementary information as primary field obtained by Paterson and Ronka (1978), who
intensity and tilt angle. In VLF methods both employ analytic methods.
electric and magnetic components can be used.
However, currently only the magnetic field H is A realistic VLF modeling of the subsurface
used, because it is easier to calculate. In fact, must take into account media with different
the vertical component Hz is analyzed, as it is conductivities, irregular geometry and aniso-
generated only by induction phenomena. The tropy to model VLF anomalies (Kaikkonen,
main field Hp lies almost in the horizontal plane. 1979). So far, these factors are difficult to
incorporate in numerical models to account for
VLF data real geologic situations. Models from Vozoff
(1971), Ward et al. (1974) and Kaikkonen
In Matatlan dumpsite, measurements were (1979) are applicable to very simple structural
realized in 1997 along N-S profiles. NAA situations and do not include the effect from
(located in Cuttler, Maine), NLK/NPG (located conductive shields (covers). The high electric
in Jim Creek, Washington State) and NPM conductivity of these shields avoid the EM wave
(located in Lualualei, Hawaii) stations were transmit to depth; this behavior reduces the
used, with respective frequencies of 24.8, searched thickness and produces a marginal
24.0 and 23.4 kHz (see Table 1). At the time penetration beneath the surface. Thickness
of these measurements NAA station showed a and electric conductivity of the upper layer (or
weak signal-to-noise ratio, so we decided to uppermost cover) control the VLF response
work with NLK/NPG station signal, assuming (Olsson, 1980).
the presence of perpendicular structures to line
of sight of this station. These measurements In a direct interpretative process Kaikkonen
were taken each 2Om, forming the data grid (1979) employs a finite element formulation
shown in Figure 2. In some areas it was not starting from Maxwell equations in the
possible to conduct measurements because of frequency domain, to model ellipticity, tilt angle
dumping works were been conducted at that and amplitude ratio; he uses isotropic and
time. High-voltage N-S transmission lines are anisotropic models of an inclined dike encased
located at the western side of the dumpsite in a resistive media. With the ellipticity and the
(Figure 2). A lineal distance near to 80 meters tilt angle it is possible to discriminate between
separates the measurement area from high- good and poor conductors. Both parameters
voltage lines. have same polarity for a poor conductor, but
ellipticity changes polarity and shape for a
VLF anomalies processing good conductor (Kaikkonen, 1979).
Traditionally, the interpretation of VLF tilt One of the first VLF inversion methods
angle data was conducted qualitatively. VLF was developed by Olsson (1980), that
quantitative interpretation owes its beginnings approaches an integral equation as a system
to Fraser (1969) and Karous and Hjelt (1983) of equations which is solved by iterative
filtering techniques. However, as with other numerical techniques (Olsson, 1980). In this
geophysical methods, VLF first interpretation way, response curves for different models
techniques are based on the use of simple with a conductive cover are obtained. Since
Table 1. VLF stations used in Matatlan dumpsite.
Station Operative Frequency Operative Frequency Location
for 1997 for 2007
NAA 24.8 KHz 17.8 KHz Cuttler, maine
(40° NE of Matatlan)
NLK/NPG 24.0 KHz 18.6 KHz Jim Creek, Washington
(20° NW of Matatlan)
NPM 23.4 KHz 23.4 KHz Lualualei, Hawai
(90° W of Matatlán)
246 Volume 53 Number 3Geofísica Internacional
then, several inversion methods have been direct modeling technique, provides good
developed, including 1-D inversion (Hjelt et locations of bodies and underground features
al., 1985), regularized bidimensional inversion giving rise to VLF anomalies. Karous and Hjelt
(Beamish, 1994), 3-D inversion (Beamish, (1983) based its algorithm on Biot-Savart law
1998), and VLF and VLF-R data joint inversion to describe the surface magnetic field of a 2-D
using simulated annealing (Kaikkonen and distribution. They assume a small horizontal
Sharma, 1998). In one case Hjelt et al. (1985) layer, with several current densities located
work with VLF-resistive data, which is an at a depth equal to the distance between
extension from conventional VLF-Z (Beamish, stations. When this method is used for data
1994) or VLF-EM techniques (Reynolds, 1998). correction, results can be contoured as a proxy
In VLF-R information from just one frequency of conductivity as a depth function.
is obtained, measuring perpendicular compo-
nents of electric and magnetic horizontal The idea of modeling VLF-EM data by mean
fields, giving in this manner impedance of Karous-Hjelt filtering technique consists
values. Beamish (1994) and Kaikkonen and basically in considering subsurface electric
Sharma (1998) also work with VLF-R data. heterogeneities as giving rise to current lines
Beamish (1994) makes an extension from a that distort primary EM fields. The developed
non-lineal inversion techniques for MT data lineal filter is applied in conjunction with a
to VLF-R measurements, employing a 2-D lowpass filter. As result this method provides
Occam procedure. a vertical distribution of apparent current
densities (López-Sánchez, 1998). These current
In this study we applied the filtering densities are associated with conductive zones
techniques of Fraser and Karous-Hjelt, as below the surface (Marroquin, 2000).
primary approximations to an interpretation of
VLF data. Formulation of Karous-Hjelt filter for
calculating current density, I(0,) is
Fraser filter
l(0) = k (−0.102H-3+0.059H-2−0.561H-1+0.059H2
Fraser filtering comprises a process applied to +0.102H3) (1.1)
data profiles whose results can be contoured.
This method (Fraser, 1969) is designed for those where k depends from station interval and Hn
parameters that exhibit a response with zero is the n-th stations behind (-) or forward (+) of
crossings, as in the in-phase vertical component filtered station (0).
(Hx) or the tilt angle of the polarization ellipse
(a). In this method horizontal gradients We have employed academic computer
are calculated and parts of the data are programs developed by Edsen and Nissen
smoothed, so as to place the maximum value (1997) and Pirttijärvi (2004); the first one
over a conductive surface. This is obtained forms the direct models with cells with constant
with the following relation (Bayrak, 2002), resistivities and variable dimensions and
depths. The second one applies both the Fraser,
F2,3 = (M3 + M4) − (M1 + M2) (1.1) and Karous-Hjelt filters. The interpretation of
the profiles obtained in this study was done in
where F are the stations, the subscript are two steps.
the station numbers, whereas M1 to M4 are
consecutive tilt angle stations (Bayrak, Results and discussions
2002). This anomaly is antisymetric over
conductors, and is often indicated as Fracture measurements
gradient. The anomaly is convolved along
several profiles, with the filter adjusting its A Brunton compass was used to measure
length to the anomaly shape. orientation of a wide group of fractures along
the three existing outcroppings located inside
The interpretation of the results is and around the dumpsite limits (Figure 2).
qualitative. Very sharp responses indicate
shallow sources, whereas wide anomalies The southern and northern outcrops
progressively indicate deeper sources. consist of densely fractured basaltic andesites,
whereas that to east comprises andesites plus
Karous-Hjelt filter altered tuffs (Figure 2).
A very interesting technique for interpreting The orientation of the fractures were plotted
VLF data is based on the filter designed by in a polar histogram with divisions each five
Karous and Hjelt (1983), that although is a degrees (Figure 3). The statistic analysis shows
July - September 2014 247M. A. Alatorre-Zamora, J.O. Campos-Enríquez, S. Belmonte-Jiménez and J. Ibarra-Nuño
the presence of primary and secondary fracture or spatial variations of the signal. These
groups. Among the primary groups the most variations are attributed to anthropogenic
conspicuous has a North-South direction; the noise and often have a typical morphology.
second one has N75-80E orientation; the third Along the western boundary runs a high
one has a mean azimuth of N60-65W direction, voltage line but its noisy effect (high amplitude
and the last one has a N25-30W direction. and strong separation between components
There are two secondary alignment groups after Bozzo et al., 1994) is not as obvious as
that may be related to the primary directions. the effect induced by the metallic fence that
The most clear of them presents a N45-55E surrounds a pre-Columbian mound, at the
orientation, whereas the last one is outlined south center of the area (Figures 4a, 4b and
with a 90E direction. These fracture groups are 5a). The effect of the high voltage lines can be
referred to as A to F, respectively (Figure 3). observed only in the first 40 m approximately,
Pattern A coincides with the direction of the Rio whereas the wire fence surrounding the pre-
Grande de Santiago Canyon, whereas pattern Columbian mound produces an effect due
F has the same direction as Coyula Canyon in to its high conductivity. Its influence is still
its main part. observed at approximately 70 meters away
from the mound (see Figures 4a, 4b and 5a).
VLF parameters
Conspicuous anomalies in the in-phase and
Although the kind of information provided by the the out-of-phase components, (Figures 4a and
VLF method must be filtered to be represented 4b) occur at points where leachate ponding
in contour maps (what emphasizes positive is very extensive (A in Figures 4a to 5b). An
features), it was decided to first present in interesting observation that arises from the
raw form the in-phase, the out-of-phase, and comparison of the two maps is the north-south
tilt angle. Using triangular interpolation, we elongated feature of the central part, which is
contoured the respective maps of the VLF positive in both components (B in Figures 4a
parameters showed at Figures 4a, 4b, and and 4b) but is accompanied by a negative in the
5a. These results will now be qualitatively in-phase component (referred to C in Figures
interpreted. 4a and 5a). In addition, areas of deposition
and new mixed garbage at the date of the VLF
Frequently occurring fluctuations in VLF survey are clearly visible as closed anomalies
measurements are not caused by temporal (D in Figures 4a to 5b). This behavior prevails
in the northeastern part of the landfill, which
is seen as a major negative pattern in the in-
phase component (Figure 4a).
Many times the VLF response simply can
not be interpreted. This is due to overlapping
effects of other anomalies, and attenuation and
phase change induced by conductive cover.
Certainly, the bulk of the interpretation in
the VLF method remains up today qualitative
in nature. In fact, until 1980 the interpretation
was mainly based on qualitative arguments,
neglecting the influence of rock covers and
guest conductors (e.g., Olsson, 1980). A more
complete interpretation should include the
recognition of type anomaly selecting a general
model type, and some rudimentary analysis to
locate depths to the source. In addition, some
general idea would be obtained about, for
example, the conductivity of the target.
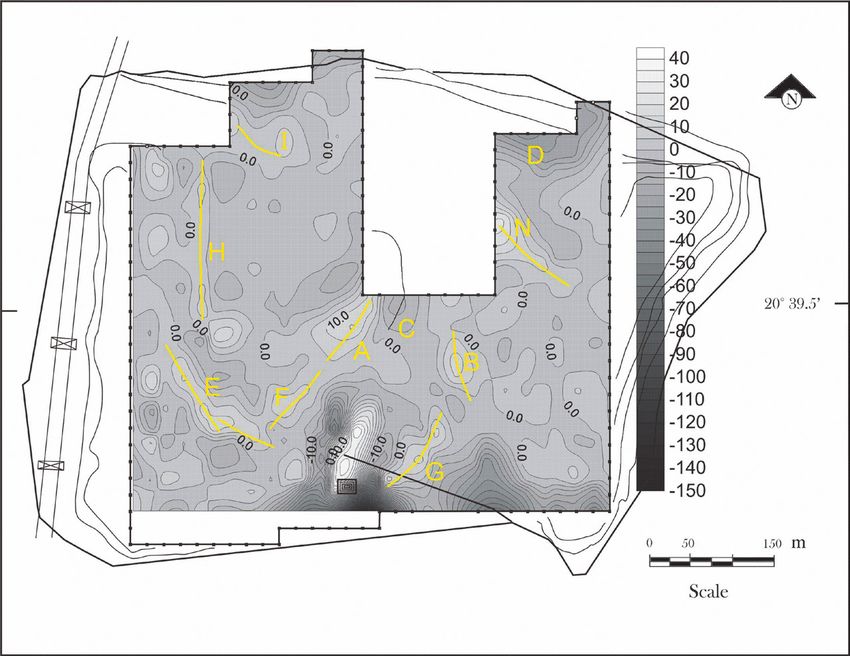
The differences between tilt angle (Figure
5a) and its respective 3D Fraser-filtered map
(Figure 5b) are more or less significatives.
Figure 3. Polar histogram from fracture pattern One of these differences is that the elongated
measurements in andesitic outcrops showed in the N-S minimum located at centre of the dump
Figure 2. The divisions are given each 5°. The letters in the tilt angle map (C in Figure 5a) has
indicate main directions of groups of fractures.
248 Volume 53 Number 3Geofísica Internacional
Figure 4. (a) VLF field in-phase
component contoured each 2.0 a)
%. Values in the scale at the
left side are in %. The letters
indicate most conspicuous
anomalous features. (b) VLF
out-of-phase component
contoured each 1%. Values
in the scale at the left side
are in %. The letters indicate
most conspicuous anomalous
features.
b)
been smoothed and eastward displaced in the centre occurs the major quantity of elongated
filtered map (Figure 5b). Main positive features positive anomalies, with NW-SE, N-S, and NE-
in the filtered map could be interpreted in two SW orientations (A, E, F, H, and I in Figure 5b),
ways: 1) the elongated positive feature on the whereas in the eastern portion, it seems to be
west side (E in Figure 5b) may be due to a present some NW-SE and N-S anomalies (B, D,
structure roughly oriented NW-SE that acts G, and N in Figure 5b). Their orientations are
as conduit for leachate, and 2) the positive highlighted with continuous lines in Figure 5b.
feature referred to as A in Figure 5b, might be Their elongated nature could indicate a major
due to an accumulation of lixiviates. Altogether, fracture system or groups of fractures. The
three main groups of elongated anomalies southeastern portion is featured by very small
can be noted. In the western half and in the and isolated anomalies.
July - September 2014 249M. A. Alatorre-Zamora, J.O. Campos-Enríquez, S. Belmonte-Jiménez and J. Ibarra-Nuño
Figure 5. (a) Tilt angle
contoured each 2%. Values a)
in the scale at the left side
are in %. The letters indicate
most conspicuous anomalous
features. (b) Fraser filtering
applied to tilt angle. Contours
are given each 5%. Values
in the scale at the left side
are in %. The letters indicate
most conspicuous anomalous
features. Yellow continuous
lines are structure alignments
inferred.
b)
Quantitative Interpretation of the most representative modeled profiles
are presented.
In a first quantitative step we applied the
Fraser and Karous-Hjelt’s technique modified The modeling was based on the VLFMOD
to model VLF data by means of cell-shaped program from Edsen and Nissen (1997), which
sources with constant resistivities (Edsen and models VLF-EM or VLF-R data and generates a
Nissen, 1997). Several N-S and E-W profiles, simple model considering the source frequency
corresponding to 24 KHz, were selected (Figure and just one resistivity for the host media.
6) for this purpose (Alatorre-Zamora, 2003) This simple model can then be modified or
considering the behavior of real and imaginary other bodies can be added. In this case the
components, and taking into account noise respective model was formed based upon
areas covered within the survey, and results information given by resistive tomography
obtained by other geophysical methods (Alatorre-Zamora, 2003) and potential field
(Alatorre-Zamora et al., submitted); just three models (Alatorre-Zamora et al., submitted).
250 Volume 53 Number 3Geofísica Internacional
Figure 6. Location of
interpreted profiles at Matatlan
dumpsite. Solid black lines
are profiles interpreted with
VLFMOD program, whereas
gray dashed lines are profiles
interpreted with KHFFILT
program. Symbols like WE10
or SN11 are the names of the
consecutive profiles.
In this first stage our models comprise cells This fault zone seems to have reached a depth
simulating fault or fracture zones, approach between 10 to 20 m, and in general show a
part of the landfill, and the top of the andesitic southern dip. The same structure is observable
basement. In all cases, we assume a variable in the Fraser filtered map (A and F elongated
resistivity for the host layer along the dump- features in Figure 5b).
site due to the presence of soil plus urban
waste composition for the overall site, and Another important feature of the models
andesitic blocks mainly at the SW sector. constitutes the use of a resistivity value for
Indeed, andesitic blocks could occur beneath the host material of the sources, consistent
the entire study area, but they are covered with the andesitic basement of the landfill.
by terrigenous material and the proper waste This establishes that the lowest body cells
disposal, and this fact is considered in the seem to show the topography of the andesitic
modeling. The resistivity for the host layer basement, i.e., this basement has depths from
varies from 170 to 440 W-m. To the andesitic 5 to 7.5 m.
basement were assigned resistivities from
92 to 268 W-m along the profiles, whereas The low resistivity values assigned to the
fault and fracture zones were assigned lower structures inferred as faults let to assume that
resistivities. Interpreted profiles are showed in these structures allow the migration of leachate
Figures 7a to 7c. to lower levels in the basement, although the
fault zones inferred are deeper than the top of
Although adjustment errors between the andesitic basement (i.e., they cut it). The
computed and observed component anomalies resistivities decrease with leachate, and this
are large, the outlined behavior of the computed seems to cause these anomalies.
anomalies is fairly similar to observed ones.
These misfits show the difficulty to model VLF Fault zones actually agree with those
data, specially the imaginary (or out-of-phase) inferred by mean of resistive tomography
component. and magnetics and gravity interpretation
(Alatorre-Zamora, 2003; Alatorre-Zamora et
EW-8, EW-9 and EW-10 profiles show al., submitted).
continuity both in anomaly behavior and in
location and resistivities of modeled bodies In a second step we conduit a profile
(Figures 7a to 7c). An example is represented interpretation using the Pirttijärvi’s (2004)
by the fault zone inferred at about 300 m, KHFFILT non-commercial program. This
with a proposed resistivity from 70 to 36 W-m applies the Karous-Hjelt filtering technique
(black filled boxes in profiles EW-08 to EW-10; and provides the vertical distribution of
in general, small boxes in these three profiles). apparent current densities (López-Sánchez,
July - September 2014 251M. A. Alatorre-Zamora, J.O. Campos-Enríquez, S. Belmonte-Jiménez and J. Ibarra-Nuño
Figure 7. (a) Direct Model of WE-8 profile, traced
in Figure 6. The source bodies have resistivities in
W-m and dimensions D in meters. S is a halfspace
considered as host rock. Dark curves correspond
to VLF in-phase component, whereas gray curves
are the out-of-phase component. Small black boxes
simulate fault or fracture zones; the rest of the boxes
correspond to andesitic basement and hosting rock;
(b) Direct Model of WE-9 profile, traced in Figure
6. The source bodies have resistivities in W-m and
dimensions D in meters. Smaller boxes simulate fault
or fracture zones; (c) Direct Model of WE-10 profile,
traced in Figure 6. The source bodies have resistivities
in W-m and dimensions D in meters. Smaller boxes
simulate fault or fracture zones.
1998), which can be interpreted as to represent (Karous and Hjelt, 1977). Besides, peaks
conductive zones below the surface (Benson in the Fraser filter profile locate conductive
et al., 1997; Marroquin, 2000). In addition, structures.
the software provides a Fraser filtered profile,
which correlates with the Karous-Hjelt filtered Good correlation between the peaks of
profile. Fraser filter and conductive zones (survey
as inferred by high current density values)
For each profile three plots are shown (see of Karous-Hjelt filter is observed for profile
Figure 8a). The upper panel presents the raw NS-04 (Figure 8b). The profile NS-02 does
data. The middle one presents the Fraser filtered not show conductive surfaces below the
profile. Finally, the lower panel corresponds to peaks of Fraser filtering (Figure 8a). This
Karous–Hjelt (K-H) filtered profile, where could be significative, because this last
we can note that low current density values profile corresponds almost entirely to the
correlates with high resistivity values western sector of the dumpsite (Figure 6),
252 Volume 53 Number 3Geofísica Internacional
whereas many conductive sources, as most To enable a better visualization of
recent deposition of waste and terrigenous positive KH features, image maps with
material at the time, as well as the presence the resulting current densities from the
of heavy machinery, occurred at the NE modeled profiles were elaborated. These
part of the site. maps are showed in Figures 9a and 9b, and
represent pseudodistributions of current
Correlation of parallel Karous-Hjelt density at depths of 20 and 40 m.
filtering profiles makes it possible to observe
the continuity of features attributable to In these results it is possible to consider
planar sources as fault and major fracture that there is not effect from conductive
zones. In this manner we can appreciate cover. Three main high current density
the presence of 2D structures that are features which have continuity in depth are:
orthogonal to the VLF station used, it is to 1) an almost NE-SW elongated feature at
say, they are normal to NAA station, which the centre of the area (A in Figures 9a and
has an NE-SW orientation with respect to 9b); 2) two elongated lineaments located
Matatlan dumpsite. This indicates that we in the western half of the site, that are
must infer mainly structures with NW- parallel, with a N-S direction to the north,
SE directions. According to the statistical and become NW-SE to the south (E and H
analysis of fractures, we expect to locate in Figures 9a and 9b). These last features
fractures similar to groups C and D (see reach depths of 40 m (Figure 9b), where
Figure 6). they are clear; 3) a minor feature at the
NW sector, whose direction is NW-SE (I in
Figures 9a and 9b).
Figure 8. Fraser and Karous-Hjelt filtering results for the NS-02 (left plot) and NS-04 (right plot) profiles at
Matatlan dumpsite. (a) raw data, given in %; (b) Fraser filter result, and (c) pseudosection of current density
resulting to apply Karous-Hjelt filter.
July - September 2014 253M. A. Alatorre-Zamora, J.O. Campos-Enríquez, S. Belmonte-Jiménez and J. Ibarra-Nuño
Figure 9. (a) Current density
pseudodistributions located at
20 m in depth obtained with
Karous-Hjelt filter; (b) Current
density pseudodistributions
located at 40 m in depth
obtained with Karous-Hjelt filter.
These elongated high current density Comparing maps from Figures 9a and
features could be owed to a major fracture 9b, a major high current density between
system. A higher current density elongated 0 and 20 m is observed (Figure 9a); at this
feature that is not referred to in Figure 9b depth range, the higher value is located
is observed also at 40 m in depth, in the conspicuously, near the pre-Columbian
SW edge of the site. It could be caused by mound, at the south side of the site.
the metallic fence that surrounds the pre-
Columbian mound, but it does not appears Whereas some anomalies could be
at 20 m. Its almost N-S direction and produced by leachate filtration or leacha-
its position (location) coincides with the te presence into the dumpsite layer, the
outcropping there located. southern one near to the mound would be
due to a wide fault zone.
254 Volume 53 Number 3Geofísica Internacional
Comparison between VLFMOD and Conspicuous anomalies in both, the in-
KHFFILT results is possible, although in the phase component and the out-of-phase
first case we have a direct modeling, whereas component occur with N-S orientation at the
the second one provides vertical current central and westernmost parts of the dumpsite.
density pseudodistributions. KHFFILT Areas of deposition and new mixed garbage at
seems to give better approximations the date of the VLF survey are clearly visible
when their results are combined together as closed negative anomalies in the in-phase
with Fraser results. Nevertheless, the component. Tilt angle parameter showed the
modeled cells in the direct approach have same behavior as the in-phase component.
parameters as resistivity and location that
show fair correlation with Karous-Hjelt The Fraser filtered results presents nine
filtering results, showing that there is a features of interest to the scope of the study.
good agreement (correlation) between the Four of them are NW-SE oriented, whereas
results of both methods used. three have NE-SW directions. The most
conspicuous anomalous feature, however,
Comparison between 3D Fraser filtered has a long N-S direction, and is located at the
results and KHFFILT results (Figures 5b, westernmost part of the site.
with Figures 9a and 9b) indicates very
interesting correlations. Both techniques With respect to the K-H filtering results,
highlight same features that could be three main high current density features are
the signature of faults or major fracture inferred which have continuity with depth:
systems. The major similarity occurs 1) an almost NE-SW elongated feature at
between results from Figure 5b and Figure the centre of the area, 2) two elongated N-S
9b, showing a strong continuity for the VLF parallel lineaments located in the western
anomalies with depth. half of the site, that become NW-SE to
the south. These last features continue in
We finally observe two generalized features: depth, being most clear at 40 m depth, 3)
(1) several positive features with orientations a minor feature at the NW sector, whose
mainly NW-SE that appears along the dumpsite, direction is NW-SE. These elongated high
would show a possible influence of Tepic- current density features could be owed to
Zacoalco rift. (2) The long N-S positive feature fracture systems. A higher current density
given by the two techniques and the 3D Fraser elongated feature is observed also at a
filtered tilt angle, at the westernmost sector of depth of 40 m, in the SW edge of the site. It
the dumpsite, could be result of the tectonic could be caused by the metallic fence that
that controls the Rio Grande de Santiago surrounds the pre-Columbian mound, but it
Canyon. This last could be of listric nature. does not appears at 20 m. Its almost N-S
direction and its location coincide with the
Conclusions andesitic outcrop there located.
Very low frequency geophysical method has The comparison between Fraser and Karous-
been proved to be an excellent media to infer Hjelt filters and two different techniques that
2D structures as faults and fractures through provides model sources and current distribution
which water or contaminants flow might take respectively, showed good-to-fair results in the
place. Thereby providing a means to recognize location of some fracture or fault zones.
and delineate the presence of 2D structures
as faults and fractures that could function as Finally, it is interesting to note the
migration paths for the leachates in urban correlation between the lineaments
waste dumpsites. Here we can conclude about inferred by means of the cooperative use
the use of three techniques to interpret VLF of both techniques, based on K-H and
data, that is, the Fraser filter applied to tilt VLF the Fraser filter and the major tectonic
parameter, Karous-Hjelt filter applied to in- features. Accordingly, a N-S structure in the
phase and out-of-phase VLF components, and westernmost part of the zone, that have
a modified K-H filtering technique applied to same direction as Rio Grande de Santiago
the same components as a direct modeling, in Canyon, as well as NW-SE features, mainly
the scope of the task described previously. in the western half of the site. These NW-
SE features coincide with the directions
The statistic analysis of fracture direction of the Tepic-Zacoalco rift. Others NE-SW
measurements showed the presence of features appear towards the centre of
primary and secondary fracture groups. The the area. These facts correlate with the
primary groups have N-S, NE-SW, and NW-SE predominance of fracture groups showed in
directions, in order of predominance. the fracture analysis.
July - September 2014 255M. A. Alatorre-Zamora, J.O. Campos-Enríquez, S. Belmonte-Jiménez and J. Ibarra-Nuño
Finally, the structures inferred and their Beamish D., 1994, Two-dimensional, regulari-
directions could act to migrate lixiviates sed inversion of VLF data. Journal of Applied
outside the dump, mainly towards the Coyula Geophysics, 32, 357-374.
Canyon, located along the south border of the
site, as well as in a minor effect towards the Beamish D., 1998, Three-dimensional modeling
Rio Grande de Santiago Canyon. of VLF data. Journal of Applied Geophysics.,
39, 63-76.
Acknowledgements
Bekaert C., Budka A., Lambolez-Michel L.,
The first author was supported with a grant Matichard Y., Martin I., 2002, Los vertederos
from SUPERA-PROMEP and is indebted to y el desarrollo sostenible. Revista Residuos,
CAABSA-EAGLE for allowing the study. The text 64 páginas.
improved thanks to criticism of Dr. Shevnin and
an anonymous reviewer. Benson A.K., Payne K.L., Stubben M.A., 1997,
Mapping groundwater contamination using
References dc resistivity and VLF geophysical methods—
A case study. Geophysics, 62, 80–60.
Alatorre-Zamora M.A., Campos-Enríquez J.O.,
1991, La Primavera Caldera (Mexico): Bozzo E., Lombardo S., Merlanti F., 1994,
structure inferred from gravity and VLF prospecting: observations about field
hydrogeological considerations. Geophysics, experiments. Annali di Geofisica, 37, 5
56, 992-1,002. páginas.
Alatorre-Zamora M.A., 2003, Estudio Geofísico Campos-Enríquez J.O., Alatorre-Zamora M.A.,
Integrado Realizado en el Vertedero 1998, Shallow crustal structure of the
de Desechos Urbanos de la Ciudad de junction of the grabens of Chapala, Tepic-
Guadalajara. Ph D Thesis. Instituto de Zacoalco and Colima, Mexico. Geofísica
Geofísica, UNAM. 132–154 pp. Internacional, 37, 263-282.
Alatorre-Zamora M.A., Campos-Enríquez J.O., Christensen T.H., Cossu R., Diaz L., Lechner
Chávez-Segura R., Belmonte-Jiménez S.I., P., Stegmann R., Lagerkvist A., 2000,
in press. Mapping major fractures affecting Alternative approach to the elimination
the basement of an urban waste dump of greenhouse gases from old landfill.
(Matatlan, western Mexico). Assessment of Curso superior sobre gestión y diseño
use of Euler deconvolution, analytical signal, de vertederos. CER (Club Español de los
and the micromagnetic method. Submitted Residuos).
to Near Surface Geophysics.
Edsen N.A., Nissen J., 1997, VLFMOD, a free
Alexandros S. Savvaidis, Tsokas G.N., forward VLF modeling software package.
Vargemezis G., Dimopoulos G., 1999, ftp: http://home1.swipnet.se/~w-11019/
Geophysical prospecting in the Akropotamos ABEM-ftp/
dam (N. Greece) by GPR and VLF methods.
Journal of the Balkan Geophysical Society, Ferrari L., 1995, Miocene shearing along the
2, 120-127. northern boundary of the Jalisco block
and the opening of the southern Gulf of
Armadillo E., Massa F., Caneva G., Gambetta California. Geology, 23, 751-754.
M., Bozzo E., 1998, Modelling of Karst
structures by geophysical methods. An Fraser D.C., 1969, Contouring of VLF-EM data.
example: the doline of S. Pietro dei Monti Geophysics, 34, 958-967.
(Western Liguria). Annli di Geofisica, 41, 3
páginas. Gilbert C.M., Mahood G.A., Carmichael
I.S.E., 1985, Volcanic stratigraphy of
Baker H.A., Myers J.O., 1979, VLF-EM model the Guadalajara area, Mexico. Geofísica
studies and some simple quantitative Internacional, 24, 169-191.
applications to field results. Geoexploration,
17, 55-63. Greenhouse J.P., Harris R.D., 1983, Migration
of contaminants in groundwater at a landfill:
Bayrak M., 2002, Exploration of chrome ore in a case study, 7. DC, VLF, and inductive
Southwestern Turkey by VLF-EM. Journal of resistivity surveys. In: J.A. CHERRY (Guest
the Balkan Geophysical Society, 5, 35-46. Editor), Migration of contaminants in
256 Volume 53 Number 3Geofísica Internacional
groundwater at a landfill: A Case Study. Paterson N.R., Ronka V., 1971, Five years of
Journal of Hydrology, 63, 177-197. surveying with the Very Low Frecuency
Electromagnetics Method. Geoexploration,
Hjelt S.E., Kaikkonen P., Pietila R., 1984/85, 9, 7–26.
On the Interpretation of VLF Resistivity
Measurements, Geoexploration, 23, 171-181. Phillips W.J., Richards W.E., 1975, A study of
the effectiveness of the VLF method for the
Jones D.R.V., Dixon N., 2005, Landfill lining location of narrow-mineralized fault zones.
stability and integrity: the role of waste Geoexploration, 13, 215-226.
settlement. Geotextiles and Geomembranes,
23, 27-53. Pirttijärvi M., 2004, Karous-Hjelt and Fraser
filtering of VLF measurements, version
Kaikkonen P., 1979, Numerical VLF modeling, 1.1a, http://www.cc.oulu.fi/~mpi/Softat/
1979, Geophysical Prospecting, 17, 815-834. Khffilt.html
Kaikkonen P., Sharma S.P., 1998, 2-D nonlinear Reynolds J.M., 1998, An Introduction to Applied
joint inversion of VLF and VLF-R data using and Environmental Geophysics, John Wiley
simulated annealing, Journal of Applied & Sons, eds., 796 pp.
Geophysics, 39, 155-176.
Rosas-Elguera J., Urrutia-Fucugauchi J., 1998,
Karous M., Hjelt S.E., 1983, Linear filtering Tectonic control of the volcanosedimentary
of VLF dip-angle measurements, Geoph. sequence of the Chapala graben, western
Prospecting, 31, 782-794. Mexico. Intern. Geol. Rev., 40, 350-362.
Kjeldsen P., Barlaz M.A., Rooker A.P., Baun A., Saydam A.S., 1981, Very low frequency electro-
Ledin A., Christensen T.H., 2002, Present magnetic interpretation using tilt angle and
and long-term composition of MSW landfill ellipticity measurements. Geophysics, 46,
leachate. A review. Critical Reviews In 1594-1605.
Environmental Science and Technology, 32,
297-336. Sinha A.K., 1990a, Interpretation of ground
VLF EM data in terms of inclined sheet like
Lopez-Sanchez M., 1998, www.geophysicsgpr. conductor models. PAGEOPH, 132, 213-
com/aben/wadi_vlf.htm. 231.
Luhr J., Lazaar P., 1985, The southern Vozoff K., 1971, The effects of overburden on
Guadalajara volcanic chain, Jalisco, Mexico. vertical component anomalies in AFMAG
Geofísica Internacional, 24, 691-700. and VLF exploration: a computer model
study. Geophysics, 36, 53-57.
Mahood G.A., 1980b, Geological evolution
of a Pleistocene rhyolitic center – Sierra Ward S.H., Ryu J., Glenn W.E., Homann G.W.,
La Primavera, Jalisco, Mexico. Journal of Dey A., Smith B.D., 1974, Electromagnetic
Volcanologic and Geothermal Research, 8, methods in conducive terrains.
199-230. Geoexploration, 12, 121-183.
Marroquin I.D., 2000, Proyecto de Maestría. Watkins N.D., Gunn B.M., Baksi A.K., Ade-Hall
www.wlba.net/ivan/vprm.es.html. J., 1971, Paleomagnetism, geochemistry,
and potassium-argon ages of the Río Grande
Milsom J., 2003, Field Geophysics, 3° edition; de Santiago volcanics, central Mexico.
John Wiley & Sons, 244 Pp. Geological Society of America Bulletin, 82,
1,955-1,968.
Olsson O., 1980, VLF Anomalies from a
perfectly conducting half plane below an Wright J.L., 1988, VLF interpretation manual:
overburden. Geophysical prospecting, 18, EDA Instruments (now Scintrex), Toronto.
415–434.
Paál G., 1968, Very low frequency measure-
ments in northern Sweden. Geoexploration,
6, 141-149.
July - September 2014 257You can also read