IMPLEMENTING AUGMENTED REALITY SANDBOX IN GEODESIGN: A FUTURE - ISPRS Annals
←
→
Page content transcription
If your browser does not render page correctly, please read the page content below
ISPRS Annals of the Photogrammetry, Remote Sensing and Spatial Information Sciences, Volume IV-4, 2018
ISPRS TC IV Mid-term Symposium “3D Spatial Information Science – The Engine of Change”, 1–5 October 2018, Delft, The Netherlands

     IMPLEMENTING AUGMENTED REALITY SANDBOX IN GEODESIGN: A FUTURE
                           FOR GEODESIGN
                                                        A. Afrooz 1 *, H. Ballal 2, C. Pettit 1
1   Faculty of the Built Environment, The University of New South Wales, Sydney, Australia – (a.eslamiafrooz, c.pettit)@unsw.edu.au
                               2 Managing Director at Geodesignhub Pvt. Ltd.- (hrishi@geodesignhub.com)

                                                          Commission VI, IV/9

KEY WORDS: Geodesign, Augmented Reality sandbox, 3D modelling, trail design

ABSTRACT:

Geodesign method and tools are extensively used for collaborative decision making focused on different fields such as
transportation, land use, and landscape and has been applied in various places around the world. Nowadays, Augmented Reality
(AR), Virtual Reality (VR) and more recently AR sandbox are increasingly becoming very popular particularly as a pedagogical tool.
This research aims to investigate whether an AR sandbox could enhance the understanding of people around the development of
design proposals and their impacts. We explored if AR sandbox could be implemented in a collaborative geodesign workflow. We
reported an experiment where people were asked to build new trails using the sandbox and how the trails they designed were
integrated with a larger design. Results explore opportunities and limitations of implementing AR sandbox in a collaborative
geodesign workflow based on the experiment in this paper. Our AR sandbox experiment revealed a wide range of benefits to
participants in the trail planning and to the geodesign structure.

                      1. INTRODUCTION                                  reading urban planning and architectural blueprints (Liben
                                                                       2007) - is usually challenging for people. Due to this reason
1.1 Introduction                                                       different laboratories around the world are utilizing AR sandbox
                                                                       to allow students to be quickly immersed in the learning process
The integration of the design process with new technology has          through a more intuitive approach. This innovative 3D
been advocated by a group of scholars and technologists                visualisation technique and real-time augmented user interface
including Bill Miller, an architect and engineer at ESRI and           proved to allow students to understand and create the real world
Carl Steinitz, an urban designer professor at Harvard University       in urban planning and design (Petrasova et al. 2015) hydrology
(ESRI 2010). The origins of geodesign dates back to 1960s with         (Petrasova et al. 2015), geoscience (Kreylos et al. 2016) and
the publication of “Design with nature” by McHarg (1969)               geography (Jenkins et al. 2014) in visualising and analysing
(Haddad 2015). Steinitz proposed many ideas and he defined             different themes such as flooding hazards, soil erosion,
geodesign as “changing geography by design” (Steinitz 2012).           watershed development, viewshed analysis, coastal modelling
                                                                       and trail planning (Petrasova et al. 2015).
Geodesign is a “methodology” that provides a design
framework (Steinitz 2012). Steinitz (2012) defined geodesign as        This study is one of the first empirical studies that is
“a set of concepts and methods that are derived from both              concentrated on the implication of the AR sandbox in geodesign
geography and other spatially oriented sciences, as well as from       structure. Looking at an example of geodesign workshop in
several of the design professions, including architecture,             Sydney, Australia (Pettit et al. 2017) this paper attempts to
landscape architecture, urban and regional planning,...” (p.1). In     bring a more intuitive approach in engaging participants in
other words, geodesign is based on geographic sciences, and            future geodesign workshops by proposing Augmented Reality
interactions and negotiations between professionals and the            (AR) sandbox. Geodesignhub and AR sandbox are tools that
people of the place. It is based on data, analysis, and design         provide support to planning and visioning processes. One of the
(Miller 2012).                                                         goals for this research was to test the effectiveness of these tools
                                                                       in comprehension and the quality of interventions developed.
On the one hand, there are many visualisation techniques to            We are interested in the application of AR sandbox as a tool to
support place based analysis (Pettit et al. 2012). In recent times     help people better understand and engage in place based design.
we are seeing a growing body of research and development in            Accordingly, the focus of the paper is on the role of AR
Augmented Reality (AR), and Virtual Reality (VR) in the                sandbox as an interface to various components of the geodesign
context of city planning and design (Jiang et al. 2018).               process. In other words, this paper is proposing and evaluating
                                                                       an AR Sandbox visualisation approach for supporting the
On the other hand, there are many forms of thinking such as            geodesign collaborative approach which could be used in future
verbal, hypothetical, statistical and so on. In science or any field   geodesign workshops. The main reason for using tools like
multiple forms of thinking are being used. Spatial thinking is         Geodesignhub and AR Sandbox are to help the participants
one form of thinking and is a collection of cognitive skills           develop a deeper understanding of the problems, the design
(National Academies Press (U.S.) 2006). However, spatial               tradeoffs. These tools provide intuitive interfaces to enable
thinking – a form of human cognition which can be used in              interactions. The primary objective was not to do advanced

* Corresponding author

           This contribution has been peer-reviewed. The double-blind peer-review was conducted on the basis of the full paper.
                           https://doi.org/10.5194/isprs-annals-IV-4-5-2018 | © Authors 2018. CC BY 4.0 License.                         5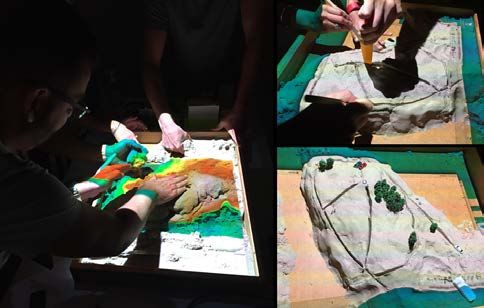
ISPRS Annals of the Photogrammetry, Remote Sensing and Spatial Information Sciences, Volume IV-4, 2018
ISPRS TC IV Mid-term Symposium “3D Spatial Information Science – The Engine of Change”, 1–5 October 2018, Delft, The Netherlands

spatial analysis (although it is possible to do given the digital    a set of interventions as the best and final design options. This
nature of these tools) but to invite the participants to negotiate   collaborative process is supported by software in 2D; however,
about the future of the place.                                       in some cases 3D modelling of the final negotiation plan can be
                                                                     prepared using JavaScript and/or CityEngine using API
To investigate the aim of the study, two geodesign systems           connections (an example of Sydney workshop 2016).
focusing on (i) tourism and (ii) active transport are selected
from the completed Sydney Botany Bay Geodesign workshop              Steinitz (2012) proposed a comprehensive framework for
(Pettit et al. 2017). An experiment was designed, with               geodesign. The framework asks six questions and has six
participants tasked with building new “trails or pathways” for       corresponding models as follow:
the fore mentioned two systems. Although trail design is a
product of expert knowledge and site surveying, spatial thinking     1. “How should the study area be described?” (Representation
support through geospatial modelling can be used for this            models);
purpose (Petrasova et al. 2015).                                     2. “How does the study area operate?” (Process models);
                                                                     3. “Is the current study area working well?” (Evaluation
This paper is organized in five parts. First, it describes the       models);
geodesign workflow and framework, and the AR sandbox.                4. “How might the study area be altered?” (Change models);
Second, in methods section, we provide background material on        5. “What differences might the changes cause?” (Impact
a study area from the first geodesign workshop in Australia          models); and
which was held in Sydney 2016. A case study is selected within       6. “How should the study area be changed?” (Decision models)
the previous study area and an experiment is conducted for this      (Steinitz 2012).
area which is known as “Malabar headlands”. Participant
profiles and the process of the experiment are explained in this     Each of the abovementioned iterations is based on a loop
section. Third, results of the online questionnaire are described.   diagram followed by six new questions, concepts, and graphs.
Fourth, a discussion of the findings is presented. We propose as     Representation model helps geodesign study to identify the
to where in the geodesign framework AR sandbox integration           minimum required and relevant data. It also considers how
can be useful and supportive. The capabilities and limitations of    change will be visualized. Understanding the processes that are
the AR sandbox resulted from the trail planning experiment are       involved in geographic change helps to identify the required
explained in this section. Finally, conclusions and                  data for a geodesign study. Process model can range from direct
recommended future research directions are outlined.                 process models, to more complex such as temporal (“what if?”),
                                                                     adaptive (“from what to what?”) and behavioural (“from
                2. LITERATURE REVIEW                                 whom/where to whom/where?”) (Steinitz 2012). Geodesign
                                                                     heavily relies on evaluation maps (Steinitz 2012). The concept
The geodesign framework is described in this section and later       of evaluation models is derived from decision models and will
in the paper (in Sections 4 and 5) is compared with the results      directly influence the change model because the design needs to
of the experiment to develop the conceptual framework of this        focus on the areas that need change or need to be conserved.
paper. In addition, AR sandbox and its applications in similar       Evaluation models can evaluate the characteristics of the
projects are reviewed.                                               environment qualitatively. One key challenge of the change
                                                                     model is to get from present to the best possible future. Change
2.1 Geodesign                                                        has four phases including vision, strategy, tactics, and actions
                                                                     (Steinitz 2012). Impact model assesses the benefits and costs of
In 2015, the “Steinitz framework” was transformed into its           the changes quantitatively. Impact models have to be assessed
digital representation through a software that enables a digital     in different ways usually with a set of models such as
design workflow and it was tested in several workshops.              economics and environmental impact assessments. Finally,
(Rivero et al. 2015; Ballal 2015; Nyerges et al. 2016).              decision model is where decisions are made based on the
Geodesignhub (Ballal n.d.) is a software platform where most of      cultural, personal, and institutional knowledge of the decision
this analytical thinking and collaboration approach takes place.     makers.
Geodesignhub is a cloud-based collaboration platform which
has been designed for carrying out projects to address decision      The evaluation and change models are the two models that the
making in the context of complex geo-strategy problems. The          research team assume AR sandbox can play an important role
software has been used to manage sites in diverse contexts:          for participants to understand their designs. This will be
marine management, tourism development and so on. In this            examined further in this paper.
case it was used in the context of urban design. It is often used
in the form of an interactive hands-on workshop meeting (Pettit      2.2 Augmented Reality Sandbox
et al. 2017).
                                                                     The AR sandbox was first developed by UC Davis, California
What makes geodesign with geodesignhub unique is the process         as a result of a NSF-funded project with the aim of teaching
of creation of a collaborative design using the Steinitz             earth science concepts (UC Davis 2016). It displays a dynamic
framework (Steinitz 2012). The workflow guides the                   topographic map which composes of a box containing real sand,
participants through a series of steps to facilitate negotiations    a projector, and a Microsoft Kinect 3D camera which can be
using software support to compare the interventions.                 connected to a computer system.
Geodesignhub embodies the systems-based approach to design
where the design problem is broken down in to constituent            The sand is overlain by the digital projection of the contour
systems or themes. The participants initially design exclusively     lines and colour elevation map. Data can be send through the
in different “systems” such as high-density housing, low density     Microsoft Kinect 3D camera into either Ubuntu (system 76
housing, active transport, tourism, and so on, then synthesizes      2018; UC Davis 2016) or GrassGIS (NCSU GeoForAll Lab
the designs. Afterwards, they negotiate and come up with one or      2016) and into a software program that displays the information

         This contribution has been peer-reviewed. The double-blind peer-review was conducted on the basis of the full paper.
                         https://doi.org/10.5194/isprs-annals-IV-4-5-2018 | © Authors 2018. CC BY 4.0 License.                      6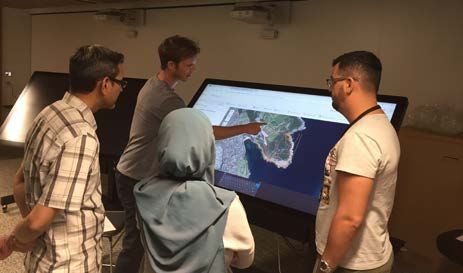
ISPRS Annals of the Photogrammetry, Remote Sensing and Spatial Information Sciences, Volume IV-4, 2018
ISPRS TC IV Mid-term Symposium “3D Spatial Information Science – The Engine of Change”, 1–5 October 2018, Delft, The Netherlands

onto the sand through the projector. The user can manipulate
the sand and simultaneously observe the real time changes of
the elevation map and the contour lines projected onto the sand.
In other words, the user shapes the real sand which is then
augmented in real time by contour lines, elevation colour maps,
and simulated water. By holding the hands under the Kinect 3D
camera, the user can add virtual water to the surface of the sand
flowing over the real surface of the sand with real-time water
simulation (Kreylos et al. 2016).

More than 150 laboratories all around the world are installing
and using AR sandbox in various fields in both education and
practice (Kreylos et al. 2016). AR sandbox can teach many
geographic concepts to users such as reading and interpreting
contour lines and topographic maps, flooding and formation of
watershed and can also be used in field trip preparation and trail
planning (Kreylos et al. 2016).

In a trail planning and sandbox study, Petrasova et al. (2015)
utilized tangible landscape (NCSU GeoForAll Lab 2016) to
calculate the optimized route between some way points. They
computed the least cost route between a selected numbers of
waypoints considered a specific slope value, construction cost,         Figure 1. Study area of the geodesign workshop, Sydney
aesthetics and view using network analysis, GrassGIS (GRASS
                                                                      December 2016; The case study of the sandbox experiment is
GIS 2018). Similar to Petrasova et al. (2015), in the design of
this study, slope degree has been calculated and some selection                        displayed in circle (in red)
criteria for waypoints have been considered in selecting the case    Participants were using the Geodesignhub (Ballal n.d.) to draw
study such as aesthetic and environmental variables.                 diagrams (i.e. simple polygons illustrating the location of the
                                                                     project or policy) representing the proposed projects and
                        3. METHODS                                   policies which were agreed between team members (Figure 2).
                                                                     They were briefed on how to log in and use this online platform
This section describes the Botany Bay Geodesign workshop             and each team was equipped with one person with geodesign
followed by the design of the AR sandbox experiment. The             experience.
progress and purpose of the workshop have been published in
(Pettit et al 2017). This section summarises the output of the
workshop that are required for the current paper.

3.1 Botany Bay geodesign workshop

The workshop was held from 1st to 2nd December 2016 at
Sydney, Australia. A public lecture was given by Prof. Carl
Steinitz on the 30th November 2016 as a briefing for the
geodesign workshop. It included an overview of geodesign
framework with several examples from previous workshops. A
number of 30 professionals were participated the workshop.
Participants had various professional backgrounds from
different governmental and private sectors: local councils                Figure 2. An example of the projects and policies that
including Randwick City Council, City of Botany Bay Council,               participants have created during the workshop using
and Waverley Council, the greater Sydney Commission, Sydney                             geodesignhub (Ballal n.d.)
Water, Land and housing corporation, Transport for New South         The workshop was run in two phases: a) scoping, data
Wales, department of planning NSW, Urban Growth, University          collection, and analysis; at this stage data was collected from
of New South wales, and University of Canberra, and private          relevant organization, and was assessed with the consultation of
companies such as Ernst and Young (EY) and Arup.                     the participated organizations; and b) implementation;
Participants were briefed of the case study (Figure 1), objectives   participants were involved at this stage (Pettit et al. 2017). As
of the workshop and the Sydney 2050 projections.                     the result of phase 1, nine systems were identified including:
                                                                     medium density housing, high-density housing, commerce and
Geodesignhub provides critical functionalities to enable             industry, public transport, active transport, green infrastructure,
collaborative design and negotiations. The participants have to      blue infrastructure, education, and tourism. Participants were
go through three primary processes (all done together in             first divided into nine groups each focusing on one system.
public):                                                             They were then divided into six multidisciplinary teams for
          - Review existing conditions and draw ideas for            working on specific development scenarios. After evaluating
          improving it using simple diagrams                         their design concepts (i.e. scenario design), participants were
          - Get grouped in different teams where they pick           presented their work and after negotiations across teams, they
          specific diagrams they prefer                              came up with the final version of the scenario design (see Pettit
          - Compare contrast the selections form alliances and       et al. 2017).
          negotiate.

         This contribution has been peer-reviewed. The double-blind peer-review was conducted on the basis of the full paper.
                         https://doi.org/10.5194/isprs-annals-IV-4-5-2018 | © Authors 2018. CC BY 4.0 License.                        7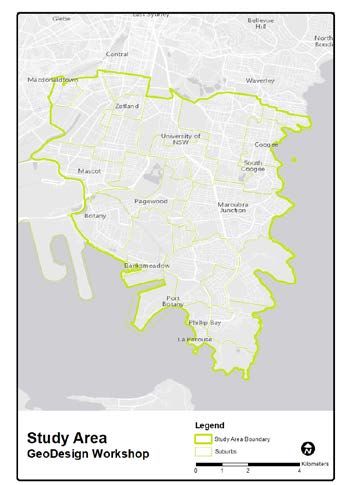
ISPRS Annals of the Photogrammetry, Remote Sensing and Spatial Information Sciences, Volume IV-4, 2018
ISPRS TC IV Mid-term Symposium “3D Spatial Information Science – The Engine of Change”, 1–5 October 2018, Delft, The Netherlands

Due to the limitations of assessing the entire workshop, only
two systems of tourism and active transport were selected from
this workshop to be further examined with AR sandbox as a
trial in this paper.

3.2 Augmented Reality Sandbox experiment

3.2.1 Case study: The case study was selected from the
geodesign workshop as a site with different steep and evaluation
with potential opportunities for future tourism and active
transport system. The site was intentionally selected closer to
the coastal area for this paper to allow participants study the
erosion and other environmental sensitivity factors such as
flooding. This site is located at Sydney’s east between Malabar
and Maroubra beaches. There exist scenic coastal walkways in                     Figure 5. Participants using the sandbox
the Sydney’s east. Malabar coastal walkway has been recently
                                                                     AR sandbox was comprised of a box filled with kinetic sands,
opened to public. It is also known as Malabar headland national
                                                                     3D scanner (Microsoft Kinect 3D camera Xbox360), a projector
parks. The elevation and contour lines of the case study are
                                                                     (Optoma ML 750 LED 700 Lumens), and a laptop (System 76,
shown in Figure 3.
                                                                     Ubuntu Linux). Kinetic sands were used for its adhesiveness
                                                                     and moldability to sculpt models. 3D scanner captures changes
                                                                     from distance to the sand surface. Using Ubuntu system, we
              25                                 0                   processed data using the commands originally developed by
                                                                     Oliver Kreylos (Kreylos 2018a) of the University of California
                                                                     – Davis open-source software available at (system 76 2018).
            20                  40                                   The software also project water flow simulation by holding the
                 15                  45
                                                                     hands under the 3D scanner or by assigning a keyboard to the
                        30 35                                        water flow simulation. For the purpose of this experiment,
                  10
                                                                     GrassGIS (GRASS GIS 2018) was also used to project the
                                                                     contour lines as well as the evaluation map of the tourism
                                                                     system resulted from the geodesign workshop onto the sands.

                                                                     Phase 1 was named scenario design (Figure 6). Participants
                                                                     were briefed on geodesign process and were given the
  Figure 3. Hillshade illustration of the case study for the AR      evaluation map of the site which was resulted from the
    sandbox experiment. Contour line values are displayed.           geodesign workshop (Figure 7). Evaluation map or site
                                                                     assessment maps are simple red/yellow/green maps that inform
3.2.2 Participants: Four participants voluntarily attended           participants where they can build and where they should be
this experiment. The corresponding author disseminated the           careful (Ballal 2017).
recruitment email to the faculty of built environment HDR
students. Four PhD students were recruited for this experiment
based on their available time, experience, knowledge, and
willingness to participate. Two participants were at each group
of tourism and active transport. Participants were PhD students
at the faculty of Built Environment, UNSW Sydney Australia
with professional expertise in either of the following fields of
study including: urban planning, urban design, architecture,
and/or landscape architecture (age range 35-44).

3.2.3 Process: The AR sandbox experiment included 2
phases: Scenario design and Sandbox (Figure 4). The                     Figure 6. The AR sandbox experiment (Phase 1- scenario
experiment took place at the City Analytics Lab (CAL), UNSW                                    design)
(UNSW Built Environment 2018) in April 2018. Multi-touch
screen cruiser tables were used for the phase 1 of the
experiment and the Augmented reality (AR) sandbox was
utilized to facilitate the design of the phase 2 (Figure 5).

                                                                        Figure 7. The evaluation map of the active transport system
                                                                          Source: (Ballal n.d.) geodesign workshop Sydney 2016.
       Figure 4. The AR sandbox geodesign experiment                   *More details on evaluation map are provided in (Pettit et al.
                                                                                                   2017)

         This contribution has been peer-reviewed. The double-blind peer-review was conducted on the basis of the full paper.
                         https://doi.org/10.5194/isprs-annals-IV-4-5-2018 | © Authors 2018. CC BY 4.0 License.                          8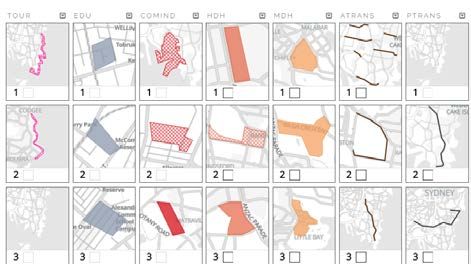
ISPRS Annals of the Photogrammetry, Remote Sensing and Spatial Information Sciences, Volume IV-4, 2018
ISPRS TC IV Mid-term Symposium “3D Spatial Information Science – The Engine of Change”, 1–5 October 2018, Delft, The Netherlands
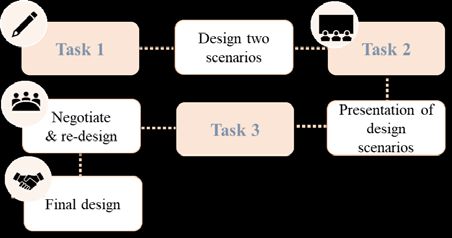
They were divided into two teams of active transport and
tourism; each team focused on the topics related to the theme.
They were given some time to discuss, design, and negotiate
among themselves about the location of trails in relation to the
terrain, slope, scenic views, etc. to come up with one/two design
ideas of trails for the tourism and active transport systems (Task
1). They were given the existing trail and the contour lines of
the site. ArcGIS online was used at this stage and they were
using the cruiser interactive tables (Cruiser Interactive 2018) for
this exercise. They were then presented their scenario design to
the other team (Task 2). After negotiations with the other team
they ended up with a final trail design (Task 3- Figure 8). The
scenario design from phase 1 was downloaded as a shapefile
and then was exported into GrassGIS (GRASS GIS 2018) as an
input for phase 2.
Figure 9. The AR sandbox experiment (Phase 2 – Sandbox)
Figure 8. Phase1, task 3: Participants were negotiating and
using the multitouch screen tables available at CAL (UNSW
Built Environment 2018)
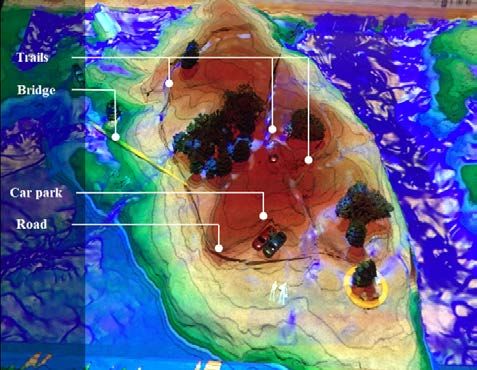
In phase 2, sandbox, participants were asked to build a model of
the final scenario design from phase 1 onto the sandbox surface
(a) (b)
displaying the trails of the current terrain. Using their hands
Figure 10. a) task 2, participants are building the topographic
forming their design on the sand, participants were engaged and
site; b) task 3, participants are transferring their trail design onto
interacted with each other during this experiment. The
the sandbox
experiment included six tasks (Figure 9). Prior to running the
experiment, participants were first briefed with the basic
In the fourth task the first constraint was introduced (Figure
geographic science. They were introduced contour lines and
11a). Participants were first asked to predict that on which
topographic and elevation maps; for example, closer contour
landform the erosion will be stronger. Although they did not
lines represent steep slope and the wider contour lines are
have access to all the information related to erosion such as soil
spaced from each other, the gentler is the slope. The first task
type, and vegetation type, they were briefed that the steeper the
was think aloud and explore the concept of elevation (National
slope, the stronger erosion and deposition can occur because of
Science Foundation n.d.). They were asked to get familiar with
the speed of water which can carry more stuff in a higher speed
the colour changes of the elevation map as they modify the sand
(National Science Foundation n.d.). Then they were asked to
surface.
design on a slope less than 5 degree (Figure 11b). Slope tool
(Spatial Analyst) was used to create a slope raster file of the
For the second task, participants were given the topographic
case study and was projected onto the sandbox for this task.
data and contour lines to build the site (Figure 10a). Digital
They were given some time to negotiate and come up with the
Elevation Model (DEM) 5 meter Grid of Australia was
best design option, which in this exercise is the design with the
downloaded from ELVIS (Australian Government (GeoScience
lowest impact on erosion on the slope less than 5 degrees.
Australia) 2018) for extracting the contour lines of the selected
study area. Contour lines were extracted from DEM using
Spatial Analyst (ESRI 2017) and were then projected onto the
sandbox for participants to build the topographic site. Third task
was to build and transfer the design from phase 1 onto the
surface of the sand. The scenario design from phase 1, which
has been already imported into GrassGIS was displayed on the
sandbox for participants to build it (Figure 10b). Participants
were given some tools and scaled models such as trees, 3D
printed buildings and people to use in their design. Although it Figure 11. a) task 4, slope map; b) task 4, slope map restricted
was a trail design, they decided to give access to cars to reach to 0-5 degrees
the Malabar headlands for disabled users. Car park and the road
are displayed on Figure 12. The fifth task was to test flooding. The second constraint was
introduced in this task. Virtual water was added to the map and
This contribution has been peer-reviewed. The double-blind peer-review was conducted on the basis of the full paper.
https://doi.org/10.5194/isprs-annals-IV-4-5-2018 | © Authors 2018. CC BY 4.0 License. 9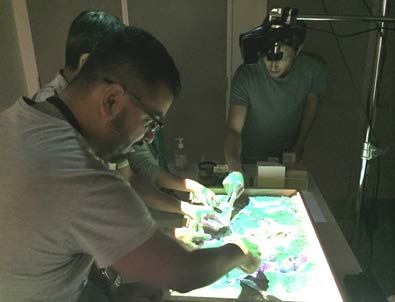
ISPRS Annals of the Photogrammetry, Remote Sensing and Spatial Information Sciences, Volume IV-4, 2018
ISPRS TC IV Mid-term Symposium “3D Spatial Information Science – The Engine of Change”, 1–5 October 2018, Delft, The Netherlands

they were asked to observe where water flows and do any              “sandbox usability”. Six questions were designed for this
required changes to reduce potential flooding-related issues         section to query the usability of the sandbox. The rest of the
(Figure 12). At this stage, the participants added a bridge to the   sections were “decision-making”, “prioritizing design
design in order to avoid flooding. This is represented by a          interventions”, and “negotiation”, respectively. At each of these
yellow line in Figure 12. They used the terrain to identify the      sections participants were asked three questions in accordance
location of the bridge which might not be possible with 2D           with the abovementioned sections.
maps.
                                                                     4.1.1 Sandbox usability: Sandbox usability questions
                                                                     revealed the benefits and limitations of utilising this tool.
                                                                     Participants were all able to recreate the terrain easily on the
                                                                     sandbox (%100). They all rated the use of sandbox as
                                                                     “somewhat easy” for trail planning (%100). In addition,
                                                                     participants ranked their preference in drawing design concepts.
                                                                     The first preference was designing on paper (66.6%), second
                                                                     preference was using digital maps (66.6%). The AR sandbox
                                                                     was ranked equally for the three preferences (33.3% for first,
                                                                     second, and third priority). Respondents were “extremely
                                                                     satisfied” to utilize the AR sandbox in the design stage. They
                                                                     found that the AR sandbox was running very quickly and was
                                                                     very practical for understanding the design. Selections of
                                                                     respondents’ comments are presented below:

                                                                                  Respondent 1. Users can “quickly see
                                                                                  potential conflicts between ideas and
                                                                                       landform and drainage”’.
   Figure 12. Task 5, virtual water was displayed on the site

Task 6 introduced a constraint of cost. They were given a                        Respondents 4. “Interactivity and quick
certain budget for this task and were only allowed to build 5km                   visualisation of changes” is the main
of the trail (Figure13a). Scale bar was added to the map for this                 benefit of using the AR sandbox in the
task to measure the trail. Participants were given some time to                               design process.
negotiate and come up with the final design (Figure 13b).
However, they did not change the design at this stage because        While participants rated AR sandbox as a useful tool, they
the cost was already in limits. This shows that there needs to be    mentioned some limitations and difficulties in using the AR
a more aggressive cost in the future experiment, so they will be     sandbox such as the scale of the trails which required to be
forced to change the trail. At the end of the experiment,            adjusted with the scale of the terrain. Although this stage was
participants received a link to the online questionnaire to fill.    done using GrassGIS, because it took some time participants
                                                                     mentioned it as one of the limitations of the AR sandbox.
                                                                     Participants were also concerned about the accuracy of the
                                                                     model which was moulded on the AR sandbox in terms of
                                                                     elevation.

                                                                     4.1.2 Decision making: All the four participants responded
                                                                     positively to the question asking if AR sandbox helped them
                                                                     understand the design (%100). Responses revealed that the AR
                                                                     sandbox was “extremely useful” (%75) and “very useful” (%25)
                                                                     when making decisions during the design process. Participants
             (a)                                   (b)               were also asked to mention what other data or information they
Figure 13. a) task 6; b) Final design                                needed to make decisions about trail design and where to put
                                                                     the trail. Respondents included local ecology, water-related
                         4. RESULTS                                  data, budget, existing facilities and contours, site context, user
                                                                     desires, and environmental constraints.
This section describes the results of the online questionnaire.
We are not interested in assessing the final design in terms of      4.1.3 Prioritising design interventions: All participants
landscape architecture and/or urban planning. The questionnaire      were able to prioritise different design interventions and ideas
provides information about the usability of the AR sandbox and       using the sandbox (%100). They were “extremely satisfied”
its performance in terms of decision-making, prioritizing design     (%75) and “very satisfied” (%25) in utilizing the AR sandbox in
interventions, and negotiations among team members for the           prioritising design ideas during the experiment. Participants
trail planning task in this paper.                                   commented that the AR sandbox helped them to understand the
                                                                     site better, visualise vantage points, address some issues such as
4.1 Online questionnaire                                             drainage problems, and allow them to quickly negotiate and re-
                                                                     design.
An online questionnaire was designed with a total number of 17
questions for this experiment. The questionnaire composed of
five sections. The first section included general questions
regarding age range and the professional background and the
field of study of the participants. The second section was named

         This contribution has been peer-reviewed. The double-blind peer-review was conducted on the basis of the full paper.
                         https://doi.org/10.5194/isprs-annals-IV-4-5-2018 | © Authors 2018. CC BY 4.0 License.                      10
ISPRS Annals of the Photogrammetry, Remote Sensing and Spatial Information Sciences, Volume IV-4, 2018
ISPRS TC IV Mid-term Symposium “3D Spatial Information Science – The Engine of Change”, 1–5 October 2018, Delft, The Netherlands

4.1.4 Negotiation: All participants were able to negotiate            It was found that AR sandbox is a great tool for the
their ideas among their peers using the AR sandbox (%100) and         visualisation of data, particularly topographic, landscape, and
were all “extremely satisfied” (%100) with using the AR               watershed-related data. Therefore, it could help the
sandbox in providing a negotiation space between team                 representation model and the process model of geodesign
members. In responding to the question regarding how the AR           structure in order to better understand the study area. It can also
sandbox helped them to negotiate with their team members,             help the change model by displaying the changes of the design
they mentioned that the AR sandbox “encouraged discussion”            on the sandbox and examining the effect of the change on the
(Respondent 1), “allow practical changes in short time”               context. Although the user can partially envisage impacts of the
(Respondent 2), enabled everyone to “touch the sandbox at the         design, the AR sandbox cannot be a reliable tool for assessing
same time” (Respondent 3), and allow them to “quick[ly] try           impact models because of lack of simultaneous analyses of the
[different] ideas and visualise results” (Respondent 4).              site. However, it can be used for decision models where the
                                                                      final decision need to be made. This assertion need to be further
                        5. DISCUSSION                                 examined in a geodesign workshop using the AR sandbox.

The results of the questionnaire and the experiment itself                     6. CONCLUSION AND FUTURE WORK
suggested the usability of the AR sandbox in trail planning. The
results revealed what type of data is required for such an            This paper describes a trail planning exercise, which is based on
experiment in a larger scale. The capabilities and limitations of     Steinitz (2012) geodesign framework. An AR sandbox is used
the AR sandbox resulted from this experiment are summarized           in this paper in order to assess its implications in the geodesign
in Table 1. The main demerits in the trail planning experiment        workflow for the first time. Two systems of active transport and
were the export functionality of the AR sandbox and matching          tourism were selected from a geodesign workshop which was
the scale of the final design of phase 1 onto the sandbox for         held in Sydney Australia in 2016. A smaller scale site was
casting. These factors limited the authors to export the final        selected from the previous geodesign case study boundary. An
design into GIS environment for further analysis. If the export       experiment was conducted at two phases of scenario design and
function is added to the AR sandbox, users could assess how           sandbox with four participants. The outcome of phase 1 was a
close is the moulded design to the existing Digital Elevation         trail with specific focus on active transport and tourism. This
Models (DEM) to address the accuracy issue. In addition, the          design intervention was then moulded onto the sandbox and
calibration of the AR sandbox, is a time-consuming process.           three constraints of slope, flooding, and cost were introduced to
One solution for this is to set up the 3D scanner and the             participants. They modified the design intervention in
projector on the fixed customized table attached to the sandbox       accordance with the constraints mentioned above. Lastly, the
which seems to be already utilised at some centres such as UC         final design was displayed on the sandbox (Figure 12b).
Davis (Kreylos 2018b).
                                                                      In its current form, the AR sandbox managed to successfully
On the other hand, the AR sandbox was found to have many              create both an educational learning environment and design
merits in support of collaborative planning, decision-making,         environment by offering the necessary tools for visualisation,
communication and participant engagement. It is most effective        communication, decision making, and interaction between the
when the AR sandbox is being used to understand the                   team members, as well as prerequisites for the simulation of the
topography of the case study with considerable differences in         site. However, the AR sandbox has the potential to be enriched
elevation rather than being used on a flat site.                      with some features and tools such as export, and scale
                                                                      functionalities. These additional features could assist in the
In addition, the authors believe that the AR sandbox                  design conceptualisation as part of a geodesign workshop.
experiments can help improving different models of the                Currently, the export function is limited to scan the sandbox
geodesign structure including: representation, process, change,       model using complex python scripts in the GrassGIS
and decision models. Table 1 shows the capabilities and               environment (GRASS GIS 2018). Therefore, the export
limitations of the AR sandbox resulting from the trail planning       function would be useful in order to provide flexibility for
experiment.                                                           further analyses on the exported model in a GIS environment.
                      AR sandbox characteristics                      Furthermore, the scale of the design was difficulty matched with
      Factors supporting trail planning        Factors restricting    the sandbox. Additional import extension formats to GrassGIS
                                                  trail planning      compatible with other GIS software could address this issue
  -Effective technique for moulding and       -Exporting the design   such as the GeoJSON format. The incorporation of these
  casting models                                                      suggestions will lead to a more comprehensive, AR sandbox
  -Collaborative decision-making capability -Scale-related issues
                                                                      tool which can support both educational and practical
  -User interaction and experience            -Topographic-related
                                              accuracy of the         applications. Results also show that geodesignhub and AR
                                              moulded design          sandbox can act as Planning Support (PSS) tools by facilitating
  -Quick and simultaneous demonstration of -Time-consuming            discussions around scenario planning and creating new design
  design changes on the sand                  calibration process     interventions around planning challenges (Pettit et al. 2018).
  -Detecting flood prone areas                                        However, this needs to be further examined in a more complex
  -Understanding topography                                           planning challenge.
  -Understanding slope
  -Cost-effective design
                                                                      We acknowledge the limitations of the AR sandbox experiment
  -Prioritizing design interventions
  -Better understanding the context
                                                                      in this paper. Because it was a trial experiment a limited number
  -Ability to project different GIS data onto                         of participants were recruited. This could trigger a response
  the sandbox                                                         bias. Moreover, the phase 1 of the experiment was not
 Table 1. factors supporting and restricting trail planning using     conducted during a geodesign workshop neither participants
                          AR sandbox                                  were interacting with the geodesignhub software. Therefore, we
                                                                      suggest running a full experiment during a live geodesign

         This contribution has been peer-reviewed. The double-blind peer-review was conducted on the basis of the full paper.
                         https://doi.org/10.5194/isprs-annals-IV-4-5-2018 | © Authors 2018. CC BY 4.0 License.                        11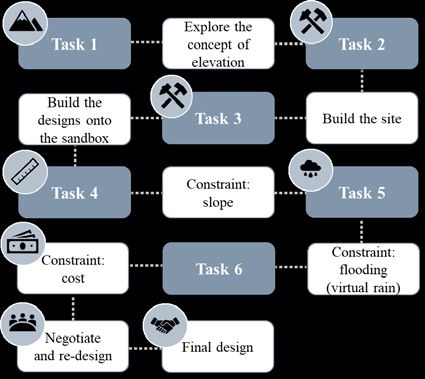
ISPRS Annals of the Photogrammetry, Remote Sensing and Spatial Information Sciences, Volume IV-4, 2018
ISPRS TC IV Mid-term Symposium “3D Spatial Information Science – The Engine of Change”, 1–5 October 2018, Delft, The Netherlands

workshop with a larger cohort of respondents, ideally exceeding      Liben, L.S., 2007. Education for Spatial Thinking. In William
30. It is also suggested that such an exercise should be             Damon, Richard M. Lerner (Eds.): Handbook of Child
accompanied by interviews or a focus grouped discussion. This        Psychology. Hoboken, NJ, USA: John Wiley & Sons, Inc.
will be pursued in future research. Finally, future work can
                                                                     McHarg, I.L., 1969. Design with nature: Garden City, NY:
compare AR sandbox with different AR and VR devices and
                                                                     Natural History Press.
their implications in PSS.
                                                                     Miller, W.R., 2012. Introducing Geodesign. The concept.
                 ACKNOWLEDGEMENTS                                    California, USA: ESRI.

We would like to acknowledge Oliver Kreylos for the open             National Science Foundation, n.d. Shaping Watersheds.
source AR sandbox scripts, and Carmela Ticzon for her support        Augmented       reality    Sandbox     Facilitator’s  Guide.
in providing the geodesign workshop materials.                       https://arsandbox.ucdavis.edu/wpcontent/uploads/2016/11/Shap
                                                                     ing-Watersheds-AR-Sandbox-Facilitation-Guide.pdf, (1 March
                     7. REFERENCES                                   2018).
                                                                     NCSU GeoForAll Lab, 2016. Tangible landscape.
Australian Government (GeoScience Australia), 2018. ELVIS.
                                                                     https://tangible-landscape.github.io/index.html, (1 March
Elevation Information System. http://www.ga.gov.au/elvis/.
                                                                     2018).
Ballal, H., n.d. Geodesign Hub. Dublin, Ireland: Geodesign
                                                                     Nyerges, T; Ballal, H; Steinitz, C; Canfield, T; Roderick, M;
Hub Pvt. Ltd. https://www.geodesignhub.com/, (28 February
                                                                     Ritzman, J; Thanatemaneerat, W., 2016. Geodesign dynamics
2018).
                                                                     for sustainable urban watershed development. In Sustainable
Ballal, H., 2015. Collaborative planning with digital design         Cities     and     Society     25,    pp.      13–24.     doi:
synthesis. Doctoral thesis. University College London, London.       10.1016/j.scs.2016.04.016.
http://discovery.ucl.ac.uk/1471177/1/HB-Thesis-Master.pdf, (7
                                                                     Petrasova, A.; Harmon, B.; Petras, V.; Mitasova, H., 2015.
March 2018).
                                                                     Tangible Modeling with Open Source GIS. Cham: Springer
Cruiser Interactive, 2018. Informing sharing reinvented.             International Publishing.
Australia. https://www.cruiserinteractive.com.au/, checked on
                                                                     Pettit, C.; Widjaja, I.; Russo, P.; Sinnott, R.; Stimson, R.;
(5 March 2018).
                                                                     Tomko, M., 2012. Visualisation support for exploring urban
ESRI, 2010. Changing geography by design. Selected readings          space and place. In ISPRS Ann. Photogramm. Remote Sens.
in GeoDesign. United States of America.                              Spatial Inf. Sci. I-2, pp. 153–158. doi: 10.5194/isprsannals-I-2-
                                                                     153-2012.
ESRI, 2017. ArcGIS Desktop 10.5. Redlands, CA.
                                                                     Pettit, C.; Bakelmun, A.; Lieske, S. N.; Glackin, S.; Hargroves,
GRASS GIS. Version 7.4.0, 2018. GRASS Development Team.
                                                                     K. C.; Thomson, G. et al., 2018. Planning support systems for
http://grass.osgeo.org/, (1 March 2018).
                                                                     smart cities. In City, Culture and Society 12, pp. 13–24.
Haddad, M. A., 2015. A Framework for Geodesign: Changing
                                                                     Pettit, C.J, Hawken, S, Ticzon, C., 2017. Sydney Geodesign
Geography by Design SteinitzCarl, 2012. Redlands, CA: ESRI
                                                                     Workshop 2016: Developing a framework for collaborative
Press. 208 pp. ISBN 978-1-58948-333-0. In Journal of
                                                                     multi-agency    scenario    planning,    UNSW,     Sydney.
Planning Education and Research 35 (2), pp. 228–230. doi:
                                                                     doi:10.4225/53/5a8dfd09de724.
10.1177/0739456X15581606.
                                                                     Rivero, R.; Smith, A.; Ballal, H.; Steinitz, C., 2015. Promoting
Jenkins, H.S.; Grant, R.; Hopkins, D., 2014. Shifting Sands and      Collaborative Geodesign in a Multidisciplinary and Multiscale
Turning Tides. Using 3D Visualization Technology to Shape            Environment. Coastal Georgia 2050, USA. In: Peer reviewed
the Environment for Undergraduate Students: American                 proceedings of Digital Landscape Architecture 2015 at Anhalt
Geophysical Union, 12.                                               University of Applied Sciences. Berlin: Wichmann, pp. 42–58.
Jiang, L.; Masullo, M.; Maffei, L.; Meng, F.; Vorländer, M.,         http://gispoint.de/fileadmin/user_upload/paper_gis_open/53755
2018. A demonstrator tool of web-based virtual reality for           5005.pdf, (7 March 2018).
participatory evaluation of urban sound environment. In              Steinitz, C., 2012. A framework for geodesign. Changing
Landscape and Urban Planning 170, pp. 276–282. doi:                  geography by design / Carl Steinitz. Redlands, Calf: ESRI.
10.1016/j.landurbplan.2017.09.007.
                                                                     System 76, 2018. Do it yourself. Augmented reality sandbox.
Kreylos, O., 2018a. AR Sandbox. http://idav.ucdavis.edu/             https://system76.com/weekend project/arsandbox, (26 February
~okreylos/ResDev/SARndbox/, (8 May 2018).                            2018).
Kreylos, O., 2018b. Augmented Reality Sandbox. News. The             UC Davis, 2016. 3D interactive dynamic. Powerful education
University                     of                   California.      tool. https://arsandbox.ucdavis.edu/, (1 March 2018).
https://arsandbox.ucdavis.edu/info/media/, (3 May 2018).
                                                                     UNSW Built Environment, 2018. City Analytics Lab (CAL).
Kreylos, O.; Kellogg, L. H.; Reed, S.; Hsi, S.; Yikilmaz, M. B.;     UNSW Sydney. https://www.be.unsw.edu.au/content/city-
Schladow, G. et al., 2016. The AR Sandbox. Augmented                 analytics-lab, (12 May 2018).
Reality in Geoscience Education. In American Geophysical
Union.
http://adsabs.harvard.edu/abs/2016AGUFMED51H0843K, (1
March 2018).

         This contribution has been peer-reviewed. The double-blind peer-review was conducted on the basis of the full paper.
                         https://doi.org/10.5194/isprs-annals-IV-4-5-2018 | © Authors 2018. CC BY 4.0 License.                     12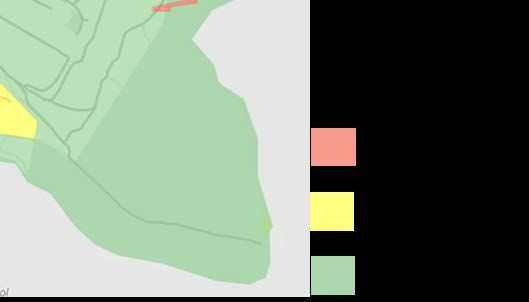
You can also read