THE EFFECTS OF THE SEAT CUSHION CONTOUR AND THE SITTING POSTURE ON SURFACE PRESSURE DISTRIBUTION AND COMFORT DURING SEATED WORK
←
→
Page content transcription
If your browser does not render page correctly, please read the page content below
ORIGINAL PAPER
                                                                   International Journal of Occupational Medicine and Environmental Health 2020;33(5):675 – 689
                                                                                                                      https://doi.org/10.13075/ijomeh.1896.01582

THE EFFECTS OF THE SEAT CUSHION CONTOUR
AND THE SITTING POSTURE
ON SURFACE PRESSURE DISTRIBUTION
AND COMFORT DURING SEATED WORK
WENHUA LI, RONG MO, SUIHUAI YU, JIANJIE CHU, YUKUN HU, and LONG WANG
Northwestern Polytechnical University, Xi’an, China
Department of Industrial Design

Abstract
Objectives: The purpose of this paper is to investigate the effects of the seat cushion contour and the sitting posture on the seat pan interface pres-
sure distribution and subjective comfort perception. Material and Methods: Overall, 16 volunteers typed a text passage on a laptop while seated,
by assuming 3 kinds of common sitting postures (forward, relaxed and upright) in 4 seat cushion configurations: chair only, and chair with 1 of 3
supplementary cushions. Pressure data and cushion comfort ratings were collected in the experiment. Results: It was found that the sitting posture
and the seat cushion contour had different impacts on surface pressure. The seat cushion contour had an impact on pressure parameters and pressure
distribution on the seat pan, while the sitting posture affected the location of peak pressure on the seat pan. The correlation analysis revealed that
the subjective comfort rating was significantly correlated with average pressure (AP) and mean peak pressure (MPP). Conclusions: The conclusion
was that the cushion contour had a greater effect on seat pan interface pressure parameters than the sitting posture. Notably, AP and MPP can be
indicators for assessing seat cushion comfort in a short-term perspective. Int J Occup Med Environ Health. 2020;33(5):675–89

Key words:
comfort, seat cushion, seat cushion contour, surface pressure distribution, office chair, pressure measurement

INTRODUCTION                                                                           both the workstation and chair design has constantly been
In a modern society, many occupations require work-                                    the ergonomists’ goal.
ers to use computers to do their jobs with workstations                                When taking standing as a neutral posture, the sitting pos-
in the office environment. The sitting posture becomes                                 ture is characterized by a posterior pelvic rotation posi-
the most common working posture in today’s workplace,                                  tion [2]. This position forces the lumbar spine to endure
and >75% of employees in industrial countries do their                                 more loading, which can over time lead to chronic back
jobs while seated [1]. It has been shown that the design of                            issues [3]. The optimal occupational sitting postures and
an office chair can strongly influence the sitting conditions                          sitting behaviors have been extensively discussed in litera-
for the user. The seat pan and backrest cushion properties                             ture. Both researchers and clinicians have carried out ex-
matter a lot for the sitting comfort. Therefore, optimizing                            tensive experimental research and clinical studies in recent
Funding: this research was supported by the Ministry of Industry and Information Technology (project No. MJ-2015-F-018 entitled “The special research on civil aircraft:
Key technology research on civil aircraft cabin design and comfort evaluation,” project manager: Bingchen Gou) and by Northwestern Polytechnical University (project
No. B13044 entitled “Project 111,” project manager: Suihuai Yu).
Received: December 12, 2019. Accepted: June 4, 2020.
Corresponding author: Wenhua Li, Northwestern Polytechnical University, Department of Industrial Design, Youyi Road (West) 127, 710072 Xi’an, China (e-mail:
iliwenhua@mail.nwpu.edu.cn).

                                                                                                                         Nofer Institute of Occupational Medicine, Łódź, Poland   675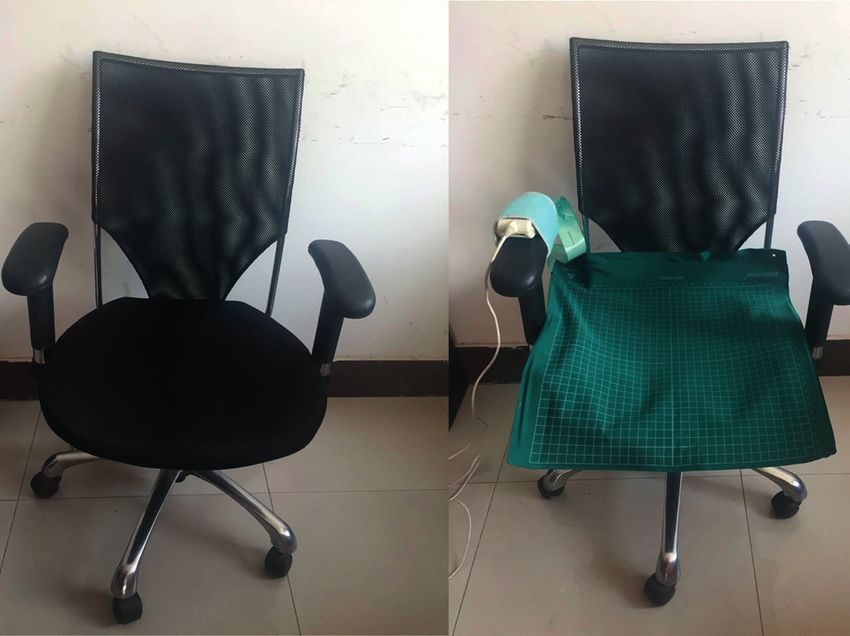
ORIGINAL PAPER                  W. LI ET AL.

      years. There exists a consensus that an incorrect sitting           there are several kinds of supplementary seat cushions on
      posture contributes to many disorders in the cervical and           the market, which were declared to be beneficial to relieve
      lumbar spine. However, there is no optimal sitting posture,         low back pain (LBP), and to reduce pressure on the coccyx,
      according to a review paper released by Pynt et al. [4].            tail bone and hip bones. From the product market perspec-
      The concept of “dynamic sitting” is gradually becoming              tive, with a large selection of consumer products in stores,
      a common method of preventing and relieving the mus-                there is a need to establish seat cushion design and selection
      culoskeletal disorders related to the sedentary lifestyle.          criteria based on relationships between comfort, pressure,
      Dynamic chairs are provided with certain swinging mech-             posture, and anthropometrics.
      anisms, and these systems allow for a greater variation in          Seat comfort has been investigated in the context of the char-
      the inclination angles of the seat [5]. The 2 most frequent-        acteristics of an office chair, an automobile seat, a mobile
      ly adopted sitting positions were the upright and forward           machinery seat, and an aircraft seat. Through the experi-
      inclined sitting positions during work in front of the com-         ment, it was concluded that chair design had the greatest
      puter. A video display terminal (VDT) guideline released            effect on the pressure distribution on the seat pan, followed
      by Waseda University in 1995 for operators using por-               by participant-specific effects and, finally, postural treat-
      table PCs reported that there are 3 common sitting pos-             ments (including different backrest angles and the use of
      tures – upright, bent forward and bent backward (reclin-            armrests) [16]. The seat pan and backrest cushion proper-
      ing). More recent research has found that >70% of VDT               ties play a decisive role in the chair-user interaction, includ-
      operators work with slouched shoulders without using                ing backrest inclination angles, seat pan inclination, supple-
      backrests. These 3 common sitting postures in the office            mentary backrest thickness, and cushion filling material.
      environment, i.e., the forward leaning posture, the up-             Research has found an almost 50% reduction in the mean
      right posture, as well as the reclined posture, have been           seat pressure on a wheelchair due to a different cushion
      studied [6,7]. Numerous researchers have voiced concerns            being used [17]. Among the chair characteristics related to
      about the effects of the sitting posture on the muscle activ-       seating and chair design, the cushion is a focal point. It is
      ity and spinal posture [8,9]. These studies have shown that         also known that the seat shape is important when selecting
      postural variables affect internal physiological conditions,        or designing a support surface for office chairs, wheelchairs
      subjective comfort ratings and productivity [10].                   or automobile seats. Tasker et al. [18] compared 2 kinds of
      Several studies have suggested that the shape and firmness          cushion shapes with a flat baseline surface and confirmed
      of the surface at the seat interface can affect the percep-         that custom-contoured shapes effectively reduced pressure
      tion of sitting comfort [11]. Most research studies focus on        ulcers. However, the effect of different levels of shape con-
      wheelchair users, like patients with spinal cord injuries, who      touring has not been adequately studied yet.
      cannot move their body freely and stay on the chair for a long      Some studies have proven that a good body pressure dis-
      time. The characteristics of different types of cushions have       tribution is related to comfort [19]. A well-designed chair
      been compared by various teams, including the filling mate-         should make body pressure distribution have a gradient
      rial [12,13], cushion thickness [14], and the recline angle [15].   from the ischial tuberosities which have the highest stress.
      However, to the best of the authors’ knowledge, there is still      A growing body of literature has investigated the effects
      a lack of knowledge concerning the optimal office seat cush-        of the sitting posture and chair design on the comfort and
      ion properties and geometry to contribute to pressure relief        physiological response during seated work. It remains un-
      on the buttock during extended sitting periods. Nowadays,           clear how the combined risks of the sitting posture and

676   IJOMEH 2020;33(5)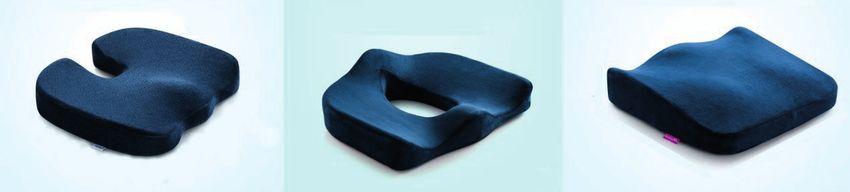
THE EFFECTS OF SEAT CUSHION CONTOUR AND SITTING POSTURE ORIGINAL PAPER
Table 1. Demographic data on the participants of the study conducted in the ergonomics lab at the Department of Industrial Design,
Northwestern Polytechnical University, Xi’an, China, June 6–11, 2018
Participants
(N = 16)
Variable males females
(N = 8) (N = 8)
M±SD min.–max M±SD min.–max
Age [years] 26±4.17 23–29 31±6.03 24–41
Body mass [kg] 78.5±11.17 66–94 53.50±6.68 45–65
Height [m] 1.77±0.05 1.70–1.85 1.61±4.60 1.53–1.68
Body mass index [kg/m2] 24.97±3.29 22.49–30.69 20.78±2.87 17.80–24.77
seat cushion contour might present over time, whether The hypotheses for this study were of a 2-fold nature.
they can aid in spinal unloading or form a good body pres- First, the authors hypothesized that the seat cushion con-
sure distribution. tour would influence the pressure distribution of the seat
The overall aim of the present study was to investigate pan surface. Second, they hypothesized that the body sur-
the influence of both the seat cushion contour and the sit- face pressure could be an effective indicator to differenti-
ting posture on body pressure distribution and the subjective ate seat cushions.
degree of comfort, and to find a better configuration among
the alternative contours for people working with a PC. MATERIAL AND METHODS
The main research questions to be answered in this study Subjects
are: Overall, 16 adult volunteers (8 males and 8 females) re-
– What is the effect of a seat cushion with a distinc- cruited from Northwestern Polytechnical University
tive contour, compared to a regular cushion, on pres- (NPU) participated in this experiment. All the subjects
sure parameters? Pressure parameters include aver- were asymptomatic, had not experienced any LBP in
age pressure (AP), mean peak pressure (MPP), mean the past 2 years, and had no previous spinal surgery. All
contact area (MCA) and maximum pressure gradient of them were computer-using workers and usually sat for
(MaxPG). nearly 8 h on their workdays. The subjects’ demographic
– Seat cushions with distinctive contours have a larger su- data are shown in Table 1. All the subjects signed written
perficial area than the common flat seat cushion. Does consent forms before participating in the study.
the seat cushion with a distinctive contour have a bigger
contact area than the regular cushion? Experimental design and protocol
– Does the seat cushion with a distinctive contour offer This study utilized a within-subjects design. The independent
a better comfort degree than the regular cushion? variables included the chair seat pan condition (no supple-
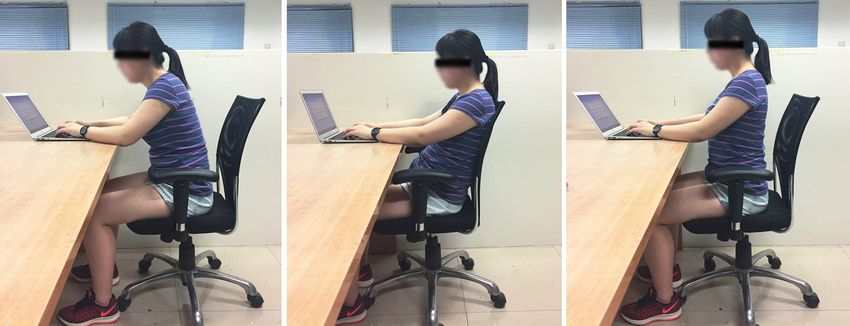
– What is the effect of sitting posture on pressure param- mentary cushion, supplementary seat cushion 1, 2 and 3)
eters? and 3 sitting postures (forward, relaxed, upright) (Figure 1).
– Is there a relationship between the subjective comfort The dependent variables were body pressure distribution
perception and pressure parameters? and the subjective comfort perception for the cushions. All
IJOMEH 2020;33(5) 677ORIGINAL PAPER W. LI ET AL.
a) b) c)
Figure 1. Three sitting postures: a) P1 – forward, b) P2 – relaxed, c) P3 – upright, used in the study conducted on 16 volunteers
in the ergonomics lab at the Department of Industrial Design, Northwestern Polytechnical University, Xi’an, China, June 6–11, 2018
the participants completed the same protocol (Figure 2). Measurements
The whole session consisted of 4 trials; every trial tested a seat Body pressure measurement system
pan condition. The first trial used the chair without a supple- Interface pressure data were recorded by Tekscan (South
mentary cushion (referred to as C0). The subsequent 3 trials Boston, MA, USA) (Figure 3). This system included
randomly chose 1 of the cushions as a seat pan condition (C1, a pressure sensors mat (5330 CONFORMatTM) and soft-
C2 and C3, respectively). During every trial, the participants ware; it was used to measure the pressure distribution
were required to sit, by assuming 3 sitting postures, to perform of different body regions. Each pressure mat consisted of
the typing task. There were 1-min breaks and 5-min breaks, 1024 (32×32) thin (1.78 mm) resistive sensors that could
respectively, between 2 sitting postures of 1 trial, and between easily conform to the contour of the seat and measure
2 trials. After 1 trial had finished, the subject was asked to fill up to 250 mm Hg (5 PSI). Each mat had the active area
in the seat cushion comfort rating questionnaire. of 471.4×471.4 mm, and the sensor pitch was 14.73 mm
Chair only Seat cushion 1 Seat cushion 2 Seat cushion 3
Pressure
collection
BREAK
BREAK
BREAK
P1 P2 P3 P1 P2 P3 P1 P2 P3 P1 P2 P3
Seat cushion
comfort ratings
BREAK BREAK BREAK BREAK
Seat cushion 1 Seat cushion 2 Seat cushion 3
comfort ratings comfort ratings comfort ratings
0 56 39 61 73
Time [min]
Figure 2. The collection protocol employed in the study conducted on 16 volunteers in the ergonomics lab
at the Department of Industrial Design, Northwestern Polytechnical University, Xi’an, China, June 6–11, 2018
678 IJOMEH 2020;33(5)THE EFFECTS OF SEAT CUSHION CONTOUR AND SITTING POSTURE ORIGINAL PAPER
(0.5 sensor/cm2). Pressure values were recorded at 1 Hz in
the software matched with the pressure mat. This sampling
rate was considered accurate enough, as the frequency of
postural changes and resultant pressure changes were not
observed to occur within an order of magnitude of the sam-
pling rate.
Workstation and seat cushion
The height of the workstation and the chair in this experi-
ment were adjustable. The chair used in the experiment
had a 5-point base, a hydraulic/pneumatic main support
cylinder, a flat seat pan, a backrest and a pair of armrests
Figure 3. The office chair used in the experiment, along with
(Figure 3). The authors collected seat cushion information
the pressure mat, in the study conducted on 16 volunteers in
online and searched through the purchasing records of e- the ergonomics lab at the Department of Industrial Design,
commerce platforms (Amazon, Alibaba), following which Northwestern Polytechnical University, Xi’an, China, Xi’an,
China, June 6–11, 2018
the top 3 seat cushions for office chairs were selected and
used in the study. Three supplementary seat cushions used of intermediate values. The participants were informed to
in this study had the distinctive contoured shapes, and rate the comfort of the seat cushion by making a cross on
were made of polyurethane foam with an outer layer of the line, with the comfort degree representing a compara-
cloth material (Figure 4). The dimensions of the 3 cush- tive value with the original chair without a supplementary
ions were roughly 46×40×6 cm3. cushion. The distance between the cross in the line with
the middle point can be converted to the corresponding
Subjective comfort ratings for cushions comfort value ranging –5–5. Using the example shown in
The seat cushion comfort degree was rated numerically at Figure 5, the red cross is located on the right, and the dis-
the end of every seat cushion condition using the visual tance is 3.5 cm, so the comfort degree is 3.5.
analog scale (Figure 5). This comfort rating method is
an objectification tool to convert human sensation into Experimental procedure
a quantifiable value. The seat cushion comfort rating is This experiment was conducted in the ergonomics lab at
an overall evaluation, with evaluation factors mainly re- the Department of Industrial Design on June 6–11, 2018.
ferring to the support of the cushion and skin pressure. Before commencing the experiment, the subjects were
As shown in Figure 5, in this experiment, the comfort given instructions on the experimental procedures and
rating of an office chair without a supplementary cushion the visual analog scale. They were asked to do as the exper-
was regarded as a benchmark and was denoted as “0.” imenter required. First, the subjects adjusted the worksta-
The length of the line was 10 cm, the left half was marked tion and the chair to the suitable height. The seat cushions
as “discomfort” and the right half was marked as “com- were covered with a white cloth during the experiment.
fort.” The left endpoint marked as “intolerable” stands A laptop was placed 10 cm from the edge of the worksta-
for –5 and the right endpoint, “considerable,” means 5. tion. After the calibration of the pressure mat on the seat
This scale is a bipolar continuum and allows the allocation pan was completed by the experimenter, the subjects were
IJOMEH 2020;33(5) 679ORIGINAL PAPER W. LI ET AL.
a) b) c)
Figure 4. Supplementary seat cushions used in the experiment: a) seat cushion 1, b) seat cushion 2, c) seat cushion 3, in the study
conducted on 16 volunteers in the ergonomics lab at the Department of Industrial Design, Northwestern Polytechnical University,
Xi’an, China, June 6–11, 2018
the subject filled out the cushion comfort questionnaire,
Discomfort Comfort being allowed to express any comments regarding each
cushion. If the subject was not sure about the relative com-
fort degree of the cushion, he/she was allowed to remove
Intolerable Much A little A little Much Considerable the supplementary cushion and sit on the original chair
again. A 5-min break was allowed before the second trial.
–5 –3 –1 0 1 3 3.5 5
The experimenter randomly chose 1 of 3 supplementary
Figure 5. A visual analog scale (the upper part) and a rating seat cushions and put it under the pressure mat on the seat
example in the study conducted on 16 volunteers in the
pan. The order in which the conditions were encountered
ergonomics lab at the Department of Industrial Design, North
western Polytechnical University, Xi’an, China, June 6–11, 2018 were randomized within a predetermined counterbal-
anced structure to control for potential order effects.
instructed to sit with 1 of 3 sitting postures on the chair, The subjects were encouraged to walk around to recover
and then they started to type the material at a comfort- before the next experimental trial. The same steps were
able pace. The typing task was performed using typing repeated to test all 3 supplementary seat cushions.
test software (Kingsoft Typing, Beijing, China), in which
the subjects typed the paragraphs shown in the screen. Data analysis
The pressure data started to collect data for 5 min. The ex- Firstly, the pressure parameters, including the average
perimenter should notice the sitting posture of the sub- pressure (AP), the mean peak pressure (MPP), the mean
ject, and inform him/her to be consistent with the required contact area (MCA) and the maximum pressure gradi-
posture. There was a 1-min break before moving on to ent (MaxPG), were compared for different cushions
the next sitting posture. The subjects were allowed to under different sitting postures. The MaxPG calcula-
move the buttock on the seat when changing their posture. tion method employed was derived from Douglas [20].
Before recording the pressure data, the subjects could The statistical analysis was performed with SPSS Statis-
move the chair forward or backward to a proper location tics 20.0 (Chicago, IL, USA). For all statistical tests, sig-
in order to better perform the typing task. nificance was set at p < 0.05. Data were tested for nor-
The order of the 3 sitting postures was randomized for mality using the Shapiro-Wilk test. A 2-way ANOVA was
each subject. After the sitting condition had finished, conducted initially. The 2 factors were the sitting posture
680 IJOMEH 2020;33(5)THE EFFECTS OF SEAT CUSHION CONTOUR AND SITTING POSTURE ORIGINAL PAPER
(forward, relaxed and upright) and the seat cushion con- eters included AP, MPP, MCA and MaxPG. Then, the ef-
dition (chair only, supplementary cushion 1, 2, and 3). fects of the seat cushion contour and the sitting posture on
If a significant F-test was found, post-hoc tests were con- these pressure parameters were analyzed, respectively.
ducted by pairwise comparisons. The Wilcoxon test was
used to compare the mean comfort rating of the 4 seat The effects of the seat cushion condition
cushion conditions. The correlation analysis was used and the sitting posture on seat pan pressure parameters
for the relationship between pressure parameters and Average pressure
the subjective comfort ratings. Typical female and male The AP analysis revealed significant main effects of
pressure mappings were illustrated for pressure distribu- the seat cushion condition (F = 18.43, p < 0.01) and
tion of the different cushions. the sitting posture (F = 3.99, p = 0.02). There was no
interaction effect between the seat cushion condition and
RESULTS the sitting posture on AP (p = 0.47). Notably, C3 and C2
Raw pressure data were exported in the format of ASCII, yielded the lowest and highest average pressure values
and a summary of pressure parameters under 4 seat cush- under every sitting posture, respectively (Figure 6a).
ion conditions was shown in Table 2. The pressure param- The average pressures of C0 and C1 were very close
Table 2. Pressure variables in the study conducted on 16 volunteers in the ergonomics lab at the Department of Industrial Design,
Northwestern Polytechnical University, Xi’an, China, June 6–11, 2018
Average pressure Mean peak pressure Mean contact area Max pressure gradient
Variable [mm Hg] [mm Hg] [cm2] [kPa/m]
(M±SE) (M±SE) (M±SE) (M±SE)
C0
forward 38.79±6.68 144.57±48.53 1106.24±165.72 87.42±39.21
relaxed 37.68±7.68 161.23±55.25 1089.07±218.75 71.20±31.32
upright 42.65±16.41 145.23±39.72 1106.56±171.45 72.42±15.04
C1
forward 39.39±8.48 112.90±35.31 1145.23±118.34 66.65±17.76
relaxed 35.54±6.93 106.80±27.58 1153.83±155.78 71.96±24.04
upright 40.50±7.27 119.57±39.08 1123.18±98.80 65.74±23.55
C2
forward 47.18±8.14 133.96±28.96 961.27±159.27 127.19±42.52
relaxed 41.77±7.84 133.37±28.38 978.30±144.50 112.88±32.18
upright 49.68±8.12 143.69±25.86 950.03±156.30 132.13±45.87
C3
forward 34.27±8.54 98.04±30.50 1172.75±130.53 58.47±20.83
relaxed 33.46±5.47 99.51±33.05 1125.86±207.27 54.30±22.50
upright 32.35±7.03 100.57±30.59 1172.58±110.74 53.35±19.34
C0 – original seat cushion; C1 – seat cushion 1; C2 – seat cushion 2; C3 – seat cushion 3.
IJOMEH 2020;33(5) 681ORIGINAL PAPER W. LI ET AL.
a) b)
Average pressure [mm Hg]
Mean peak pressure [mm Hg]
C0 C0
60 C1 200 C1
C2 C2
C3 C3
50
160
40
120
30
80
20
40
10
0 0
forward relaxed upright forward relaxed upright
Sitting posture Sitting posture
c) d)
200
Mean contact area [cm]
Maximum pressure gradient [kPa/m]
C0 C0
1400 C1 180 C1
C2 C2
C3 160 C3
1200 140
120
1000 100
80
800 60
40
600 20
0
forward relaxed upright forward relaxed upright
Sitting posture Sitting posture
C0 – original seat cushion; C1 – seat cushion 1; C2 – seat cushion 2; C3 – seat cushion 3.
Figure 6. The different sitting postures under 4 seat cushion conditions: a) average pressure, b) mean peak pressure, c) mean contact
area, d) maximum pressure gradient, in the study conducted on 16 volunteers in the ergonomics lab at the Department of Industrial
Design, Northwestern Polytechnical University, Xi’an, China, June 6–11, 2018
under every sitting posture. The average pressure of the Mean peak pressure
relaxed sitting posture was the lowest among the 3 sitting It was found that MPP was significantly affected by
postures under every cushion condition. In addition, post- the seat cushion condition (F = 1774.52, p < 0.01) while
hoc tests revealed that there was no significant difference there was no significant effect of the sitting posture on
(p = 1.00) in AP between C0 and C1, while significant MPP (p = 0.65). There was no interaction effect between
differences (p < 0.05) in AP were found between other the seat cushion condition and the sitting posture on MPP
pairwise seat cushion conditions. (p = 0.75). It was found that C3 had significantly lower
682 IJOMEH 2020;33(5)THE EFFECTS OF SEAT CUSHION CONTOUR AND SITTING POSTURE ORIGINAL PAPER
MPP compared to other conditions (Figure 6b). The re- were asked to rate the cushion comfort degree by taking
sults of post-hoc tests showed that there was no significant the original chair as the baseline for normal comfort.
difference between the sitting postures for MPP; howev- Via ANOVA, the data revealed that there was a signifi-
er, C0 yielded significantly larger MPP than C1 and C3 cant effect of the seat cushion condition on the subjec-
(p < 0.01, p < 0.01), and MPP of C2 also was significantly tive comfort rating (F = 14.345, p < 0.01). With regard
larger than those of C1 and C3 (p < 0.01, p < 0.01). to the ranking of the cushion comfort, C3 had the highest
subjective comfort rating (2.35), followed by C1 (1.65) and
Mean contact area C0 (0), while C2 showed the lowest level of comfort rating
The MCA values for 4 seat cushion conditions are shown (–0.55) (Figure 7). The Wilcoxon test displayed that C1
in Figure 6c and they were significantly affected by the seat was ranked significantly better than C0 (p < 0.01) and C2
cushion condition (F = 15.11, p < 0.01). No significant (p < 0.01), while C3 was ranked significantly higher than
effect of the sitting posture on MCA was found (p = 0.93). C0 (p < 0.01) and C2 (p < 0.01). No significant differ-
There was no seat cushion condition × sitting posture in- ence was found between C1 and C3 (p > 0.05). No effects
teraction effect on MCA (p = 0.96). The Tukey post-hoc of sex were found on the cushion comfort ratings for any of
multiple comparisons indicated that C2 had a significantly the 3 supplementary seat cushions (p > 0.05).
lower average MCA than C0 (p < 0.01), C1 (p < 0.01)
and C3 (p < 0.01). No significant difference in MCA was Interface pressure distribution
found between the sitting postures. for male and female subjects
The 2 typical (female and male) subjects’ surface pressure
Maximum pressure gradient mappings extracted from the seat pan pressure mats were
Figure 6d graphically portrays the results of MaxPG for displayed in Figure 8. The time of pressure distribution
each sitting posture under 4 different seat cushion condi- measurement was set at 20th s, when the state of the sitting
tions. It was shown that C2 and C0 had the highest and posture was already stable. Color bars showed the specific
lowest MaxPG values for the 3 sitting postures, respec- color corresponding to the pressure value. As can be seen,
tively. No statistically significant difference was revealed the seat pan had different shapes formed by the seat-body
in the sitting posture (F = 0.93, p = 0.39) and the seat contact pressure, and it proved that the seat cushion contour
cushion condition × sitting posture interaction effect (F = was in relation to interface pressures distribution. However,
0.84, p = 0.54). There were significant differences for the shape of the contact pressure mapping revealed no big
the 4 seat cushion conditions (F = 46.37, p < 0.01). More differences among 3 sitting postures with the same cushion.
specifically, post-hoc tests revealed that MaxPG of C2 In Figure 8, the coverage of high pressure values (red and
was significantly higher than that of other cushions (all orange) of C1, C2 and C3 significantly shrank for 2 subjects,
p < 0.01), and that there was a significant difference be- compared with C0. The supplementary cushion increased
tween C0 and C3 (p < 0.01). the thickness of the seat cushion; it suggested that a thicker
seat cushion might reduce the area of high pressure and
Subjective seat cushion condition comfort ratings even the peak pressure value.
The seat cushion comfort rating revealed people’s inte- The same situation happened in C1 and C3, but C3 had
grated subjective perception, and it did not take the sit- a smaller coverage of medium pressure (green color) in
ting posture into consideration in this study. The subjects the location of the buttock than C1. The possible reason may
IJOMEH 2020;33(5) 683ORIGINAL PAPER W. LI ET AL.
6 * be that the area of the 2 buttocks in C1 had a slightly bigger
Cushion comfort rating
C0
* * * C1
C2
thickness than the area of C3. There was a gap in the coc-
4 C3 cygeal vertebrae region on C1, which implies that there was
3.20
2.35
no contact pressure between the cushion and the coccygeal
2 2.15
1.65 1.75 vertebrae region. This cushion was beneficial to decrease
1.10
0.60 the pain of the coccygeal vertebrae region. The contour of
0
0 –0.55 C2 looks like human buttocks; there was an ellipse hole in
–1.15
the middle of the cushion, and it yielded the worst comfort
–2
rating. As shown in Figure 8 (C1–C3) for 2 subjects, the con-
centration of stress happened at the edge of C2.
–4
C0 C1 C2 C3
Seat cushion
Correlation analysis of pressure parameters
Abbreviations as in Figure 6. and subjective comfort ratings
* A significant difference between 2 cushion comfort ratings.
Pearson’s correlations were analyzed among the subjec-
Figure 7. A box plot of cushion comfort ratings in tive comfort ratings and pressure variables. Table 3 listed
the study conducted on 16 volunteers in the ergonomics
the results of the statistical analysis. There were statistical-
lab at the Department of Industrial Design, Northwestern
Polytechnical University, Xi’an, China, June 6–11, 2018 ly significant correlations between the seat cushion com-
a) b)
(a.1) (a.2) (a.3) (a.1) (a.2) (a.3)
(b.1) (b.2) (b.3) (b.1) (b.2) (b.3)
(c.1) (c.2) (c.3) (c.1) (c.2) (c.3)
(d.1) (d.2) (d.3) (d.1) (d.2) (d.3)
Abbreviations as in Figure 6.
Figure 8. An example of a) female and b) male pressure distributions of 3 sitting postures, under 4 seat cushion conditions,
in the study conducted on 16 volunteers in the ergonomics lab at the Department of Industrial Design, Northwestern Polytechnical
University, Xi’an, China, June 6–11, 2018
684 IJOMEH 2020;33(5)THE EFFECTS OF SEAT CUSHION CONTOUR AND SITTING POSTURE ORIGINAL PAPER
fort rating and AP, MPP and MCA, while no significant postures, perceived comfort during short-term sitting in
correlation was found between the seat cushion comfort office work.
rating and MaxPG (p > 0.05). More specifically, MCA
(correlation coefficient = 0.454) was positively correlated The effect of the seat cushion contour and sitting
with the subjective comfort rating, while MPP (correlation postures on pressure distribution
coefficient = –0.424) and AP (correlation coefficient = Three different supplementary seat cushion contours
–0.289) were significantly negatively correlated with formed 3 pressure mappings with the user on the seat.
the subjective comfort rating. Additionally, MaxPG was It was proven that the seat cushion contour had an effect
significantly correlated with AP (correlation coefficient = on pressure distribution. The feature of the hole in
0.405) and MPP (correlation coefficient = 0.595). the center of C2 is a bad design, as the concentration of
stress was found to occur at the edge of the hole on C2 for
DISCUSSION 2 subjects (Figure 8 [C1–C3]). The MaxPG values of C2
In this study, the authors analyzed how different seat were located at the edge of the hole. This could explain
cushions and sitting postures within a seated work envi- why C2 had the lowest comfort rating. The possible reason
ronment affected the seat pan surface pressure distribu- was that the contour of the seat cushion cannot conform
tion and comfort perception. Then, they investigated to the shape of the subject’ buttock, when he/she sat on
the correlation between seat cushion contours and sitting it [21]. Although the area in the center of the seat pan is
Table 3. A correlation analysis of pressure parameters and subjective comfort ratings in the study conducted on 16 volunteers
in the ergonomics lab at the Department of Industrial Design, Northwestern Polytechnical University, Xi’an, China, June 6–11, 2018
Correlation
Variable
1 2 3 4 5
1. Seat cushion comfort rating
Pearson’s correlation 1 –0.289* –0.424** 0.454** –0.173
p 0.047 0.003 0.001 0.240
2. Average pressure
Pearson’s correlation 1 0.386** –0.089 0.405**
p 0.007 0.547 0.004
3. Mean peak pressure
Pearson’s correlation 1 –0.767** 0.595**
p 0.000 0.000
4. Mean contact area
Pearson’s correlation 1 0.186
p 0.205
5. Max pressure gradient
Pearson’s correlation 1
p
* Significant (2-tailed) correlations at the level of 0.05; ** Significant (2-tailed) correlations at the level of 0.01.
IJOMEH 2020;33(5) 685ORIGINAL PAPER W. LI ET AL.
usually not contacted with the thigh, this part still bears the seat via the protuberances on the base of the pelvis,
the shear load from the adjacent area. the ischial tuberosities, and the peak pressure occurs in
There are some differences in the pelvic shape and size the place contacted with the ischial tuberosities of the but-
distributions, as well as differences in the size and shape tock. However, when an individual assumes a relaxed
of the ischial tuberosities. So, the seat cushion needs to sitting posture, the location of peak pressure shifts from
be ‘‘customized’’ and should consider the anthropomet- the ischial tuberosities to the sacrum coccyx at the rear of
ric data of individual users, which contribute to form- the ischia. No differences in MPP, MCA and MaxPG were
ing the appropriate contour [22]. Seat pan support to found between the sitting postures, which implies that
the pelvis should be provided under, behind, in front the sitting posture has no effect on the MPP, MCA and
of, or from the sides. Extra support can be provided by MaxPG. From the above discussion and from Figure 8, it
contours around the buttocks and thighs. For C1 or C3, can be concluded that the sitting posture had an impact on
the 2 peak pressure zones (red and orange colors) which the location of peak pressure.
were beneath the ischial tuberosities were dramati- Based on geometry and the observed differences of AP,
cally decreased, compared with C0 (Figure 8). Based MPP, MCA and MaxPG, it was found that the seat cushion
on a linear relationship between the applied force and contour influenced the pressure parameters of the seat pan.
the compression ratio, Diebschlag [23] recommended Therefore, seat cushion contour design appears to have
polyurethane foam for the upholstery and cushions . a great impact on seat pan interface pressure parameters.
The proper foam minimizes the concentration of pres-
sure beneath the tuberosities and achieves a more suit- The relationship between the subjective
able pressure distribution. cushion comfort rating and pressure parameters
A greater uniformity on pressure distribution and a lower The results of a bivariate correlation analysis demonstrated
peak pressure implied an improvement of the user’s com- that significant relationships exist between the subjective
fort on the seat [24]. From this perspective, C3 and C1 comfort rating and the objective surface pressure mea-
had better pressure distributions and comfort perceptions sures used in this study. The subjective comfort rating was
than C0 for the upright sitting posture as per Figure 8. significantly negatively correlated with AP and MPP. Pre-
The mean peak pressure of C1 and C3 was decreased vious studies [26,27] revealed a relationship between pres-
by 17.7% and 30.8% for the upright sitting posture, re- sure distribution and comfort/discomfort assessments. De
spectively (Table 2). A possible explanation for this find- Looze et al. [28], performing a literature review, showed that
ing is that a thicker support in the buttock region might there were several studies indicating that a good pressure
decrease the peak pressure on the seat pan. Red color distribution in the seat cushion was related to the comfort
(Figure 8 [a.3]) around the ischial bones changed into experience [28]. Noro et al. [29] found that comfort was re-
green color denoting lower pressure (Figure 8 [b.3] [d.3]). lated to low peak pressures and high contact areas of the seat
Ebe and Griffin [25] found that the subjects evaluated pan. Zemp et al. [30] reviewed the body of literature regard-
the static seat feeling based on the pressure around the is- ing the seat comfort determined through pressure measure-
chial bones, so cushions with higher pressures around this ments and concluded that the peak pressure on the seat pan,
area were evaluated as offering less comfort. the pressure distribution on the backrest and the pressure
When an individual is in the forward or upright sitting pos- pattern changes (seat pan and backrest) all appeared to be
ture, the gravity load of the upper body is transmitted to reliable measures for quantifying comfort or discomfort.
686 IJOMEH 2020;33(5)THE EFFECTS OF SEAT CUSHION CONTOUR AND SITTING POSTURE ORIGINAL PAPER
Although no significant correlation existed between MaxPG conclusion drawn from this study is that both the seat
and the comfort rating, C2 with the largest MaxPG had cushion contour and the sitting posture result in signifi-
the lowest the comfort rating. It can, therefore, be con- cant pressure distribution differences, while the seat cush-
cluded that MaxPG is an indicator to distinct bad pressure ion contour additionally results in changes in pressure
distribution. The correlations between pressure parameters parameters, and the sitting posture affects the location of
and comfort ratings provide further support for the relation- peak pressure.
ship between the seat cushion contour and comfort during In addition, pressure parameters, including AP and MPP
seated work. The location of peak pressure is a good indica- on the seat pan, were identified that were correlated with
tor to distinct pressure distribution. The findings obtained the subjective cushion comfort ratings. A statistically sig-
through this analysis further confirm and extend the findings nificant relationship between pressure parameters and
previously available in literature. comfort perception has been reported in a lot of exist-
ing studies. Therefore, pressure data are suggested as an
Limitation and future work appropriate indicator for assessing short-term comfort
It has to be acknowledged that there are some limitations of a seat cushion, reflecting seat support properties and
of the current study. This study involved a small sample the distribution of body load, which may appear useful in
of pain-free participants, without an a priori power cal- the indirect objective assessment of other types of seating
culation of the sample size, necessary to detect differ- surfaces with design differences.
ences between seat cushions. Furthermore, the duration Furthermore, considering body interface pressure distri-
of exposure was relatively short. Both the short dura- bution and pressure parameters, the supplementary cush-
tion and the small sample size reduce the likelihood of ion design is a good way to strengthen the user’s comfort
finding significant differences between the 4 seat cush- while seated. However, seat cushion contour design should
ion conditions. Notwithstanding its limitation, this study fit with the surface of an individual’s thigh and buttock.
does suggest some significant differences in seat cushion A bad seat cushion contour (e.g., C3) is likely to decrease
contours. Differences in the posture and comfort percep- the sitting comfort. It is concluded that the incorporation
tion may be even more pronounced during longer sitting of pressure measurements, besides the subjective com-
exposures in a larger sample of participants with LBP. fort ratings, in the process of seat cushion design, would
An analysis of more dynamic seated tasks is warranted. be valuable. Understanding the seat cushion contour
Future work should focus on verifying the relationship impact on comfort perception also provided implications
between specific features of cushion contours and pres- on the approaches to avoid the discomfort factor in seat
sure parameters. cushion contour design. Overall, this study contributed
to the research on the characteristics of surface pressure
CONCLUSIONS changes induced by seat cushion contours in short-term
This study provided new insights into the effects of seat seated work, which enhanced the knowledge on the seat
cushion contours on biomechanical variables as well as comfort theory.
the subject’s comfort perception in seated office work.
Seat cushions with distinctive contour lines do not always ACKNOWLEDGMENTS
have a larger contact area and more perceived sitting com- The authors would like to thank the participating individuals for
fort, compared with common flat seat cushions. The final their time and efforts.
IJOMEH 2020;33(5) 687ORIGINAL PAPER W. LI ET AL.
REFERENCES 10. Munoz F, Rougier PR. Estimation of centre of gravity move-
1. Lis AM, Black KM, Korn H, Nordin M. Association between ments in sitting posture: Application to trunk backward tilt.
sitting and occupational LBP. Eur Spine J. 2007;16(2):283–98, J Biomech. 2011;44(9):1771–5, https://doi.org/10.1016/j.jbio-
https://doi.org/10.1007/s00586-006-0143-7. mech.2011.04.008.
2. De Carvalho DE, Soave D, Ross K, Callaghan JP. Lumbar 11. Cascioli V, Liu Z, Heusch AI, McArthy PW. Settling down
Spine and Pelvic Posture Between Standing and Sitting: A Ra- time following initial sitting and its relationship with comfort
diologic Investigation Including Reliability and Repeatability and discomfort. J Tissue Viabilit. 2011;20(4):121–9, https://
of the Lumbar Lordosis Measure. J Manipulative Physiol Ther. doi.org/10.1016/j.jtv.2011.05.001.
2010;33(1):48–55, https://doi.org/10.1016/j.jmpt.2009.11.008. 12. Gil-Agudo A, De la Peña-González A, Del Ama-Espino-
3. O’Sullivan PB, Grahamslaw KM, Kendell M, Lapenskie SC, sa A, Pérez-Rizo E, Díaz-Domínguez E, Sánchez-Ramos A.
Möller NE, Richards KV. The effect of different standing and Comparative study of pressure distribution at the user-cush-
sitting postures on trunk muscle activity in a pain-free popula- ion interface with different cushions in a population with spi-
tion. Spine. 2002;27(11):1238–44, https://doi.org/10.1097/0000 nal cord injury. Clin Biomech. 2009;24:558–63, https://doi.
7632-200206010-00019. org/10.1016/j.clinbiomech.2009.04.006.
4. Pynt J, Higgs J, Mackey M. Seeking the optimal pos- 13. Sprigle S, Wootten M, Sawacha Z, Theilman G. Relation-
ture of the seated lumbar spine. Physiother Theory Pract. ships among cushion type, backrest height, seated posture,
2001;17(1):5–21, https://doi.org/10.1080/09593980151143228. and reach of wheelchair users with spinal cord injury. J Spi-
5. Ellegast RP, Kraft K, Groenesteijn L, Krause F, Berger H, nal Cord Med. 2003;26:236–43, https://doi.org/10.1080/1079
Vink P. Comparison of four specific dynamic office chairs with 0268.2003.11753690.
a conventional office chair: Impact upon muscle activation, 14. Ragan R, Kernozek TW, Bidar M, Matheson JW. Seat-
physical activity and posture. Appl Ergon. 2012;43:296–307, interface pressures on various thicknesses of foam wheel-
https://doi.org/10.1016/j.apergo.2011.06.005. chair cushions: A finite modeling approach. Arch Phys
6. Zemp R, Taylor WR, Lorenzetti S. Seat pan and backrest Med Rehabil. 2002;83:872–5, https://doi.org/10.1053/apmr.
pressure distribution while sitting in office chairs. Appl Ergon. 2002.32677.
2016;53(1):1–9, https://doi.org/10.1016/j.apergo.2015.08.004. 15. Jan Y-K, Jones MA, Rabadi MH, Foreman RD, Thiessen A.
7. Munoz F, Rougier PR. Estimation of centre of gravity move- Effect of Wheelchair Tilt-in-Space and Recline Angles on
ments in sitting posture: Application to trunk backward tilt. Skin Perfusion Over the Ischial Tuberosity in People With
J Biomech. 2011;44(9):1771–5, https://doi.org/10.1016/j.jbio- Spinal Cord Injury. Arch Phys Med Rehabil. 2010;91:1758–
mech.2011.04.008. 64, https://doi.org/10.1016/j.apmr.2010.07.227.
8. Wong AYL, Chan TPM, Chau AWM, Tung Cheung H, 16. Vos GA, Congleton JJ, Steven Moore J, Amendola AA,
Kwan KCK, Lam AKH, et al. Do different sitting postures affect Ringer L. Postural versus chair design impacts upon inter-
spinal biomechanics of asymptomatic individuals? Gait Posture. face pressure. Appl Ergon. 2006;37(5):619–28, https://doi.
2019;67:230–5, https://doi.org/10.1016/j.gaitpost.2018.10.028. org/10.1016/j.apergo.2005.09.002.
9. O’Sullivan K, McCarthy R, White A, O’Sullivan L, Dan 17. Mooney V, Einbund MJ, Rogers JE, Stauffer ES. Compari-
kaerts W. Lumbar posture and trunk muscle activation dur- son of pressure distribution qualities in seat cushions. Bull
ing a typing task when sitting on a novel dynamic ergonomic Prosthet Res. 1971;10(15):129–43.
chair. Ergonomics. 2012;55:1586–95, https://doi.org/10.1080/0 18. Tasker LH, Shapcott NG, Watkins AJ, Holland PM. The ef-
0140139.2012.721521. fect of seat shape on the risk of pressure ulcers using
688 IJOMEH 2020;33(5)THE EFFECTS OF SEAT CUSHION CONTOUR AND SITTING POSTURE ORIGINAL PAPER
discomfort and interface pressure measurements. Prosthet 25. Ebe K, Griffin MJ. Factors affecting static seat cushion
Orthot Int. 2014;38(1):46–53, https://doi.org/10.1177/03093 comfort. Ergonomics. 2001;44(10):901–21, https://doi.org/10.
64613486918. 1080/00140130110064685.
19. Noro K, Fujimaki G, Kishi S. A Theory on Pressure Distri- 26. Fujimaki G, Mitsuya R. Study of the seated posture for VDT
bution and Seat Discomfort. In: Vink P, Klaus B, editors. work. Displays. 2002;23(1):17–24, https://doi.org/10.1016/S01
Comfort and design. Boca Raton: CRC Press; 2004. p. 33–9. 41-9382(02)00005-7.
20. Hobson DA. Comparative effects of posture on pressure 27. López-Torres M, Porcar R, Solaz J, Romero T. Objective
and shear at the body-seat interface. J Rehabil Res Dev. firmness, average pressure and subjective perception in
1992;29(4):21, https://doi.org/10.1682/JRRD.1992.10.0021. mattresses for the elderly. Appl Ergon. 2008;39(1):123–30,
21. Cascioli V, Liu Z, Heusch A, McCarthy PW. A methodol- https://doi.org/10.1016/j.apergo.2006.11.002.
ogy using in-chair movements as an objective measure of 28. De Looze MP, Kuijt-Evers LFM, Van Dieën J. Sitting com-
discomfort for the purpose of statistically distinguishing fort and discomfort and the relationships with objective
between similar seat surfaces. Appl Ergon. 2016;54:100–9, measures. Ergonomics. 2003;46(10):985–97, https://doi.org/
https://doi.org/10.1016/j.apergo.2015.11.019. 10.1080/0014013031000121977.
22. Hostens I, Papaioannou G, Spaepen A, Ramon H. Buttock 29. Noro K, Naruse T, Lueder R, Nao-i N, Kozawa M. Application
and back pressure distribution tests on seats of mobile agri- of Zen sitting principles to microscopic surgery seating. Appl
cultural machinery. Appl Ergon. 2001;32(4):347–55, https:// Ergon. 2012;43(2):308–19, https://doi.org/10.1016/j.apergo.
doi.org/10.1016/S0003-6870(01)00013-8. 2011.06.006.
23. Diebschlag W, Heidinger F, Kurz B, Heiberger R. Recom- 30. Zemp R, Taylor WR, Lorenzetti S. Are pressure measure-
mendation for Ergonomic and Climatic Physiological Vehi- ments effective in the assessment of office chair comfort/dis-
cle Seat Design. J Cell Plast. 1989;25(2):125–37, https://doi. comfort? A review. Appl Ergon. 2015;48:273–82, https://doi.
org/10.1177/0021955X8902500203. org/10.1016/j.apergo.2014.12.010.
24. Da Silva L, Bortolotti SLV, Campos ICM, Merino EAD.
Comfort model for automobile seat. Work. 2012;41(Suppl 1):
295–302.
This work is available in Open Access model and licensed under a Creative Commons Attribution-NonCommercial 3.0 Poland License – http://creativecommons.org/
licenses/by-nc/3.0/pl/deed.en.
IJOMEH 2020;33(5) 689You can also read