An evaluating methodology for hydrotechnical torrent-control structures condition
←
→
Page content transcription
If your browser does not render page correctly, please read the page content below
Ann. For. Res. 55(1): 125-143, 2012                                    ANNALS OF FOREST RESEARCH
						                                                                 www.e-afr.org

An evaluating methodology for hydrotechnical
torrent-control structures condition

Ş.O. Davidescu, I. Clinciu, N.C. Tudose, C. Ungurean

                       Davidescu Ş.O., Clinciu I., Tudose N.C., Ungurean C., 2012. An evaluating meth-
                       odology for hydrotechnical torrent-control structures condition. Ann. For. Res.
                       55(1): 125-143, 2012.

                       Abstract. Watershed management using torrent-control structures is an
                       activity having more than 100 years history in Romania, So far, re-
                       searches regarding works behaviour in service focused mainly on de-
                       fining and assessing each damage type, without studying the inte-
                       raction between them. Thus, damage classification criteria were
                       substantiated taking into account nature and strength of the damages.
                       This paper presents a methodology for assessing the condition of hydrotech-
                       nical structures by quantifying the cumulative effects of damages which occur
                       with a significant frequency during their service. The model was created using
                       a database, nationwide representative, with 3845 torrent-control structures.
                       The identified damage types identified were weighted using multi-criteria
                       analysis. Depending on the weight and strength off all damages occurred
                       was calculated an indicator named “condition rate” (Ys). This new param-
                       eter may be used to track the impact of different features (structure age,
                       components sizes, the position in the system, the construction materials,
                       riverbed slope, geology of the area, etc.) on the condition of structures.
                       By establishing the condition rate for all the structures within a col-
                       lectivity (an entire watershed or catchment area, a single watercourse, a
                       battery of works etc.), there may be made an analysis and a grading both
                       at individual level and population-wide level, which lead to order the re-
                       pairs or additions of new structures to existing hydrotechnical systems.
                       Also, the model designed can be a part of a monitoring system re-
                       garding torrent-control structures, answering, thus, the require-
                       ments on this issue of the “National Strategy for Flood Risk Man-
                       agement” approved by the Romanian Government in 2010.
                       Keywords condition rate, damage index, torrent-control structures, dams, drain
                       channels

                       Author. Şerban Octavian Davidescu (s_davidescu@icas.ro), Nicolae Constantin
                       Tudose, Cezar Ungurean - Forest Research and Management Institute (I.C.A.S.)
                       – Braşov Research Station: 13, Cloşca Street, Braşov, Ioan Clinciu – University
                       Transilvania Braşov, 29, Eroilor Boulevard, Braşov, România.
                       Manuscript received January 25, 2012; revised February 03, 2012; accepted March
                       23, 2012; online first April 19, 2012.

                                                                                                 125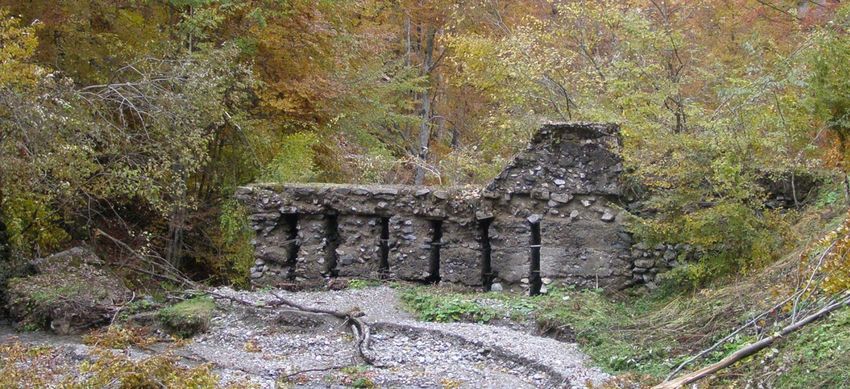
Ann. For. Res. 55(1): 125-143, 2012                                                       Research article

Introduction                                         (iv) mapping and description of a mountain
                                                     watershed using geographical information sys-
During the time through Romania were built           tems (Parachini, Folving, Vogt et al. - Institute
more than 18000 torrent – control structures,        for Environment and Sustainability EC); (v)
most of them (about 16000) being transverse          measures and programs regarding the moun-
works (dams, sills and traverses – called fur-       tain area and natural disaster management (G.
ther in the paper dams) leading up to reinforc-      Fiebiger, F. Rudolph, Miklos - Austria); (vi)
ing of more than 2100 km degraded river beds         IUFRO strategies for sustainable protection
(Adorjani et al. 2008). Since the beginning          against flooding, with a special long-term ac-
of torrent – control practice were designed          tion plan (Action Programme 2020), focused
and built 39 different types and 56 variants of      on the idea that monitoring of natural events
transverse hydrotechnical works (dams) and 5         in the mountain area is a defining part of risk
different drain channel types (Lazar, Gaspar         management in the plains.
1994). Dams and drain channels were placed              In Romania, researches regarding the be-
on very different conditions (relief, geologic,      haviour of torrent-control structures and the
climate), leading to different reactions of these    damages occurred during their lifetime aimed
structures occurring many damages in theres          at: the direct response to floods (Gaspar et al.
exploitation.                                        1972); the stability, strength and functionality
   A synthesis of the hydrotechnical torrent-        of the torrent-control structures (Lazar, Gaspar
control structure behaviour, which consists in       et al. 1994); the behaviour of torrent-control
identifying, evaluating and ordering the dam-        structures used in Olanesti Watershed (Mir-
ages, is a necessary tool for a permanent and        cea et al 1992); in upper basin of Târlungului
systematic monitoring of these works. Due to         River (Clinciu et al., 2003, 2008 and 2010), in
the lack of experiments that use scale mod-          Argesel and Cerna watersheds (Nedelcu, Tuas
els, different kind of works used in watershed       2008), in upper basin of Somes Mic River
management all around the country have been          (Lupa�������������������������������������
                                                            ş������������������������������������
                                                             cu 2009), Criş River catchment area
tested directly in nature, in watersheds having      (Davidescu 2011) and in Cârcinov Watershed
different torrential levels, the validation proc-    – Argeş River Basin (Tudose 2011); and a na-
ess of these structures being possible only by       tional overview based on a statistical coverage
monitoring their behaviour (Clinciu 2011).           of all used types of structures (Davidescu et.
Across Europe, part of the most recent con-          al. 2011).
cerns regarding monitoring activities of im-            In order to substantiate a systematic and per-
proved torrential watershed, were published by       manent monitoring program of torrent-control
FAO as a result of scientific events organized       structures, in this paper, is established a quanti-
by the working group for mountain watershed          tative expression according to actual condition
planning.                                            of these works, based on the strength of behav-
   The volume Mountain Watershed Manage-             ioural events occurred during exploitation, the
ment, Lessons from the past – Lessons for the        result being a “condition rate” characterizing
future (Proceedings of the Twenty-third Ses-         the general behaviour of these works.
sion, Davos, Switzerland, 2002), published by
Swiss Agency for the Environment, Forests
and Landscape (Bern, 2003), brings together          Materials and methods
papers that treat: (i) natural hazards zoning
(Engler - Switzerland); (ii) lessons learned         The proposed methodology is based on an
from past disasters (Pfister - Switzerland); (iii)   inventory of torrent-control structures which
risk management (Heinimann - Switzerland);           was part of the project PN 09460303 “Behav-

126
Davidescu et al.                               An evaluating methodology for hydrotechnical torrent-control ...

iour of Different Types of Hydrotechnical Tor-      major river basins of Romania (figure 1) and
rent Control Structures Used in Romanian Wa-        they were inventoried in two stages (2009 and
tershed Management” financed by Romanian            2010-2011) resulting two research areas: re-
Ministry of Education, Research, Youth and          gion I constituted by the following river ba-
Sports between 2008 - 2011.                         sins: Someş, Criş, Olt, part of Siret (upstream
  The amount of inventoried structures was          Bistriţa) and Prut and region II constituted by
established as representative for a statistical     the river basins: Tisa, Mureş, Bega, Timiş,
assurance of 95%, keeping account of all types      Caraş, Nera, Cerna, Jiu, Argeş, Ialomiţa, part
of structures and variants from all the river ba-   of Siret (downstream Bistrita) and the direct
sins in Romania, using the following equation       slopes of the Danube.
(Giurgiu 1972):                                        In addition to the descriptive notes about the
                                                    structures, that include geographical location
                                                    (longitude and latitude), identification elements
         u 2 ⋅ s %2 ⋅ N
n=                                            (1)   and size of each structure and its components
      N ⋅ ∆2% + u 2 ⋅ s %2                          (body, apron, guarding walls and terminal spur
                                                    for dams; apron, sidewalls and spur for drain
where: N represents the total amount of the         channels), data collected refer to the nature
population (18630); s% the coefficient of vari-     (typology) and intensity of behavioural events
ation (100%); Δ% the error limit admissible         (damages and dysfunctions). Therefore, opera-
(5%); u the normal deviation corresponding to       tors measured and estimated 3845 structures;
adopted probability (1.96).                         out of which 93% (i.e. 3584) are transverse hy-
  Structures in the sample are spread in all        drotechnical works (traverses, sills and dams
                                                    further named dams) and about 7% (261) are

                               Figure 1 Major river basins of Romania
                                                                                                          127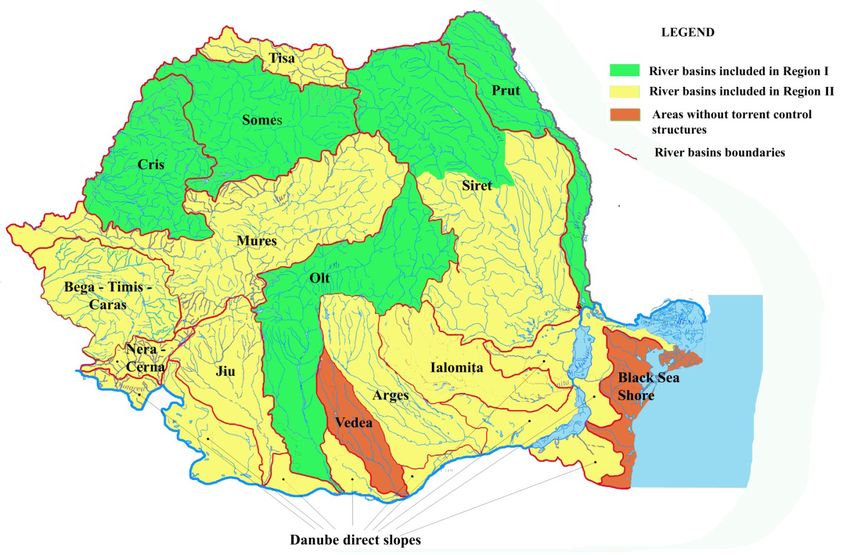
Ann. For. Res. 55(1): 125-143, 2012 Research article
drain channels. Determination of behavioural events that in-
The identified damages were ordered by their fluence structure condition
nature and the part of the structure affected.
Table 1 shows the damages that have been The outline methodology is to establish a con-
recorded (i.e. measured and/or evaluated) dition rate (Ys) for all the torrent-control struc-
for each of the dams or drain channels under tures which is substantiated considering only
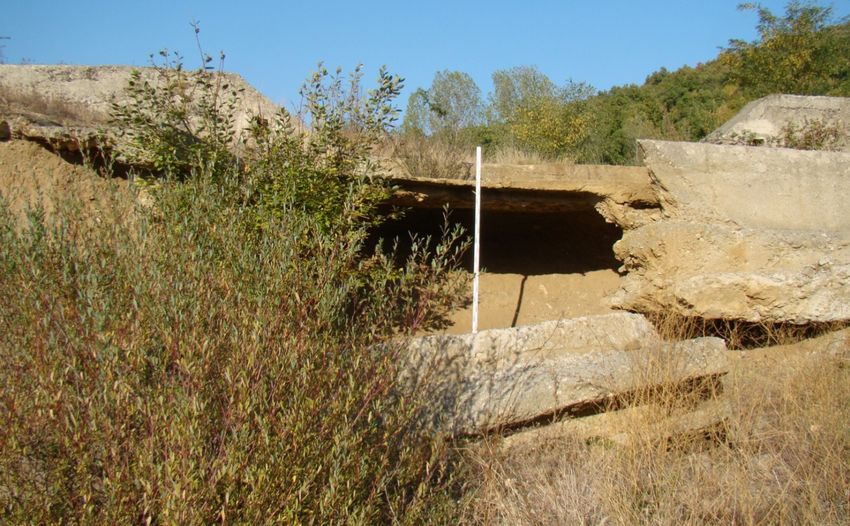
analysis and figure 2 shows a dam affected by the events with a significant frequency of oc-
multiple damages. The damages of the dam currence. Rare events, such as unembedding
were augmented with possible breakings of and cracks are omitted – following the defini-
the kinetics energy dissipation system (where tion of a “rare events” according to Poisson
applicable), concluding to identification of 23 distribution, whose frequency is expressed as
damage types for dams and 16 for drain can- (Giurgiu 1972):
nels. These behavioural events represent the
subject and research material of this paper. λ x −λ (2)
As mentioned above, this paper presents a f ( x) = ⋅e
x!
method for the quantification of the effect of
all damages occurred since the structures were
where: λ is a constant, the arithmetic mean (the
built, the result being a parameter called “con-
only parameter of the distribution), and x is the
dition rate” (Ys). Some of the recorded damag-
number of elements with characteristic data of
es were eliminated due to their rare frequency.
the “n” statements, x = 0, f0 = e-λ and for x ≠ 0,.f
Each of the remaining type of damage influ-
(x+1) = f (x)∙λ / (x+1).
ences the condition rate by taking into account
This statistical approach relies on the ob-
its strength and its importance in the general
servation that out of 3584 dams, 2955 do not
condition of the structure.
have any cracked components, and only 440
The novelty of this research lies in the ap-
works have one component affected by cracks,
plication of a multi-criteria analysis approach
148 works have two components, 33 works
in order to determine the weight each event’s
have three components, 6 works have four and
strength carries in determining a global indica-
only 2 dams have five components affected by
tor in relation to the physical condition of the
cracks.
work in a certain moment.
The arithmetic mean for components of the
dam cracked (m = 0.2592) is lower than the
corrected variance (s2c = 0.3283), fact that al-
lows us to call the compound Poisson distribu-
Table 1 Types of damages occurred during torrent control structures exploitation
Dam’s components Drain channel’s components
Body Spurs
Damage
Sidewalls
Guarding
Terminal
Central
Spilled
nature
Wings
Apron
Apron
wings
walls
Wall
spur
area
area
Unembedding x x x
Undermining x x x
Horizontal cracks x x x x x x x
Vertical cracks x x x x x x x
Cracked area x x
Breaks x x x x x x x x x
Abrasions x x x x x x x
128Davidescu et al. An evaluating methodology for hydrotechnical torrent-control ...
tion, which takes the form (Giurgiu 1972): 2007) we checked whether the experimental
distribution follows the Poisson law. Due to
γ
α
1
x
(3)
the fact that 1-k = 1.000 > D 0.05% = 0.167, the
f ( x) = ⋅ Cαx ⋅ (−1) x ⋅ null hypothesis is not rejected, we can con-
γ +1 γ +1
clude that there are no significant differences
where γ = m ( s2 – m2)-1 and α = m2 ( s2 – m2)-1 between the two series.
For x = 0 formula applied is: f0 = γα / (γ+1) α Appling the same methodology for un-
By comparing the theoretical values resulted embeddings, and considering the number of
from the frequency equation to the absolute wings affected to 4 (two for the structure’s
values (see Table 2) it is possible to observe a body and two for the spur) the analysis shows
very good approximation between theoretical a close resemblance between theoretical and
and experimental frequencies, exemplified in experimental frequencies (see Figure 4); thus
figure 3. concluding that this type of event follows the
Using the Kolmogorov-Smirnov test (Lopes Poisson distribution law as well. The conclu-
Figure 2 Multiple damages (wall wing and spilled area breaking, body abrasions, guarding wall breaking
etc.) occurred during the exploitation of dam 90MF6.0 placed on the riverbed of Lungsor stream
(Crişul Repede Watershed)
Table 2 Fitting of the experimental distribution regarding cracks occurrence with Poisson theoretical
distribution
Dam’s parts cracked Frequency equation values
Theoretical
No. of components Structures frequencies
Empirical Theoretical
affected (x) affected (n)
0 2955 0.8245 0.7947 2848
1 440 0.1228 0.1627 583
2 148 0.0413 0.0338 121
3 33 0.0092 0.0070 25
4 6 0.0017 0.0015 5
5 2 0.0006 0.0003 1
Total 3584 - - 3584
129Ann. For. Res. 55(1): 125-143, 2012 Research article
sion has been confirmed by the Kolmogorov- ferent ways they are facing loads resulted from
Smirnov test (1-k = 1.000 > D 0.05% = 0.200). floods. On another hand, dams are divided in
The cracking of drain channel’s compo- two categories (with and without an apron), for
nents and the unembedding of channel’s spur the first category taking into account 11 behav-
are even rarer than those that affect the dams, ioural events, only 4 events being considered
thus triggering the conclusion that cracks and for the second category. The influence of each
unembeddings can be omitted from the proc- damage type was analysed fixing its weight
ess of establishing the structure condition rate and strength.
both for dams and for drain channels. The strength was established for each be-
havioural event depending on data collected.
Weight of different behavioural events on Breaks of structure components were evalu-
structure’s general condition ated using a single criterion (detached section
of each component, counted as percent) this
After the rare events exclusion, there remain one defining the strength. For the rest of the
11 behavioural events that affect the dams and damages strength was established using two
8 for drain channels shown in Table 3. criteria: the undermining depth (m) and the
The two types of works (dam and drain chan- relative width (%) as seen in figure 5, respec-
nel) have to be analysed separately due to dif- tively, the abrasion depth (cm) and ratio of the
3500
4000
No. of dams affected by unembeddings
No. of dams affected by cracks
3000 2955 3500
2848 3352
2500 3000 3087
2000 2500
2000
1500
1500
1000
1000
583
500
440 500 254
148 2533
121 56 12 55 04 00
0 0 173 10
0 1 2 3 4 5
Dam's components cracked 0 1 2 3 4
Unembedded wings
experimental distribution theoretical distribution experimental distribution theoretical distribution
Figure 3 Distribution of number of dams depend- Figure 4 Theoretical (Poisson) and experimental fre-
ing on the number of parts cracked during quencies for structures affected by unem-
exploitation beddings
Table 3 Types of damages occurred during torrent control structures exploitation
Dam’s components Drain channel’s components
Body Spur
Damage
Sidewalls
Guarding
Terminal
Apron
Apron
walls
Central
nature
Spilled
spur
Wings
wings
Wall
area
area
Undermining x x x
Breaks x x x x x x x x x
Abrasions x x x x x x x
130Davidescu et al. An evaluating methodology for hydrotechnical torrent-control ...
component surface affected (%). For these last that defines the weight of the event is given
types of damage, a parameter called “event in- below (Bobancu 2010):
tensity rate” has been defined, for establishing
the strength, by multiplying values of both cri-
γi =
(p + m + 0,5 + ∆ )
p
N (4)
teria. '
− ∆p +
To estimate the weight of each damage type 2
(ɣi) a quadratic table was created for each type where: γi is event weigh; p – score of the event;
of structure studied (tables 4-6). The table was m – amount of outranked events; Δp - differ-
used to cross-compare one by one damages: ence between event “i” score and of the less
the rows and columns in the table represent ranked event score; Δ’p - difference between
damage types, and each cell of the table field the event score and score of the best ranked
represents a comparison between two events. event; N - amount of events considered.
When an event in a row is compared to an
event in a column, the cell value is as follows: Establishing a unique event intensity rate
1 – if the first one is more important (in terms scale
of structure condition) than the second; 0.5 – if
both events have even importance and 0 – if Since each event has a different strength scale,
the first event is less important than the second depending on assessed elements, a conversion
one. was made for of all the event intensity rates to a
The weight of each behavioural event in unique scale depending on the maximum value
structure condition rate was set by adding of each one (see Table 7). The intensity rates of
points on each table line establishing a rank the maximum drain channel event (for break-
depending on the score resulted. If two or ings, undermining and abrasion) were adopted
more events have the same amount of points same as the events which affect the dams.
the rank and level are the same, being admit- The adopted scale has values between 0 and
ted an equal value, even decimal. The equation 100, normalization being performed using a
Figure 5 Apron undermining affecting 10% of the apron, having a depth of 3.0 m and an intensity rate
of 0.3 of the structure 30B0.5 located on Bremenea Valley (the direct slopes of Danube)
131Ann. For. Res. 55(1): 125-143, 2012 Research article
Table 4 Dams with apron behavioural events weighting, using multi – criteria analysis
Guarding wall
Guarding wall
Computing elements
undermining
undermining
Criterion
Wall wing
Spill area
(behavioural
breaking
breaking
breaking
breaking
breaking
abrasion
abrasion
abrasion
abrasion
Weight
Score
Rank
Apron
Apron
Apron
event)
(γi)
Body
Body
Spur
Spur
Body
0.5 0.5 0.0 1.0 0.5 1.0 1.0 0.5 1.0 1.0 1.0 8.0 3.5 2.88
undermining
Spill area
0.5 0.5 0.0 1.0 0.5 1.0 1.0 1.0 1.0 1.0 1.0 8.5 2.0 3.47
breaking
Wall wing
1.0 1.0 0.5 1.0 1.0 1.0 1.0 1.0 1.0 1.0 1.0 10.5 1.0 5.64
breaking
Body
0.0 0.0 0.0 0.5 0.0 0.5 0.0 0.0 1.0 0.5 1.0 3.5 8.0 0.72
abrasion
Apron
0.5 0.5 0.0 1.0 0.5 1.0 1.0 0.5 1.0 1.0 1.0 8.0 3.5 2.88
breaking
Apron
0.0 0.0 0.0 0.5 0.0 0.5 0.0 0.0 1.0 0.5 1.0 3.5 8.0 0.72
abrasion
Apron
0.0 0.0 0.0 1.0 0.0 1.0 0.5 0.5 1.0 1.0 1.0 6.0 6.0 1.70
undermining
Spur
0.0 0.0 0.0 1.0 0.0 1.0 0.5 0.5 1.0 1.0 1.0 7.0 5.0 2.22
breaking
Spur
0.5 0.0 0.0 1.0 0.5 1.0 0.0 0.0 0.5 0.0 1.0 1.5 10.0 0.28
abrasion
Guarding wall
0.0 0.0 0.0 0.0 0.0 0.0 0.0 0.0 1.0 0.5 1.0 3.5 8.0 0.72
breaking
Guarding wall
0.0 0.0 0.0 0.5 0.0 0.5 0.0 0.0 0.0 0.0 0.5 0.5 11.0 0.06
abrasion
Table 5 Dams without apron behavioural events weighting, using multi – criteria analysis
Computing elements
Criterion Body Spill area Wall wing Body
Weight
(behavioural event) undermining breaking breaking abrasion Score Rank
(γi)
Body undermining 0.5 0.5 0.0 1.0 2.0 2.5 1.43
Spill area breaking 0.5 0.5 0.0 1.0 2.0 2.5 1.43
Wall wing breaking 1.0 1.0 0.5 1.0 3.5 1.0 5.00
Body abrasion 0.0 0.0 0.0 0.5 0.5 4.0 0.20
Table 6 Drain channels behavioural events weighting, using multi – criteria analysis
Computing elements
area breaking
Undermining
Spur central
Spur wing
Criterion
breaking
Sidewall
breaking
Sidewall
breaking
abrasion
abrasion
abrasion
(behavioural event) Weight
Score Rank
Apron
Apron
(γi)
Spur
Apron breaking 0.5 1.0 1.0 1.0 1.0 1.0 1.0 1.0 7.5 1.0 5.50
Apron abrasion 0.0 0.5 0.0 0.5 1.0 1.0 0.5 1.0 4.5 3.5 2.00
Sidewall breaking 0.0 1.0 0.5 1.0 1.0 1.0 1.0 1.0 6.5 2.0 3.80
Sidewall abrasion 0.0 0.5 0.0 0.5 1.0 1.0 0.0 1.0 4.0 5.0 1.47
Undermining 0.0 0.0 0.0 0.0 0.5 1.0 0.5 1.0 3.0 6.0 0.94
Spur wings breaking 0.0 0.0 0.0 0.0 0.0 0.5 0.0 1.0 1.5 7.0 0.40
Spur central breaking 0.0 0.5 0.0 1.0 0.5 1.0 0.5 1.0 4.5 3.5 2.00
Spur abrasion 0.0 0.0 0.0 0.0 0.0 0.0 0.0 0.5 0.5 8.0 0.09
132Davidescu et al. An evaluating methodology for hydrotechnical torrent-control ...
Table 7 Converting intensity rates to a unique scale
Structure Behavioural Affected structure Maximum Converting
type event type component intensity rate (Imax) factor (Fc)
Structure body 5.0 20.00
Undermining
Apron 4.0 25.00
Body wall wings 1.0 100.00
Body spilled area 1.0 100.00
Breaking Apron 1.0 100.00
Dams Terminal spur 1.0 100.00
Guarding walls 1.0 100.00
Structure body 1.0 100.00
Apron 0.5 200.00
Abrasion
Terminal spur 0.5 200.00
Guarding walls 0.7 142.86
Undermining Spurs 4.0 25.00
Apron 1.0 100.00
Drain Breaking Sidewalls 1.0 100.00
Spurs 1.0 100.00
channels
Apron 0.5 200.00
Abrasion Sidewalls 0.7 142.86
Spurs 0.5 200.00
conversion factor (Fc), as a result of dividing each structure type were: 38.5 for dams with
100 (maximum value on the unique intensity apron; 25.6 for dams without apron and 36.2
rate scale) to the maximum value of each event for drain channels.
intensity rate (I max, i): In order to make comparative analysis be-
tween different structures and to gain the re-
100 sults representative for a hydrotechnical sys-
Fc = (5)
I max,i tem as a whole, due to different damages that
occur in the exploitation of different kinds of
structure, it was necessary to harmonize the
Damage index and condition rate
damage indexes resulted from the analysis. To
emphasize the condition of the structure a new
The cumulative effect of behavioural events
parameter was defined whose value decreases
that affect hydrotechnical works is represented
as the damage degree increases. Those issues
by the square root of the sum of the products
were considered and by taking account of
between damages weight (γi), their intensity
maximum value of the damage index for each
rates (Ii) converted using the particular con-
structure type Max(YA), a scale from 0 to 100 to
verting factor (Fc i)., resulting an equation that
define structures health and the particular value
define a so called damage index (YA):
for structures damage index (YA), the condition
rate for each work (YS)was calculated using the
YA = ∑γ i ⋅ I i ⋅ Fci (6)
following equation:
The damage index was determined for all the Y ⋅100
YS = 100 − A (7)
works (3845), regardless of their type (dams Max(Y A )
with apron, dams without apron or drain chan-
nels), finally yielding in distinct values of this
parameter. The maximum values calculated for
133Ann. For. Res. 55(1): 125-143, 2012 Research article
Condition rate frequencies distribution
f x = k ⋅ e −α ⋅ x (8)
The entire statistical population studied was
stratified so its variability could be analyzed where: e is the natural logarithm, k and α -
using different criteria: structures age, typol- Meyer equation parameters, which depend on
ogy, materials used to build them, height (for the experimental distribution specifications,
dams) etc. Along with collecting data concern- namely structures condition rate.
ing structures, the damages occurred and their The Kolmogorov-Smirnov test was used to
strength, field operators praised works general check the null hypothesis, and the differences
condition using a five levels scale (1 - mean- between theoretical and experimental frequen-
ing a totally damaged structure to 5 - a very cies have been found to be insignificant. As 1-k
good structure with no important damages = 1.000 > D0.05% = 0.200, the null hypothesis
occurred). Therefore structures stratification is not rejected, so the two data series did not
according to condition rate was made on five differ significantly.
classes (levels) accordingly to those used in Regarding the drain channels, even if data
visual assessment, as shown in the Table 8. amount is much smaller, their distribution
Dam’s distribution depending on their condi according to structure condition follows the
tion follows Meyer equation (Figure 6), Meyer equation too (Figure 7), the indicator
which expresses theoretical frequencies as: D0.05% (0.200) being less than 1-k =1.000.
Comparison between works general condition
Table 8 Structures classification according their visually assessed and their condition rate
condition rate
Structure Visual Condition rate value Confirming that the experimental distribution
condition assessment (Ys) of structure’s condition rate may be adjusted by
Very bad 1 0 – 20 a law of a theoretical distribution we conclude
Bad 2 20 – 40 that the experiments were carried out correctly
Average 3 40 – 60 and the newly-defined parameter “condition
Good 4 60 – 80
Very good 5 80 – 100 rate” can be used in further statistical analy-
Experimetal values Theoretical frequencies Experimental values Theoretical frequencies
2500
2125 2100
200 187 181
180
2000
160
140
No of dams
1500
120
No of drain channels
928 100
1000 764
80 65
500 341
410 60 42
180 181 174 40 23
80
16 10
0 20 8 5 3
Very bad Bad Average Good Very 0
good Very Good Average Bad Very Bad
Structure condition Good Structure condition
Figure 6 Dams condition rate experimental distribu- Figure 7 Drain channels condition rate experimen-
tion adjusted by Meyer equation tal distribution adjusted by Meyer equa-
tion
134Davidescu et al. An evaluating methodology for hydrotechnical torrent-control ...
ses. As mentioned above, along the field work, the 3584 structures, obtaining a linear regres-
operators estimated all works condition using sion whose correlation coefficient, 0.8274
a five-level assessment scale. In order to test (see Figure 9), proves a very significant rela-
the accuracy of structures condition rate cal- tion for a series with 3582 freedom degrees.
culated according to presented methodology a Regarding the drain channels, both correla-
comparative analysis was performed between tion types (between the amounts of structures
visually examination of the structures and their in paired categories and piece by piece com-
condition rate. Firstly there were compared the parison) are tight, having correlation coeffi-
structures amount to the paired levels of both cient values that prove it (0.9757, respectively
scales (as presented in table 8), the results be- 0.8299 for series with 3 and 259 freedom de-
ing shown in figure 8. grees).
Secondly a correlation was made be-
tween the visually assigned condition cat- Dam age influence over its condition rate
egory and condition rate value for each of
The age influence over the condition rate was
spotted considering 5 year categories and the
2500 0.002x
y = 105.12e average value of the condition rates for all the
2
very good
2000
R = 0.9396 structures within a category limits. Due to the
Structures classified in condition rate
relative little number of structures older than
1500 50 years, a special category was created (50-
106 years old) having an average age of 78.
categories
1000
A logarithmical inverse regression (see Figure
good 10) was found, which shows that as structures
500
bad get older, their condition rate decreases.
very bad average
0 A simple variance analysis between age cat-
0 500 1000 1500 egories was carried out, in order to explain the
Structures classified in visually assigned condition
categories
experimental line discontinuity and to capture
Figure 8 Correlation between the structures amount time periods when low quality structures were
in categories established by visual assess- built (see Table 9).
ment and calculated condition rate By applying the Fisher test, it can be con-
cluded that significant differences occur among
100
100
90
80 95 y = -6.8011Ln(x) + 100.12
Average condition rate
Condition rate (Ys)
70 90 2
R = 0.749
60 85
50
80
40
30 75
y = 17.741x + 9.092
20 2 70
R = 0.6802
10
65
0
60
0 1 2 3 4 5 6
0 20 40 60 80 100
Visually assigned condition categories
Dam's age
Figure 9 Relation between the condition rate Figure 10 Relation between dam age and their con-
and the visually assigned condition cat- dition rate
egories
135Ann. For. Res. 55(1): 125-143, 2012 Research article
age categories considering the average condi- two condition rates of age categories, accord-
tion rate. A detailed analysis was carried out as ing to the transgression probability, were de-
a part of this research concerning the variance termined using following relations (Giurgiu
between age categories (Table 10). 1972):
The error regarding the differences between
age categories (sd) was determined using the DL5% = 1.96 × sd (10)
residual variance, according to the following
DL1% = 2.58× sd (11)
equation (Giurgiu 1972):
DL0.1% = 3.29× sd (12)
1 1 (9)
sd = se2 ⋅ +
n n
i j
Drain channel age influence over its condi-
ni and nj being the number of observations for tion
analyzed categories.
Maximum values of the differences between Even where the regression line gradient is low
Table 9 Influence structure age in the condition rate, highlighted by simply variance analysis
Age categories Structures
Average
within age Variance Freedom
Category condition Variances F
No. category source degrees
limits (age) limits rate
1 0-5 193 93.4
2 5-10 309 91.5 Between
3 10-15 196 84.1 10 st2 = 15294.0 27
variables
4 15-20 249 79.0
5 20-25 554 72.6
6 25-30 535 76.3 Residual
7 30-35 617 75.0 3573 se2 = 558.4 -
variance
8 35-40 316 75.9
9 40-45 203 70.0 Entire F0,05 = 1.83
10 45-50 194 80.3 3583 s2 = 599.5
11 >50 218 73.3 variance F0,01 = 2.32
Table 10 Variation significances between age category average condition rates
Structures Age categories
Age Average within 1 2 3 10 4 6 8 7 11 5 9
cate- condition age
gories rate category Differences between average values of the condition rate
limits
1 93.4 193 - 1.9 9.3*** 13.1*** 14.4*** 17.1*** 17.5*** 18.4*** 20.1*** 20.8*** 23.4***
2 91.5 309 - - 7.4*** 11.2*** 12.5*** 15.2*** 15.6*** 16.5*** 18.2*** 18.9*** 21.5***
3 84.1 196 - - - 3.8 5.1* 7.8*** 8.2*** 9.1*** 10.8*** 11.5*** 14.1***
10 80.3 194 - - - - 1.3 4.0* 4.4* 5.3* 7.0** 7.7*** 10.3***
4 79.0 249 - - - - - 2.7 3.1* 4.0* 5.7*** 6.4*** 9.0***
6 76.3 535 - - - - - - 0.4 1.3 3.0 3.7** 6.3***
8 75.9 316 - - - - - - - 0.9 2.6 3.3* 5.9**
7 75.0 617 - - - - - - - - 1.7 2.4 5.0**
11 73.3 218 - - - - - - - - - 0.7 3.3*
5 72.6 554 - - - - - - - - - - 2.6
9 70.0 203 - - - - - - - - - - -
Note: * - significant difference at p < 0.05, ** - significant difference at p < 0.01, *** - significant difference at p <
0.001.
136Davidescu et al. An evaluating methodology for hydrotechnical torrent-control ...
(Figure 11) – considering 260 freedom degrees mortar masonry, part of them being repaired
and a 1% transgression probability (R0.01% = during 1975 – 2005 (Figure 12).
0.181) – the correlation coefficient has a value Next, the condition rate decrease due to
of 0.2177, which suggests a distinct significant some channel characteristics (length, depth,
relation between channel age and its condition apron width and age) was checked using Pare-
rate. to chart (see Figure 13). This diagram type al-
The low gradient of regression line is ex- lows separating the influence of independent
plained by the good condition of drain chan- factors over a dependent one (condition rate).
nels 50 – 60 years old, in that situation being The results obtained show that age has the
reported 13 drain channels built using cement greatest influence on a channel condition rate,
followed by its width, channel depth and chan-
100.0
nel length. The last three factors are below a
90.0 5% transgression probability.
80.0 Common influence of the most important
70.0 two factors (age and apron width) is revealed
condition rate
60.0
using a regression plan (see Figure 14), con-
50.0
40.0 cluding that young channels having a small
30.0 width are in a very good shape, the condition
20.0 rate being between 80 and 100.
10.0
The equation (13) that defines the condition
0.0
0 20 40 60 80
rate (Ys) according to apron width (l) and chan-
nel age (T) corresponding to the regression
drain channel's age
plan shown above, has a 95% level confidence
Figure 11 Relation between drain channel’s age
each coefficient being inside confident limits
and its condition rate
Figure 12 Drain channel 10KM137 on Plaic Stream (Tisa Watershed) built on 1965
and repaired on 2005
137Ann. For. Res. 55(1): 125-143, 2012 Research article
setting 16 height categories from the dam’s
Ys = 96.1316 - 1.4919× l - 0.2653× T (13) database. Category limits were established for
each 0.5 m until 7.0 m height, with dams ex-
ceeding 7.0 m height being included in a spe-
Dam height influence over its condition rate cial category (7.0 – 12.0 m).
Due to the low value for the regression gra-
To check the height influence on dam condition dient, fact simultaneously sustained by a de-
rate it was studied the correlation dependence creased regression coefficient (0.2678), the
between these parameters for each structure, conclusion is that between those parameters
Freedom degrees = 255 there is not an obvious influence; dam’s height
Condition rate Ys
does not affect directly the condition of the
structure.
Age 3.45 Building material and dam type influence on
its condition
Width 1.87
To emphasize the influence of the construction
material on dam condition, there were defined
Depth 1.55 12 dam categories taking into account the
building material and the constructive solution
adopted for the most important materials (con-
Length 0.91 crete and cement mortar masonry). For each
category a complex histogram was created that
0 1 2 3 4 highlights ratio of each category of dams on
p = 0.05 each condition rate category set out in table 8
Figure 13 Pareto chart used to rank various factors (Figure 15), the values on the top of the chart
influence over drain channel’s condition showing the average condition rate for each
rate
Figure 14 Condition rate variation due to age and width highlighted using a regression plan
138Davidescu et al. An evaluating methodology for hydrotechnical torrent-control ...
100
81,6 72,1 87,8 81,4 89,3 43,6 61,7 76,8 61,4 79,3 58,4 80,3
90
80
70
60
50
40
30
20
10
0
B BCF BF BPR BT CL G M MCF MF ZU MB
very good condition good condition average condition bad condition very bad condition
Figure 15 Frequency histogram of dams according to structure and condition categories
work category. For concrete channels, over 80% were found
The defined dams categories were: continu- to be in a very good condition, the fraction be-
ous concrete dams (B), buttresses concrete ing in a bad or very bad condition being in-
dams (BCF), filtering concrete dams (BF), significant. However, the general image on the
continuous cement mortar masonry dams mortar walled channels is different, non-dam-
(M), buttresses cement mortar masonry dams aged structures representing only 66%, and the
(MCF), filtering cement mortar masonry dams fraction being in a bad or very bad condition
(MF), prefab materials made dams (BPR); representing 9% (Table 11).
PREMO pipes made dams (BT); wood, made
dams (CL), gabions dams (G), dry masonry
dams (ZU), mixed masonry dams (MB). Discussions
Building material and drain channel type in- Concerns regarding the monitoring of natural
fluence over its condition events and the importance of torrent – control
structures to mitigate river bed erosion and
Similar to the analysis described above, there to prevent downstream alluvial deposits were
have been established 7 drain channel catego- main subjects of recent researches carried out
ries: concrete channel (KB), reinforced con- by Hancock and Willgoose (2004), FAO (2004
crete channel (KBA), cement mortar masonry and 2005) Conesa-Garcia et al (2007, 2008
channel (KM), concrete and prefab materi- and 2009), Martin – Vide and Areatta (2009),
als channel (KBPR), prefab material channel Garcia et al. (2011). Those papers reached con-
(KP), dry masonry channel (KZU); resulting clusions that help understanding behaviour and
the frequencies shown in the following table. benefits of torrent – control structures.
139Ann. For. Res. 55(1): 125-143, 2012 Research article
Table 11 Structure frequencies (%) according to their building material and condition rate category
Drain channel type
Concrete Cement
Condition Reinforced Prefab
Concrete and prefab mortar Dry masonry
category concrete material
channel materials masonry channel
channel channel
channel channel
very good 81.7 - 66.2 - 100.0 -
good 13.8 50.0 17.9 - - -
average 1.8 50.0 6.9 100.0 - 100.0
bad 0.9 - 6.2 - - -
very bad 1.8 - 2.8 - - -
The study of 106 torrent-control structures results gained by using outlined methodology
located on Tarlung Watershed, upstream Sacele respect a natural distribution law (Meyer) so
reservoir (Clinciu et al. 2010; Clinciu 2011��)� they can be used further on studies regarding
led to the substantiation of a complex research torrent-control structures.
methodology regarding the behaviour of these To approve the condition rates obtained,
structures. An important part of the methodol- they were compared with the condition visual
ogy is the completion of the classification sys- assessment made while structures were inven-
tem of failures and dysfunctions (Gaspar 1984, toried and evaluated from behavioural point
Lazar & Gaspar 1994), and its statistical foun- of view. By studying the regressions between
dation opened new horizons in the research of visual and calculated condition assessment us-
behavioural events occurred during exploita- ing two methods (paired categories and piece
tion of torrent-control structures. by piece comparison) for dams and drain chan-
In the upper watershed of Somes Mic River nels, we concluded that the condition rate re-
(Lupascu 2009) research regarding almost 300 veal the real status for over 90% of the studied
torrent – control structures led to a detailed structures, the resulted correlation factors hav-
analysis of all behavioural events occurring ing significant values related to the freedom
in their service. The applied methodology im- degrees of each analyzed series.
proves the one crystallized during research un- Despite these tight correlations there have
dertaken in Târlung catchment�����������������
;����������������
first defining been some structures that were visually as-
scales for assessing following events: break- sessed as having a very bad condition, but the
ings, apron undermining, body undermining, condition rate was high due to the fact that this
suffusion, spillway obstruction, clearing of the methodology do not counted all the events that
siltation, non-accomplishment of the siltation. occurs during a structure life time (unembed-
As the authors know an approach that deter- ding and cracking, being excluded cause there
mines the cumulative effect of damages oc- rare frequency). Unembedding does not always
curred during the torrent-control structure trigger other events, but the structure could be
exploitation was not defined yet by any other damaged by right. In the same time due to the
research and thus, this approach constitutes a approach using the condition rate model tends
novelty in the field. to reduce the influence of peak values of the
First of all, the events types were ranked, various damages strength, but responds very
and for each one of those that have a signifi- well in situations where more behavioural
cant frequency, was established its weight that events affect a same structure simultaneously.
combined with its strength lead to the condi- Furthermore, comparing the visual established
tion rate, a parameter that synthesize all the be- condition category with the recorded damages
havioural events occurred. Using a conformity and their strength, few erroneous assessments
test (Kolmogorov- Smirnov) it was proved that were reported, which explains the possible un-
140Davidescu et al. An evaluating methodology for hydrotechnical torrent-control ...
derestimation of some structure condition. need to be rehabilitated anymore.
In terms of dams age the analysis emphasizes The overwhelming majority of dams are
that those made between 1986 to 1990 (5th age made using cement mortar masonry and con-
category) have a lower condition than those crete (91%). Cement mortar masonry struc-
from near categories, being a lot more dam- tures condition is lower then concrete ones,
aged (see Figure 9), due to economical policies in both cases filtering dams being better then
regarding torrent-control structures. The small- continuous, which are better then buttresses
est condition rate (70.0) is recorded for struc- dams.
tures done during 1966-1970 (9th age category)
that passed over their normal life time. Older
ones (built during 1961-1966) have a condition Conclusions
comparable with those of 15 years old due, on
one hand, to their elaborate execution, and on Structure condition established using the mod-
the other one, to repairs made since there were el proposed and proved as valid by this paper
built. may be extended to a whole torrent-control
Figure 11 shows that drain channels having system or to a battery of dams and channels.
a condition rate less than 20 (very bad condi- Condition rate determined for a single struc-
tion) were built during 1961-1976, structures ture or for a group leads to a classification ac-
being at the limit of their service period or ex- cording to their damage degree. Thus those
ceeded it. The examination of drain channels parameters may be used, on one hand, as in-
older than 60 years data base revealed that are dicators of catchment’s structures status and,
13 pieces made using cement mortar mason- on the other hand, according to these rates, it
ry, part of them being repaired since 1975 to may be established an order of repairs or addi-
2005. tions to existing torrent-control systems with
There are young structures (less than 10 new structures.
years old) from both categories (dams and A ranking system of repairs / additions can
drain channels) having a bad condition or use framing structure categories proposed,
worse because they faced successively many based on the condition rate: first stage includes
floods (2005, 2006 etc.) and torrent-control works having very bad condition, Ys ≤ 20
systems were caught empty, and so, vulnerable (code red); in the second stage works having
to shocks. bad condition, 20 < Ys ≤ 40 (code orange); in
Dams built using PREMO pipes are in a the third stage works having average condi-
very good condition, reflected by the highest tion, 40 < Ys ≤ 60 (code yellow) etc. This is
value for the condition rate (Ys = 89.3). Small not a strictly prioritization method, it can be
condition rates (43.6) are reported for wood changed, frames being established by those
structures, three quarters having an average interested in, depending on their own criteria
condition or less. Those structures life time is (available funds; available manpower, par-
expected for 15 years and the average age of ticular machinery available etc.); being a very
these structures is 21 years. malleable method.
Gabions or dry masonry’s dams were built Last but not least by applying the proposed
prevalent for an immediate river bed stabiliza- model integrated into a geographic database, it
tion followed by afforestation of it and shores. is possible to create a torrent control structures
Generally torrent activities are a lot dimin- monitoring system, answering to the European
ished, even extinguished, structures, beside requirements on this issue.
their degradation, fulfilled their role, actual
condition being satisfactory and they don’t
141Ann. For. Res. 55(1): 125-143, 2012 Research article
Acknowledgements report, European Forestry Commission-FAO, Rome,
Italy.
FAO, 2005. Preparing for the next generation of watershed
Data used on this paper were recorded as part management programmes and projects. Europe, Proc.
of the project “Behaviour of Different Types European Regional Workshop on Watershed Manage-
of Hydrotechnical Torrent Control Structures ment, Megève, France.
Garcia J.L., Garcia F., Ciulianu A., 2011. �������������
The works in
Used in Romanian Watershed Management” the torrential correction and their effect after a century.
integrated in the program GEDEFOR (Sus- Proceedings of the Biennial International Symposium
tainable Management of Forest Ecosystems in “Forest and Sustainable Development”. Transilvania
the Context of Global Environmental Change) University Publishing House pp. 415-420.
Gaspar R., Apostol Al., Costin A., 1972. Comportarea
funded by the Romanian Ministry of Educa- lucrărilor hidrotehnice de corectare a torenţilor în tim-
tion, Research, Youth and Sports, and we like pul viiturilor din anul 1970 [The behaviour of torrent-
to thanks to all the people involved in it. control structures during floods from 1970]. Revista
Pădurilor 1: 23-30.
Gaspar R., 1984. Norme tehnice pentru urm������� ărirea
comportării în timp a lucrărilor de construcţii folosite
References în amenajarea torenţilor [Technical
��������������������������������
rules for monitoring
the behavior of constructions used in torrents manage-
Bobancu Ş., 2010. Creativitate şi inventică [Creativity and ment. I.C.A.S., Forestry Minister. 48 p.
invention], Editura Universităţii Transilvania. Braşov, Giurgiu V., 1972. Metode ale statisticii matematice apli-
162 p. cate în silvicultură [Statistical methods applied in for-
Clinciu I., 2011. Cercet�����������������������������������
ări privind lucrările de amenajare estry]. Editura Ceres, Bucharest, 565 p.
a reţelei hidrografice torenţiale din bazinul superior al Giurgiu V., 2008. Cu privire la gestionarea durabilă a
Târlungului (amonte de acumularea Săcele). ����������
[Research- pădurilor din bazinele hidrografice torenţiale [Regard-
es regarding the torrential hydrografical management ing the sustainable management of forests in the tor-
structures in upper T����������������������������������
ârlung Watershed (upstream Săcele rential watershed]. Silvologie VI, Editura Academiei
water storage dam��������������������������������������
]. Editura Universităţii Transilvania Române. Bucureşti, pp. 353-371.
din Braşov, 400 p. Hancock R.G., Willgoose R.G., 2004. An experimental
Clinciu I., Petriţan I.C., Niţă M.D., 2010. Monitoring
��������������
of and computer simulation study of erosion on a mine
the hydrotechnical torrent – control structures: a sta- tailings dam wall. Earth Surface Processes and Land-
tistical approach. Environmental Engineering and Man- forms 29(4): 457-475.
agement Journal 9(12): 1699-1707. Lazăr N., Gaspar R. et al., 1994. Cercetări privind sta-
Conesa-Garcia C., Lopez-Bermudez., Garcia-Lorenzo R., bilitatea, rezistenţa şi funcţionalitatea lucrărilor hi-
2007. Bed stability variations after check dam construc- drotehnice de amenajare a torenţilor [Research regard-
tion in torrential channels (South-Est Spain). Earth Sur- ing stability, durability and functionality of torrent
face Processes and Landforms 32(14): 2165-2184. – control hydrotechnical works]. Final report I.C.A.S.
Conesa-García C., García-Lorenzo R., 2008. Effective- Bucharest, 120 p.
ness of check-dams in the control of general transitory Lupaşcu F., 2009. Cercetări privind comportarea şi efectele
bed scouring in semiarid catchment areas (South-East lucrărilor de amenajare a reţelei hidrografice torenţiale
Spain). Water and Environment Journal 23(1): 1-14. din bazinul superior al Someşului Mic [Research re-
Davidescu Ş.O., 2011. Comportarea în exploatare a garding the behaviour and effects of torrent control
lucrărilor hidrotehnice utilizate în amenajarea albiilor structures from upper Somesul Mic catchment]. PhD
bazinelor hidrografice torenţiale, predominant forest- thesis, University Transilvania Braşov, 64 p.
iere, din spaţiul hidrografic Crişuri. [In service behav- Lopes R.H.C., Reid I., Hobson P.R., 2007. The two-di-
iour of hydrotechnical torrent-control structures used mensional Kolmogorov-Smirnov test. XI International
in predominantly forested watersheds from Criş hy- Workshop on Advanced Computing and Analysis Tech-
drographic area]. PhD report. University Transilvania niques in Physics Research (April 23–27, 2007), Am-
Braşov, 67 p. sterdam.
Davidescu Ş.O. et al., 2011. Comportarea în exploatare Martin-Vide J.P., Andreatta A., 2009. Channel degrada-
a diverselor tipuri de lucrări hidrotehnice utilizate în tion and slope adjustment in steep streams controlled
amenajarea bazinelor hidrografice torenţiale din Româ- through bed sills. Earth Surface Processes and Land-
nia [In service behaviour of various types of torrent- forms 34(1): 38-47.
control structures used for watershed management. Mircea S., Vasilescu C., Mircea A., 1992. Observaţii asu-
Final Report I.C.A.S. 165 p. pra modului de comportare a lucrărilor hidrotehnice
FAO, 2004. Twenty–fourth session of the Working Party transversale executate pe formaţiunile torenţiale din
on the Management of Mountain Watersheds, Final b.h. Olăneşti [Comments on the behaviour of hydro-
142Davidescu et al. An evaluating methodology for hydrotechnical torrent-control ...
technical transverse works made on torrential forma- cinov (B.H. Argeş) [Research regarding the scientific base
tions from Olăneşti catchment]. Buletin Ştiinţific, Seria for torrent control in the upper Cârcinov catchment (Argeş
E, (34) U.S.A. Bucharest. Watershed)]. PhD thesis, University Transilvania Braşov,
Tudose N.C., 2011. Cercetări privind fundamentarea 271 p.
amenajării torenţilor din bazinul superior al râului Câr-
143Davidescu et al. An evaluating methodology for hydrotechnical torrent-control ...
144You can also read