Designing Crossing Islands for Speed Control and Intersection Safety on Two-Lane Collectors and Arterials
←
→
Page content transcription
If your browser does not render page correctly, please read the page content below
Research Article

                                                                                                        Transportation Research Record
                                                                                                        1–12
                                                                                                        Ó National Academy of Sciences:
Designing Crossing Islands for Speed                                                                    Transportation Research Board 2021
                                                                                                        Article reuse guidelines:
Control and Intersection Safety on                                                                      sagepub.com/journals-permissions
                                                                                                        DOI: 10.1177/03611981211004978

Two-Lane Collectors and Arterials                                                                       journals.sagepub.com/home/trr

Peter G. Furth1, Milad Tahmasebi1, Sepehr (Steve) Shekari2, Jay Jackson3,
Zhao (Howie) Sha4, and Yousef Alsharif1

Abstract
Crossing islands at unsignalized intersections, in addition to their pedestrian crossing safety benefits, can also serve as speed
control chicanes by forcing vehicles to make a reverse curve. A method is developed for determining the chicane length (and
thus, parking setback) needed for a two-lane road for a given lane width, island width, and target speed, based on models of
the relationship between road geometry vehicle path radius, and speed. New data on the speed–radius relationship is pre-
sented. The concept of ‘‘informal flare’’ is also introduced; it is a common approach geometry that allows a left-turning vehi-
cle to wait for a gap in opposing traffic without blocking through traffic behind it. Using informal flares can make it possible to
prevent left-turn blockage without sacrificing a crossing island for a left-turn lane. Curb continuation lines at median openings
are presented as a means to enhance informal flare function. Original data are presented relating informal flare function (the
tendency of through vehicles to bypass a waiting left-turner) to a road’s half-width. Geometric analysis shows that intersec-
tions with crossing islands can fit on roads with right of way as narrow as 60 ft, and with curb-to-curb width as narrow as
40 ft, while still accommodating turning school buses and bike facilities and preventing left-turn blockage. Various perfor-
mance measures are used to evaluate intersection geometry, including measures related to through vehicle speed, turning
vehicles, and pedestrians. With crossing islands, pedestrian safety with respect to left-turning vehicles is substantially
improved as the turning path becomes square to the crosswalks, making the vehicle path more predictable and reducing vehi-
cle speed, conflict area size, and pedestrian exposure distance.

On arterial and collector roads, speed control is widely           compliance at crosswalks. Bertulis and Dulaski (1) found
recognized as vital for safety and livability. However, it         that on streets whose 85th percentile speed was in the
remains a persistent challenge because such roads are              range 20–23 mph, the yielding compliance rate for staged
not amenable to speed humps and similar traffic calming            crossings was 70%, versus only 41% on streets whose
devices because of their function as through roads, emer-          85th percentile speed was 29 or 30 mph.
gency response routes, and (often) transit routes.                    Apart from speed control, crossing islands are also a
    On roads with one through lane per direction, installing       powerful tool for making crossings safer by making them
median islands that force traffic to swerve to the outside         shorter, simpler, and more conspicuous. One crosses a
and then back again to the inside can be a way to control          single direction at a time, and, on a road with one lane
speed. Treatments that create this kind of horizontal deflec-      per direction, only one lane at a time. This makes cross-
tion are called chicanes, a term borrowed from racing.             ings more accessible to children and to slower pedes-
While speed control islands can be installed anywhere along        trians. Their conspicuity promotes motorist yielding.
a road, there is a strong safety advantage to locating them
at intersections, where they can also function as crossing         1
                                                                    Department of Civil and Environmental Engineering, Northeastern
islands, also called pedestrian refuge islands. This study is      University, Boston, MA
limited to roads with one through lane per direction because       2
                                                                    Environmental Partners, Quincy, MA
                                                                   3
on multilane roads, any horizontal deflection strong enough         Massachusetts Bay Transportation Authority, Boston, MA
                                                                   4
                                                                    HDR, Inc., Dallas, TX
to limit speed would create a high sideswipe risk.
    Limiting speed is critical not only for lowering crash         Corresponding Author:
risk and severity, but also for engendering yielding               Peter G. Furth, p.furth@northeastern.edu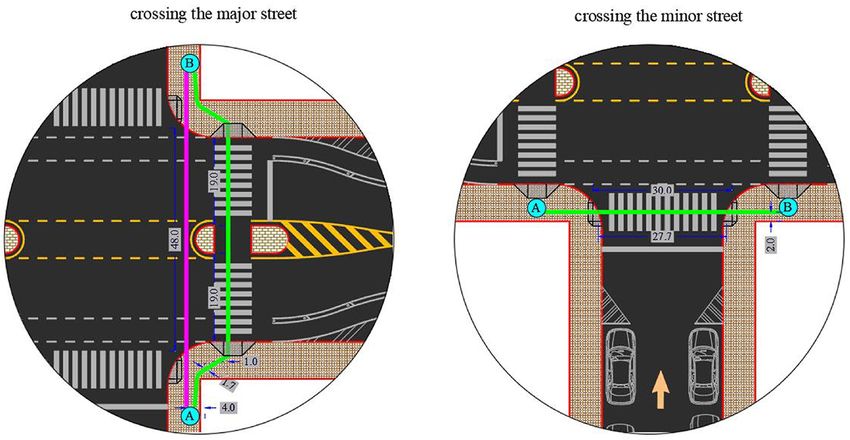
2                                                                                        Transportation Research Record 00(0)

Crossing islands also prevent cars from making wide,
sweeping left turns, a danger that has been highlighted in
a recent New York City safety study that prompted a
strategy of ‘‘hardening the centerline’’ (2). A review of
several before-after studies has assigned crossing islands
a crash modification factor of 0.68, meaning that they
are expected to reduce the number of crashes by 32% (3).
    In European countries, including Germany and the
Netherlands, crossing islands are extensively used on
two-lane arterial and collector roads at unsignalized
intersections. American guidance has promoted their use
at roundabouts and on multilane roads, but has been
oddly silent as to whether they might be of benefit on
two-lane roads (4).
    Several reasons can be suggested for the relative pau-
city of crossing islands on two-lane roads in the U.S.A.
compared with Europe. One is that the U.S.A. has his-
                                                               Figure 1. Geometry of a crossing island chicane.
torically had weaker standards of pedestrian crossing
safety. In both Germany and the Netherlands, an
                                                               includes an account of an experiment measuring vehicle
unsignalized crossing may not span more than two               speed versus vehicle path radius at a crossing island chi-
through lanes. (In effect, that caps road width in built-up    cane. The second section introduces the concept of infor-
areas to four lanes, with a median island, unless the road     mal flare, meaning providing left-turn lane functionality
has traffic signals at every crossing.) In the U.S.A., there   without marking an auxiliary lane. It also describes curb
is no such limit; unsignalized crosswalks that span four       continuation lines at median breaks as a treatment for
lanes and more are common. Some European cities,               increasing the effectiveness of informal flares. The third
including Delft, go still further, making it a policy that     section aims to test the feasibility of fitting crossing
no unsignalized crosswalk may span more than one               island chicanes into the limited ROW of an intersection
marked lane—a policy that effectively mandates crossing        between a narrow collector road and a local street while
islands at all unsignalized intersections except those         still accommodating large turning vehicles, left turns
between local streets, which typically have no marked          (without blocking through traffic), and bicycles.
lanes. A second reason is that it is often hard to find the
space to widen a road at an intersection. In the U.S.A.,
unlike in Europe, it is not common to have extra right of      Crossing Island Chicane Geometry and
way (ROW) at intersections. Another practical obstacle         Speed Control
is that installing crossing islands can involve losing park-
ing spaces. This may be a reason they are less popular as      As shown in Figure 1, the path of a vehicle that shifts its
                                                               lateral position when negotiating a crossing island can be
an intersection safety treatment than corner bulbouts,
                                                               modeled as a pair of equal radius, opposite direction
which make crossings shorter, but have nowhere near
                                                               curves with combined lateral offset F and combined
the same safety impact as crossing islands.
                                                               length (measured along the road’s axis) L. It is reason-
    A final practical barrier to implementing crossing
                                                               able to assume equal radii because the lateral force felt
islands is the need for a left-turn lane or its functional
                                                               by the driver is inversely proportional to the radius, and
equivalent, so that a car waiting to turn left will not
                                                               for a given L and F, a driver minimizes the maximum
block through traffic. This functionality is especially
                                                               force felt by equalizing the radii of the two curves. If the
important in road diet projects, which restrict traffic that
                                                               internal angle for each curve is I, the coordinates of the
formerly used two lanes per direction to a single lane per
                                                               curve reversal point can be expressed as
direction. Because of this need, the standard form of a
road diet has a pair of through lanes plus a center turn-                                               L
ing lane which becomes a left-turn lane at intersections—                            x = R sinð I Þ =
                                                                                                        2
consuming space that might otherwise have been used
for a crossing island.                                                                                      F
                                                                                  y = R½1  cosðI Þ =
    Three main sections follow, corresponding to this                                                       2
paper’s three objectives. The first develops a method for         Then using the trigonometric identity sin2 I + cos2
designing crossing island chicanes for speed control           I = 1, radius of curvature R can be inferred as a func-
based on the geometry and physics of reverse curves. It        tion of F and L: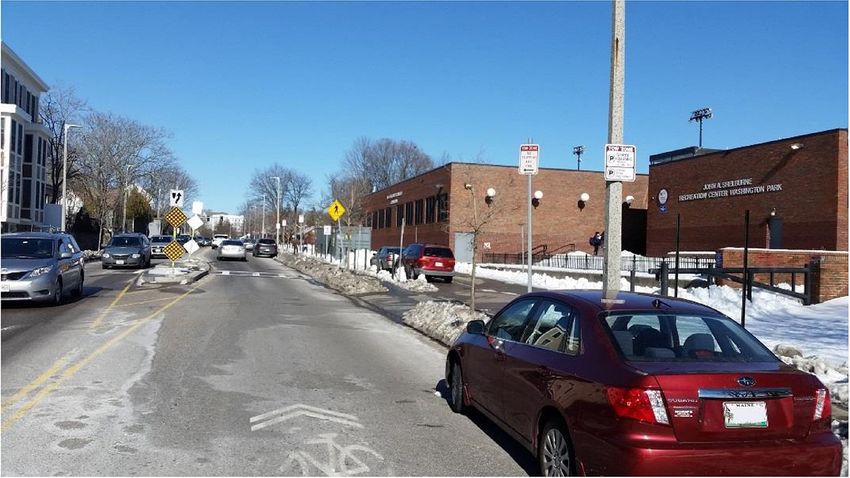
Furth et al                                                                                                             3

                           F 2 + L2                              IslEnc = distance that the crossing island encroaches
                      R=                               ð1Þ
                              4F                              into the approach lane; for a symmetric road, IslEnc =
                                                              Wisl/2
   Radius of curvature is important because the lateral
                                                                 The vehicle path offset is then given by
acceleration of the car, from basic physics, is
                                                                                F = IslEnc + Fisl  Fo                ð3Þ
                            v2
                         a=
                            R                                     In the field test described below, it was observed that
where                                                         drivers approaching next to a parking lane center their
   v = car speed                                              vehicles roughly between the centerline and a line 9 ft
   a = lateral acceleration.                                  from the curb, and that at the crossing island, drivers
   The lateral force needed to keep the car on track,         position the edge of their car about 3 ft from the edge of
transmitted from the road surface via the tires, is this      the island. This latter finding differs from the standard
acceleration multiplied by the car’s mass, and is generally   assumption in roundabout fastest path analysis that the
expressed as the product mfg, where                           center of a vehicle can come within 5 ft of a curb, mean-
   m = mass of the car                                        ing, for a car 6 ft wide, a 2 ft offset from the edge of the
   g = acceleration from gravity = 32.2 ft/s2                 island; part of the reason for the difference is that the
   f = side friction factor                                   present analysis models average vehicle speed at a chi-
   Therefore, speed and side friction are related by the      cane, not the theoretically fastest vehicle. Assuming a car
equation                                                      width of 6 ft, then,

                                                                                            H 9
                              v2                                                     Fo =                             ð4Þ
                         f=                            ð2Þ                                    2
                              Rg
                                                                                        Fisl = 6                      ð5Þ
A road’s cross-slope or superelevation, an important fac-
tor in highway curve design, is ignored in this analysis      where H = road half-width (curb to centerline). For a
because cross-slope will be favorable for half of the S-      symmetric layout with parking on the approach road-
curve and unfavorable for the other half, canceling its       way, F can be restated with regard to direct road
effect.                                                       geometry:
   Drivers experience the same lateral forces as their car.
Lateral forces to keep them from sliding across their seat                                   H  Wisl
                                                                                F = 10:5                             ð6Þ
are transmitted via the seat as well as by holding the                                          2
steering wheel—however, the latter is tricky because
drivers are also using the steering wheel to control the      In Equation 6, it should be noted that H2Wisl is the
car. Driver comfort—including feeling that one still has      road’s half-width minus the island’s full width, and there-
control of the car—is what limits the side friction drivers   fore does not correspond to any directly observable
are willing to experience. It is well known that the limit-   width.
ing side friction factor varies with speed (5); at lower
speeds, drivers are willing to experience greater lateral
forces.
                                                              Field Test of Speed Versus Chicane Geometry
   The offset of the vehicle path depends partly on the       A field test was conducted on March 17, 2017, at a mid-
chicane geometry, but also partly on driver choices as to     block crossing island at 2730 Washington Street in
initial and final lateral position. Minimizing lateral        Boston’s Roxbury neighborhood, on the northbound
forces, which is the same as finding the fastest path,        side of the road (see Figure 2). The test was conducted in
means minimizing F by beginning close to the parking          the early afternoon under clear weather and with dry
lane and ending close to the island, as in fastest path       pavement. The road width is 40 ft and the island width is
analysis done for roundabouts (6, 7). Of course, drivers      9.2 ft. From snowplowing operations in a past storm,
also have competing concerns about hitting a parked car       there was an icy snowbank along the curb extending
and hitting the island. Initial and final lateral position    about 1.5 ft into the road, effectively reducing the road
can be expressed as offsets from the center of the vehicle    half-width.
to the centerline and to the edge of the island:                 The parking lane along the entire block was empty
   Fo = initial vehicle offset from the centerline            except for cars parked by the experimenters, one
   Fisl = vehicle offset from center of vehicle to the edge   upstream of the island and one downstream, at the limit
of the island                                                 of the No Parking zone, resulting in L = 63.5 ft on both
   Wisl = island width                                        sides of the island. The speed of passing cars was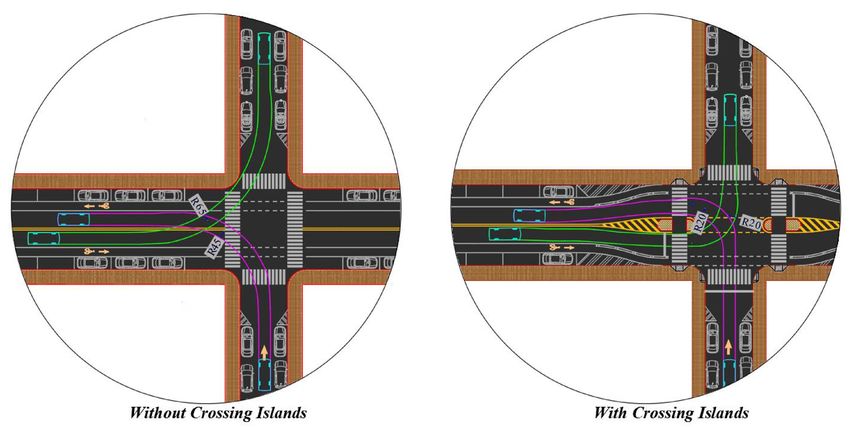
4                                                                                             Transportation Research Record 00(0)

measured as they passed the island using a radar gun
operated from the downstream parked car.
   Three different chicane geometries were tested by
adjusting the lateral position of the parked cars. In the
‘‘no chicane’’ case, the parked cars were removed, allow-
ing cars to pass with virtually no lateral shift. In the
‘‘mild chicane’’ case, the cars were parked immediately at
the curb (which required shoveling into the snowbank),
reaching 5.5 from the curb. In the ‘‘severe chicane’’ case,
the cars were parked about 1 ft from the snowbank,
reaching 8 ft from the curb.
   Speeds were measured for 51–72 cars per scenario.
Only cars with no vehicle less than 5 s ahead of them were
measured. Results, summarized in Table 1, indicate that          Figure 2. Experiment site.
compared with the no chicane case, mean speed and 85th
percentile speed both declined 2 mph with the mild chi-
cane and another 2 mph with the severe chicane. Radius           Table 1. Speed versus Chicane Geometry Test Results
of curvature was calculated from the road geometry and
                                                                                                     No         Light      Severe
previously stated assumptions about vehicle position.
                                                                                                   chicane     chicane     chicane
Side friction factor, calculated using Equation 2, was
found to be greater in the scenario with lower speeds,           Fo (ft)                                na          6.5      5.25
consistent with other studies of side friction.                  F (ft)                                 na          4.1      5.35
                                                                 R (ft)                                 na         247        190
                                                                 Mean speed (mph)                     29.2        27.3       25.2
Relationship of Speed to Side Friction Factor and Vehicle Path   85th percentile speed (mph)           33           31         29
Radius. Observations of speed and inferred side friction         Sample size                           51           61         72
factor from this study as well as several past studies are       Calculated f                           na       0.202      0.223
shown in Figure 3, which is reproduced from the
                                                                 Note: na = not applicable.
AASHTO Green Book (3) with the two data points used
in this test added. One can see that this data is consistent
with that of other studies. A simplified, linear relation-       basis for designing a crossing island chicane: choose a
ship between speed and side friction factor was estimated        target speed, determine the vehicle path radius R needed,
from the two data points; one can see that it closely            and then tailor the parameters of the chicane—the width
matches the fitted curve in the Green Book for speeds in         of crossing island, which will determine F, and the park-
the range of 15–30 mph, speeds one would expect for              ing setback, which will determine L—to achieve that
crossing island chicanes. This relationship is                   value of R, using Equations 1 and 6 (or, for more general
                                                                 assumptions on driving initial and final positioning, sub-
      f = 0:475  0:01Speed for Speed\30 MPH             ð7Þ    stitute Equation 3 for 6).
                                                                     For the assumptions embodied in Equation 6, the
with speed in units of mph.
                                                                 design process can be further simplified using Figure 5,
                                                                 which shows the relationship between target speed, chi-
Chicane Design to Achieve a Target Speed                         cane length, and the quantity (H2Wisl). Usually H is
                                                                 known, and there are usually only a few practical choices
Combining Equations 2 and 7, one can determine the
                                                                 for Wisl; a designer can then use Figure 5 to read the chi-
vehicle path radius R needed to achieve a target speed at
                                                                 cane length needed for a selected target mean speed. For
a chicane. That relationship is plotted in Figure 4, with
                                                                 example, suppose approach half-width is 20 ft and one is
curves for the same relationship found in the NCHRP
                                                                 considering an island 6 ft wide. Then, to achieve a target
roundabout design guide shown for comparison (6). The
                                                                 mean speed at the island of 22.5 ft/s, the needed length of
curves from the roundabout design guide use the speed–
                                                                 the chicane—that is, the distance from where the parking
friction factor relationship given in the AASHTO Green
                                                                 lane ends to the island—should be 43 ft.
Book (5) rather than the linear simplification used for the
present curve; they also assume a contribution to lateral
force from superelevation, e, at values of 6 2%. Overall,        Comparison with Other Methods of Chicane Design. These
there is little difference between the curves.                   results can be compared with existing guidance for chi-
    This curvature–speed relationship, together with             cane design. Guidance developed in Denmark in the late
accounting for drivers’ fastest path tendencies, forms the       1980s was based on a laboratory test in which a chicane’s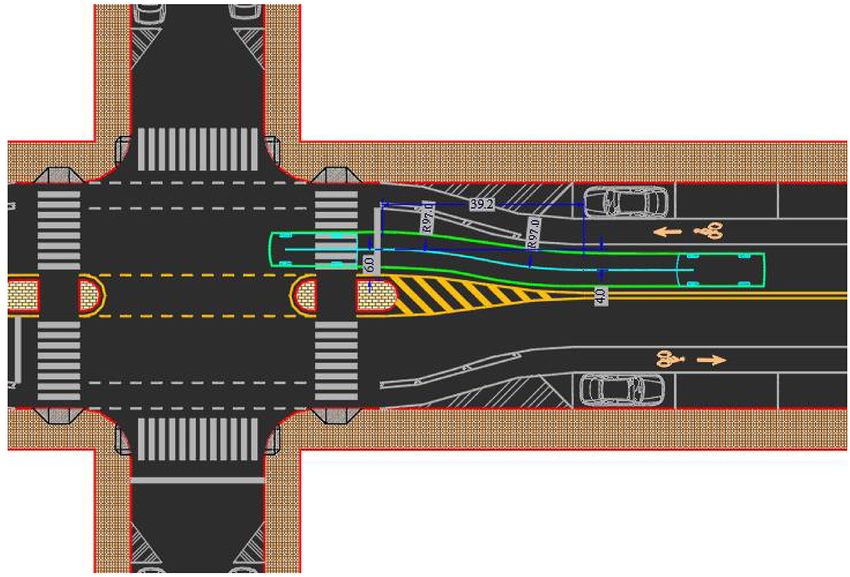
Furth et al                                                                                                                                      5

                                                                            Figure 4. Vehicle path radius needed to achieve a target speed at
                                                                            a chicane.
                                                                            Source for the two curves with dashed lines: NCHRP Report 672 (6).

Figure 3. Side friction factor versus speed.
Source: Reproduced from Zegeer et al. (3) with data points and trend line
from this study added.

dimensions were adjusted until a driver could just get
through at a specified speed (8). To restate those specifi-
cations for chicane length and offset, in this study, it was
assumed that a car 5 ft wide (typical for European cars
of that era) enters the chicane 2 ft from right lane edge
and departs 2 ft from the left lane edge, with the 2-ft off-
set assumed because the experiment used a single driver
instructed to drive though as fast as practical. The
Danish guidance is plotted in Figure 6 with correspond-                     Figure 5. Chicane length needed to achieve a target speed for a
ing curves based on the theory presented in this paper                      given approach half-width H and island width Wisl.
shown for comparison. One can see that the proposed
method shows a considerably greater sensitivity of speed
to chicane length, and that, compared to the Danish
method, it calls for longer chicanes for a 25 mph (40 km/h)
target speed and shorter chicanes for target speeds of
18.75 mph (20 km/h) and lower.
   The MUTCD specifies the minimum length over which
a lateral shift of a lane takes place, also called a taper, in
construction zones. For speeds up to 40 mph, it is given by

                           FS 2
                    L=          for S\40 mph                          ð8Þ
                           120
where L = taper length (ft), F = offset (ft), and S =
speed (mph). If used for chicane design, this formula calls                 Figure 6. Chicane length (L) versus path offset (F) for different
for chicane lengths only about half as long as the reverse                  target speeds: Danish method from Kjemptrup, K. (7) (solid lines)
curve method presented in this paper. This confirms that                    and proposed method (dashed lines).
the reverse curve method prescribes a path that cars can
follow safely.
   In the UK, the Transportation Research Laboratory                        formula. However, the field data does not match the
has also studied the relationship between chicane design                    fitted relationship well, perhaps because the study does
and speed (9). There, chicane geometry was reduced to a                     not account for how fastest path tendencies can make a
single parameter—path angle—which implies a constant                        vehicle path’s taper angle differ considerably from the
ratio F/L for a given speed, consistent with the shift taper                road’s taper angle.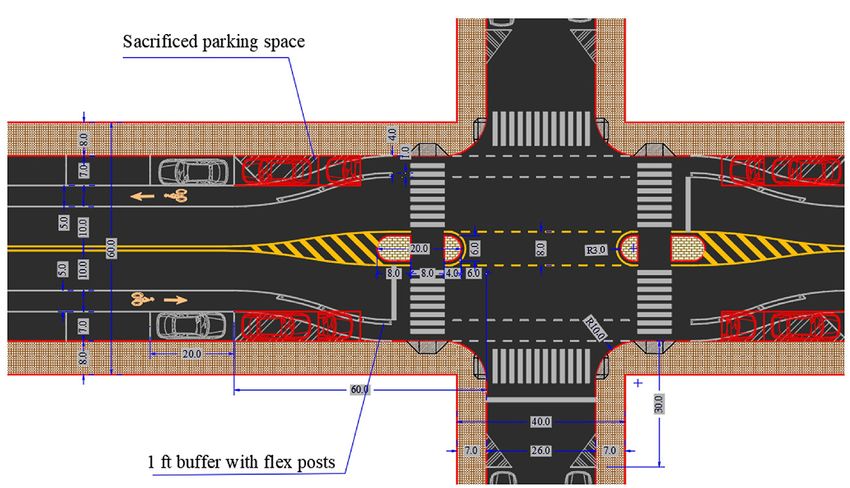
6                                                                                                      Transportation Research Record 00(0)

Table 2. Tendency for Through Cars to Pass by a Car Waiting to Turn Left at Informal Flares

                             Half-road
Approach                     width (ft)                               Approach description                                n       % Passing

Rt 138 NB at Neponset            21          18 ft travel lane and 3 ft shoulder. Top of a T-junction, unsignalized.      62         95
 Valley Pkwy, Milton
Faneuil St EB at                 18          Parking allowed but unoccupied. Top of a T-junction, unsignalized.          100         87
 Brooks St, Boston
Heath St WB at                   17          Parking occupied 15 ft from stop line. Top of a T-junction, signalized.     135         87
 Shiller, Boston
Parker St SB at                  17          Parking occupied 20 ft from stop line. Four-leg crossroads, signalized.      51         75
 Ruggles, Boston

Note: NB = northbound; EB = eastbound; WB = westbound; SB = southbound.

    The authors were able to find only one set of speed                       This informal flare concept was first developed and
measurements involving median island chicanes on two-                     analyzed by the study team in conjunction with a project
lane roads in the U.S.A., for N 68th Street south of Shea                 that proposed replacing formal turn lanes with informal
Boulevard in Scottsdale, Arizona. Speed was measured                      flares to create space for bike lanes; the study includes a
between two median island chicanes that are 330 ft apart.                 simulation video illustrating informal flare function (10).
After installation, mean speed between the two islands                    It also turns out that informal flares are crucial in designs
fell from 29.7 mph to 26.6 mph northbound, and from                       involving crossing islands, because intersections often
29.4 mph to 26.0 mph southbound. The proposed method                      have space for left-turn lanes or crossing islands, but not
estimates speed at the chicane heading northbound and                     both; and where it is important to prevent left-turning
southbound to be 20.3 mph and 17.8 mph, respectively,                     cars from backing up through traffic—as is often the case
which is roughly 7.3 mph slower than observed mean                        on road diet projects—auxiliary left-turn lanes are often
speeds. Part of the discrepancy is because speed was mea-                 chosen instead of crossing islands, to the detriment of
sured midway between chicanes, while the proposed                         crossing safety, without considering that it might be pos-
method predicts speed at the chicane. Another likely rea-                 sible to have the functionality of both, using an informal
son is that these islands have flush curbs, which likely                  flare.
leads to smaller vehicle-curb offsets and therefore a larger                  To examine the relationship between informal flare
path radius than predicted using offsets determined by                    functionality and half-road width, field measurements
Equations 3 and 4.                                                        were made at four sites in the Boston area with informal
                                                                          flares. Half-road width ranged from 17 ft to 21 ft
                                                                          (Table 2). At the first and third listed sites, the road
Informal Flares                                                           authority had already put in place treatments to facilitate
                                                                          informal flare function—at the first, the travel lane was
On roads with one lane per direction, a car waiting to                    flared from 12 ft to 18 ft (by shrinking the shoulder from
turn left at an intersection will block the through lane                  9 ft to 3 ft), and at the third, a No Parking restriction
unless there is a way for through traffic to get by. While                was in place to keep the parking lane clear for through
this functionality can be provided by adding an auxiliary                 vehicles to use. The unit of observation was a through
lane—a treatment called a flare—it can also be provided                   vehicle which, approaching the intersection, faced a vehi-
without marking an auxiliary lane if the approach road-                   cle queued to turn left ahead of it, and faced no other
way is wide enough, a treatment we call an ‘‘informal                     obstruction; the question was what fraction of those
flare.’’ Informal flares are extremely common. For exam-                  vehicles passed through without waiting for the left-
ple, through traffic will typically use a parking lane, bike              turning vehicle to clear.
lane, or shoulder, if available, to bypass a waiting left-                    Results shown in the table indicate a strong though
turner. When analyzing intersection capacity on such an                   less than 100% tendency for vehicles to pass without
approach, traffic engineers have long known to model it                   waiting for the left-turning vehicle to clear. The flare
as if there was an auxiliary left-turn lane, because other-               function is strongest with the wider roadway, as one
wise standard capacity analysis methods will assume that                  would expect. Even down to a half-road width of 17 ft,
every left-turning vehicle blocks the approach.                           there is still a strong flare function. On the first three
Nevertheless, to the authors’ knowledge, this configura-                  approaches, the tendency to pass was near 100% for
tion or functionality has not previously been named or                    vehicles arriving more than 5 s after the left-turning vehi-
analyzed.                                                                 cle; with a time lag that long, drivers had time to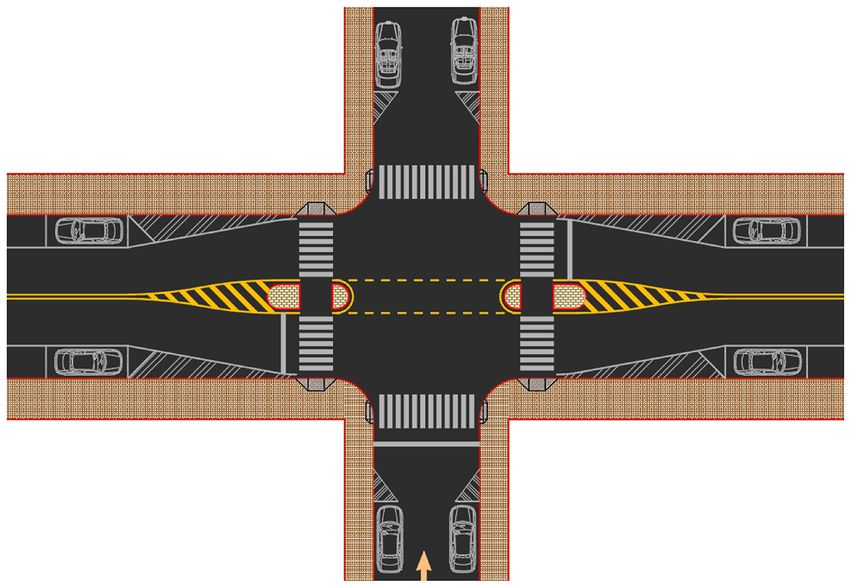
Furth et al 7
recognize the situation and smoothly swerve around the
waiting cars. Through cars that immediately followed a
left-turning car, on the other hand, were often stuck
behind it when it stopped to wait for a gap in opposing
traffic; some then swerved around the waiting car, while
others waited until it cleared.
Based on these results, an informal flare with at least
18 ft width will prevent most left-turning vehicles from
creating a bottleneck at unsignalized intersections, and
therefore avoids any lasting effect on traffic capacity.
Where turning cars enter a median opening and queue
with an oblique heading, informal flare functionality can
be inferred if there is a 10 ft wide ‘‘gate’’ between the rear
right corner of the queued car and the nearest obstruc- Figure 7. Road diet plan for Tremont Street, with bike lanes and
parking restrictions at the corner bulbouts contributing to
tion (e.g., a corner curb) on the right.
informal flares.
An example of using an informal flare as part of a
road diet is shown in Figure 7, a proposed striping plan
for a road diet on Tremont Street in Boston. Because of
drawn through median openings, as pictured in Figure 8.
two recent deaths at pedestrian crossings, it was highly
This striping, commonly used on Florida highways and
desirable to provide both a road diet and crossing
on Dutch streets, may facilitate drivers advancing deeper
islands; at the same time, because a road diet would con-
into a median opening by providing a visible boundary
fine traffic to a single lane in each direction, it was
of the travel lane. Geometric analysis of different posi-
important to prevent left-turning cars from blocking
tions where a left-turning car may stop indicates that for
through traffic. Bike lanes and parking restrictions at the
every foot a queued car extends deeper into a median
corner bulbouts provide the space needed for informal
break, an additional 0.3–0.4 ft becomes available for
flare function.
through traffic to bypass the left-turning car (11).
It is worth noting that while corner bulbouts—a
device that shortens pedestrian crossings and lowers
speed for right turns—are part of the proposed design
Feasibility of Fitting Crossing Island
for the 60 ft wide road shown in Figure 7, on narrower
roads it may not be possible for intersections to have Chicanes into U.S. Intersections
corner bulbouts as well as crossing islands. Given a On narrow collector and minor arterial streets that are
choice, crossing islands are clearly superior for pedes- common in older cities, is there sufficient space to pro-
trian safety and, unlike corner bulbouts, also contribute vide crossing islands that provide speed control through
to safety by helping limit the speed of through traffic a chicane effect? This section describes a geometric study
and left-turning traffic. of the feasibility of fitting crossing island chicanes into
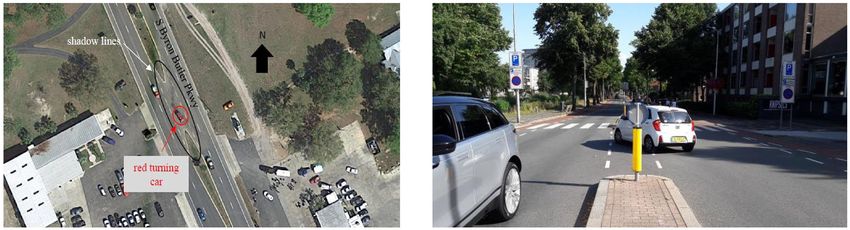
A device that may improve informal flare function is the intersection of a two-lane collector road and local
curb continuation lines, also called ‘‘shadow lines,’’ street of limited width. The research questions were
Figure 8. Curb continuation lanes through median openings, Perry, FL (left) and Delft, NL.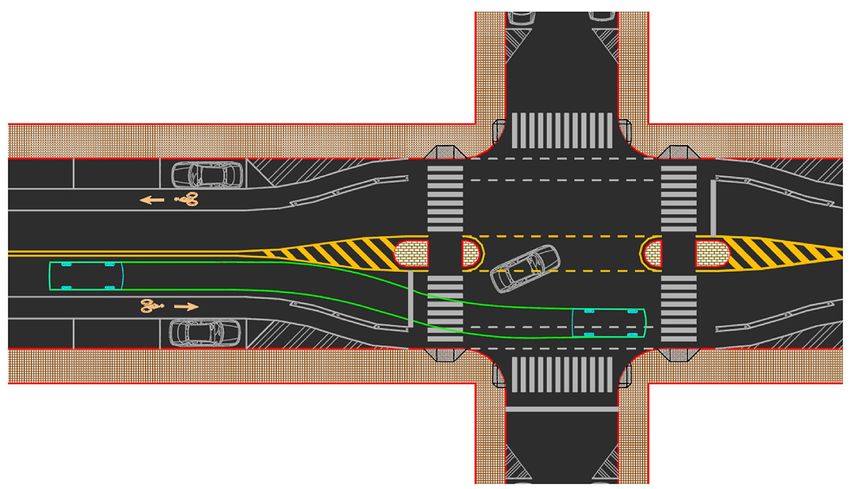
8                                                                                             Transportation Research Record 00(0)

whether crossing islands in such a context would still
accommodate large turning vehicles and allow through
vehicles to bypass a queued left-turner, how great a park-
ing loss they would involve, and how the intersection
would perform on other dimensions of safety and user
convenience.
    The through street was assumed to have a 60 ft ROW
and either 10 ft sidewalks, leaving 40 ft curb-to-curb, or
8 ft sidewalks, leaving 44 ft curb-to-curb, with a travel
lane and a parking lane in each direction, like many collec-
tors in pre-1920 neighborhoods in the Boston area.
Collectors whose paved width is 40 ft usually have no bike
facilities; those with 44 ft of pavement typically have bike
lanes. A third scenario assumes a 44 ft paved width, a sin-     Figure 9. Plan with 44 ft roadway and bike lanes.
gle parking lane, and a pair of unidirectional cycle tracks     Note: Dimensions are in ft.
(protected bike lanes). The local street was assumed to
have a 40 ft ROW and 7 ft sidewalks, like most local streets
in the Boston area, leaving 26 ft of pavement between
curbs. Local streets of this dimension sometimes operate
two-way, but more often are one-way so that cars can
park on both sides of the street without blocking traffic.
    The large vehicle whose turns have to be accommo-
dated was taken to be AutoDesk’s S-BUS-36, a conven-
tional school bus 35.8 ft long with capacity for 65
passengers. The design passenger car is 17.06 ft long and
6.365 ft wide, which is a bit smaller than the (unrealisti-
cally large) AASHTO design passenger car which is 19 ft
long and 7 ft wide.
    To facilitate wide turns, crosswalks across the major
street—with their corresponding crossing islands—are set
back from the intersection. This makes crossing distances       Figure 10. Informal flare analysis.
shorter, but also makes the crossings out of line with the
sidewalks. To protect pedestrian convenience, designs
ensured that the heading of a through-going pedestrian              Figure 9 shows the plan for one of the scenarios, a
would not deviate by more than 45° from a straight line.        44 ft road with conventional bike lanes. The number of
    Corner radii were minimized to maximize pedestrian          parking spaces lost is 1.6 per corner, calculated at 20 ft
space in the corner, subject to the need to accommodate         per space and assuming that, regardless of layout, no
large vehicle right turns. This led to a 10 ft corner radius    parking is allowed within 30 ft of the intersecting street’s
in each scenario. To shorten the length of curb ramps,          curb line.
and thus make more of the sidewalk available as walking             The informal flare analysis is shown in Figure 10. The
path, curb reveal at the crosswalk ramps is limited to          left-turning car is positioned with its front corner 2 ft
3 in. for the major street curb and 1 in. for the minor         back of the continuation line of the median curb, along a
street curb; with the standard ratio of 1 ft of length per      left-turn trajectory. The track of a through car passes
inch rise, curb ramps are, respectively, 3 ft and 1 ft long.    behind it with ample space, though it encroaches on the
Where the sidewalk is only 7 ft wide, the 1 in. curb at the     bike crossing. This means that facing both a queued left-
minor street crossing allows the curb ramp to be direct,        turning car and a bike about to enter the intersection, a
in contrast to the commonly used apex ramp, which               through driver will have to pause for a few seconds to let
forces pedestrians into the intersection. Low curb reveals      the bike pass the pinch point.
also allow an intersection to accommodate vehicles larger           The pedestrian path analysis is shown in Figure 11.
than the design vehicle by overrunning the curbs.               Compared with the no-island scenario, maximum pedes-
    Crossing islands are 6 ft wide and 20 ft long with a cut-   trian exposure is reduced from 48 ft to 19 ft when cross-
out for the walking path, and have 4 in. curbs so that they     ing the major street, and from 30 ft to 27 ft when crossing
can be overrun by occasional large turning vehicles such        the minor street. As a result of the setback, total pedes-
as home removals vans.                                          trian path length crossing the major street increases by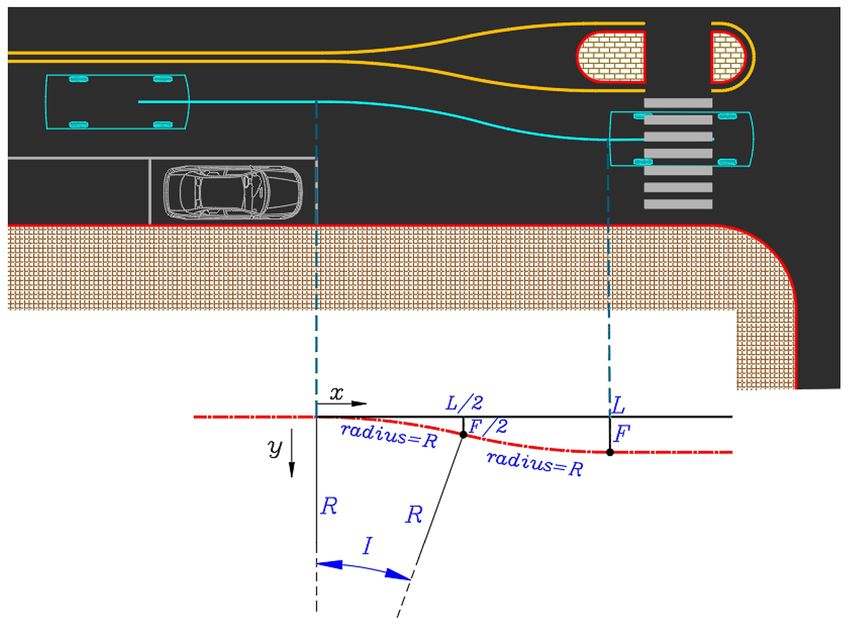
Furth et al                                                                                                              9

Figure 11. Pedestrian path analysis.

                                                                elements so that large vehicles can more easily complete
                                                                their turns.
                                                                    The analysis of left-turn threat is shown in Figure 13.
                                                                For left turns from the major street, indicated by green
                                                                lines, the fastest path turning radius is reduced from
                                                                65 ft, which a driver can negotiate at 18.5 mph (Figure 3),
                                                                to 20 ft, corresponding to a turn speed of 11 mph. In the
                                                                no-island layout, a car or truck can pass the crosswalk at
                                                                an oblique angle, creating blind spots caused by the vehi-
                                                                cle’s A-pillar, while with the island, a car passes the
                                                                crosswalk at a right angle, with ideal visibility. For cars
                                                                turning left from the minor street, indicated by purple
                                                                lines, in the no-island layout, such a car threatens pedes-
                                                                trians everywhere in a 46 ft crossing, and might choose
                                                                an unexpected path to pass a pedestrian in way that is
                                                                frightening; with an island, the turning vehicle’s path is
Figure 12. Fastest path/speed control analysis.
                                                                severely restricted, with a sharp turn that limits speeds
                                                                and that crosses the pedestrian path at a right angle,
                                                                threatening a pedestrian for only 19 ft.
7.3 ft (less than 2 s of walking time), while it is unchanged       Finally, analysis of the large vehicle turn is shown in
crossing the minor street.                                      Figure 14, showing that a conventional school bus can
    Analysis of the fastest path/speed control for through      turn left or right from either street without its wheels
traffic is shown in Figure 12. With a conventional bike         tracking over any curbs and without its body hitting the
lane and lacking any vertical separator, drivers will           flexposts that separate the bike lane on the approach leg.
encroach on the bike lane to flatten their curve, making        For the right turns, the body of the bus tracks over a bit
it impossible for a chicane to provide speed control while      of the crossing island. By limiting the height of the
also making it safe for a bike and car to operate next to       island’s curbs to 4 in. and limiting the height of the cor-
one another. Adding a few flexposts on the bike lane line       ner curbs, occasional large vehicles such as moving vans
where the parking lane ends solves this dilemma. The            can make turns by overrunning the median islands, cor-
fastest path analysis assumes a car comes within 2 ft of        ner curbs, or both.
the first flexpost and within 3 ft of the crossing island,          Plans for the other two collector cross-section scenar-
and finds the path radius to be 97 ft, which, from Figure       ios—40 ft roadway with no bike facilities and 44 ft road-
3, corresponds to a mean speed of 20 mph. For speed             way with cycle tracks and only one parking lane—are
control, it is sufficient to add flexposts on the approach      shown in Figures 15 and 16. The same set of geometric
legs only, leaving the departure legs free of vertical          analyses was conducted for those scenarios, as well as for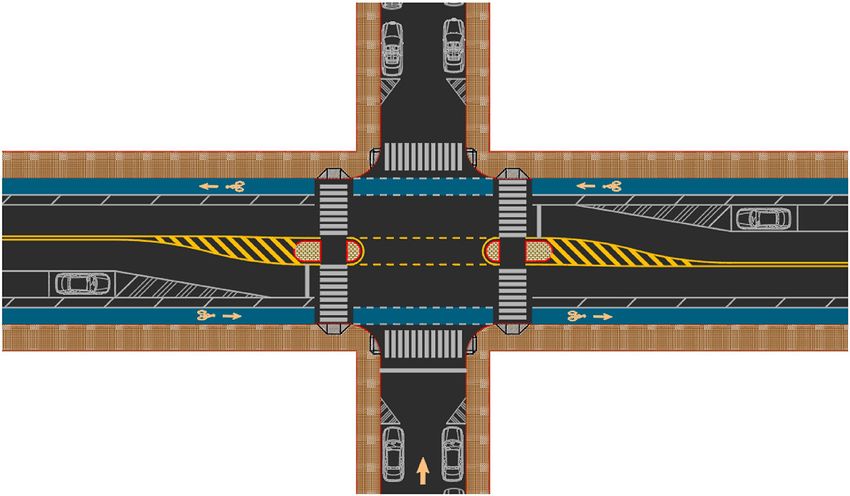
10                                                                                         Transportation Research Record 00(0)

Figure 13. Left-turn threat analysis.

Figure 14. Large vehicle turn analysis.

                                                                   a base scenario without crossing islands (12). An evalua-
                                                                   tion summary for the three scenarios is given in Table 3.
                                                                   In all three scenarios, the crossing island design accom-
                                                                   modates large vehicle turns, prevents queued left-turning
                                                                   vehicles from blocking through traffic, and allows for
                                                                   continuous bicycling facilities, while providing substan-
                                                                   tial speed control and pedestrian safety benefits.

                                                                   Conclusions
                                                                   Crossing islands at unsignalized intersections, in addition
                                                                   to their pedestrian crossing safety benefts, can also serve
                                                                   as speed control devices, at least on two-lane roads. A
                                                                   method has been developed for designing reverse curve
                                                                   chicanes on two-lane collector and minor arterial roads
Figure 15. Plan for the 40 ft roadway scenario with no bicycling   that indicates the vehicle path radius needed to achieve a
facility.                                                          target speed, the vehicle path offset that can be expected
Furth et al 11
Table 3. Evaluation Summary for the Three Collector Cross-Section Scenarios
40 ft roadway, 44 ft roadway 44 ft roadway with
Collector layout no bike lanes with bike lanes cycle tracks
Thru vehicle path radius (ft) 97 97 97
Thru vehicle average speed (predicted) at crosswalk 20 20 20
(mph)
Left turn from major street path radius: with versus 20 versus 65 20 versus 65 20 versus 55
without crossing island (ft)
Left turn from major street speed (predicted): with 11 versus 18.5 11 versus 18.5 11 versus 17.25
versus without crossing island (mph)
Pedestrian exposure crossing major street: with 17 versus 44 19 versus 48 19 versus 48
versus without crossing island (ft)
Pedestrian exposure crossing minor street: with 27.7 versus 30 27.7 versus 30 27.7 versus 30
versus without crossing island (ft)
Increase in pedestrian path length along major 5.7 7.3 7.3
street (ft)
Pedestrian path maximum deviation (heading) (°) 45 45 45
S-BUS-36 can make all right and left turns without Yes Yes Yes
overrunning curbs
Informal flare—thru cars can pass while a car waits Yes Yes Yes
to turn left
Number of omitted parking spaces per corner 1.5 1.6 2.5
Bicycle facilities None Bike lane continues Protected bike lane continues
A geometric analysis has shown that crossing islands
can fit into intersections even on roads with ROW as
narrow as 60 ft. Using set-back crossings creates space to
accommodate wide vehicle turns and reduces pedestrian
exposure and overall crossing length without forcing
undue deviation in the pedestrian path. Using informal
flares, left-turn blockage can be largely prevented without
replacing crossing islands with auxiliary left-turn lanes.
Curb continuation striping can help enhance the informal
flare functions by facilitating queued left turners to stop
deeper in the median break. Compared with intersections
without crossing islands, the threat from left-turning vehi-
cles is greatly reduced because they are forced to turn with
a sharper radius and narrowly confined path that passes
Figure 16. Plan for the 44 ft roadway with cycle tracks. the crosswalk at a right angle. On wider roads reduced
from four lanes to two by a road diet, corner bulbouts also
contribute to shorter crossings and lower turn speeds.
based on lane width and island geometry, and the result- Intersections with this kind of design, common in many
ing chicane length—and thus, parking setback—needed. European countries, have the potential to transform many
The speed–radius relationship accounts for the increased busy two-lane roads, and many four-lane roads amenable
willingness of drivers to experience lateral forces at lower to a road diet, into no longer being used as speedways and
speeds, a relationship to which this study has offered new no longer being neighborhood barriers.
data that confirms previous studies. Using crossing island Several questions raised by this study are worthy of
chicanes, a city authority can enable its busy two-lane further research. At informal flares involving a bike lane,
roads to achieve safe speed targets that previously were how do motorists and cyclists actually behave when there
unachievable because those roads were not amenable to is a conflict (both want to be in the same space at the
traffic calming devices such as speed humps, while at the same time)? Will pedestrians behave as expected (i.e., use
same time improving crossing safety and making cross- the marked crosswalk) if crosswalks are moved further
ings accessible to children and people with low walking from the center of an intersection and therefore out of
speed. line with the sidewalk? Will informal flares behave as12 Transportation Research Record 00(0)
intended, that is with through vehicles passing around at Unsignalized Crosswalks. Transportation Research
cars waiting to turn left? How does informal flare func- Record, 2014. 2464: 46–51.
tion relate to left-turn queue length, and thus indirectly 2. New York City Department of Transportation. NYC
to left-turning volume and opposing through volume? Study Don’t Cut Corners: LEFT TURN Pedestrian & Bicy-
How do vertical flexposts alter driver path choice—do clist Crash Study. New York City Department of Trans-
drivers shy further from them than from raised curbs or portation, New York, 2016.
3. Zegeer, C., C. Lyon, R. Srinivasan, B. Persaud, B. Lan, S.
less? Do curb continuation lines at median breaks actu-
Smith, D. Carter, N. J. Thirsk, J. Zegeer, E. Ferguson, and
ally induce motorists waiting to turn left to queue deeper R. van Houten. Development of Crash Modification Fac-
into the opening? Also, data from additional sites and tors for Uncontrolled Pedestrian Crossing Treatments.
with greater variety in road geometry would be desirable Transportation Research Record, 2017. 2636: 1–8.
to understand better how vehicle path and vehicle speed 4. AASHTO. Guide for the Planning, Design, and Operation
relate to road geometry at chicanes. of Pedestrian Facilities. AASHTO, Washington, D.C.,
2004.
5. AASHTO. A Policy on Geometric Design of Highways and
Author Contributions
Streets. AASHTO, Washington, D.C., 2011.
The authors confirm contribution to the paper as follows: study 6. Rodegerdts, L. A., J. Bansen, C. Tiesler, J. Knudsen, E.
conception and design: PF, MT, SS; data collection: MT, SS, Myers, M. Johnson, M. Moule, B. Persaud, C. Lyon, S.
JJ, ZS, YA, PF; analysis and interpretation of results: PF, MT, Hallmark, H. Isebrands, R. B. Crown, B. Guichet, and A.
SS, JJ, ZS, YA, PF; draft manuscript preparation: PF, MT, SS, O’Brien. Roundabouts: An Informational Guide, 2nd ed.
JJ, YA. All authors reviewed the results and approved the final NCHRP report 672. TRB, Washington, D.C., 2010.
version of the manuscript. 7. Ahac, S., T. Džambas, and V. Dragčević. Review of Fast-
est Path Procedures for Single-Lane Roundabouts. Proc.,
Declaration of Conflicting Interests 4th International Conference on Road and Rail Infrastruc-
ture, Šibenik, Croatia, 2016.
The author(s) declared no potential conflicts of interest with 8. Kjemptrup, K. Speed Reducing Measures. Danish Secre-
respect to the research, authorship, and/or publication of this tariate of Road Standards, Denmark, 1988.
article. 9. Sayer, I. A., D. I. Parry, and J. K. Barker. Traffic Calm-
ing: An Assessment of Selected On-Road Chicane Schemes.
Funding Report 313. Transportation Research Laboratory, 1998.
10. Furth, P. G., Z. H. Sha, and S. Rauwolf. Bike Lanes for
The author(s) disclosed receipt of the following financial sup-
Longwood Avenue (Video). https://www.youtube.com/
port for the research, authorship, and/or publication of this
watch?v=rzqrHcMTliw&t=211s.
article: The Helen and William Mazer Foundation provided
11. Shekari, S. Design Treatments for Increasing Traffic Capac-
partial support for this research.
ity in Road Diet Projects. MS thesis, Northeastern Univer-
sity, Boston, MA, 2019.
References 12. Furth, P. G. and M. Tahmasebi. Safer Intersection Design
Using Crossing Islands. http://www.northeastern.edu/
1. Bertulis, T., and D. M. Dulaski. Driver Approach Speed
peter.furth/safer-intersection-design-using-crossing-islands/.
and Its Impact on Driver Yielding to Pedestrian BehaviorYou can also read