Resilient Intersection Management With Multi-Vehicle Collision Avoidance
←
→
Page content transcription
If your browser does not render page correctly, please read the page content below
ORIGINAL RESEARCH
                                                                                                                                               published: 03 June 2021
                                                                                                                                        doi: 10.3389/frsc.2021.670454

                                              Resilient Intersection Management
                                              With Multi-Vehicle Collision
                                              Avoidance
                                              Phuriwat Worrawichaipat*, Enrico Gerding, Ioannis Kaparias and Sarvapali Ramchurn

                                              Faculty of Engineering and Physical Sciences, University of Southampton, Southampton, United Kingdom

                                              In this paper, we propose a novel decentralised agent-based mechanism for road
                                              intersection management for connected autonomous vehicles. In our work we focus
                                              on road obstructions causing major traffic delays. In doing so, we propose the
                                              first decentralised mechanism able to maximise the overall vehicle throughput at
                                              intersections in the presence of obstructions. The distributed algorithm transfers most
                                              of the computational cost from the intersection manager to the driving agents, thereby
                                              improving scalability. Our realistic empirical experiments using SUMO show that, when
                                              an obstacle is located at the entrance or in the middle of the intersection, existing state
                                              of the art algorithms and traffic lights show a reduced throughput of 65–90% from the
                                              optimal point without obstructions while our mechanism can maintain the throughput up
                            Edited by:
                                              to 94–99%.
                Emanuele Crisostomi,
                University of Pisa, Italy     Keywords: transportation, multi-agent, simulation - computers, intersection management, computer science
                       Reviewed by:
               Zafeiris Kokkinogenis,
 Centro Para a Excelência e Inovaçáo          1. INTRODUCTION
    na Indústria Automóvel, Portugal
                             Bo Yang,         Traffic congestion is one of the key factors of air pollution, causing losses in economic efficiency,
       The University of Tokyo, Japan         as well as having wider impacts on health and climate change (May, 2013). For example, in the US
                  *Correspondence:            alone, congestion is estimated to cost around US$305B (Schneider, 2018). A key contributing factor
              Phuriwat Worrawichaipat         to congestion in urban road networks is the poor management of intersections using standard
                 pw1r19@soton.ac.uk           traffic lights. Despite a number of recent advances in traffic lights management, they rarely consider
                                              traffic in dynamic situations, e.g., accidents or road constructions, which are common occurrences.
                  Specialty section:          These situations interrupt the flow, causing a congestion surge at the intersection level or even at
        This article was submitted to
                                              the network level. Ignoring these real-world issues can put people’s lives at risk and increase the
   Urban Transportation Systems and
                             Mobility,
                                              cost of transportation.
              a section of the journal            At the same time, the increasing adoption of Connected Autonomous Vehicles (CAVs)1 presents
       Frontiers in Sustainable Cities        an opportunity to make a step change from the status quo. Indeed, according to KPMG, 25%
         Received: 21 February 2021
                                              of the vehicles on the road will be fully autonomous by 2030 (KPMG, 2015). It is thus not
            Accepted: 10 May 2021             difficult to imagine a future where nearly all vehicles will be fully autonomous. Moreover, work
           Published: 03 June 2021            in the Artificial Intelligence (AI) community has sought to address the problem of intersection
                              Citation:
                                              management with CAVs since the early 2000s, including the seminal work by Dresner and Stone
          Worrawichaipat P, Gerding E,        (2008). They proposed a grid model of intersection and simple heuristic called First Come First
    Kaparias I and Ramchurn S (2021)          Served (FCFS), considering the intersection as a central agent that allocates paths and time-slots
    Resilient Intersection Management         to the incoming vehicles. Since their work, a number of approaches have emerged in the field
With Multi-Vehicle Collision Avoidance.
      Front. Sustain. Cities 3:670454.        1 A CAV is a vehicle that is capable of driving itself without human interference and wirelessly communicate and exchange

      doi: 10.3389/frsc.2021.670454           information with other devices outside the vehicle and external networks (SMMT, 2017).

Frontiers in Sustainable Cities | www.frontiersin.org                               1                                            June 2021 | Volume 3 | Article 670454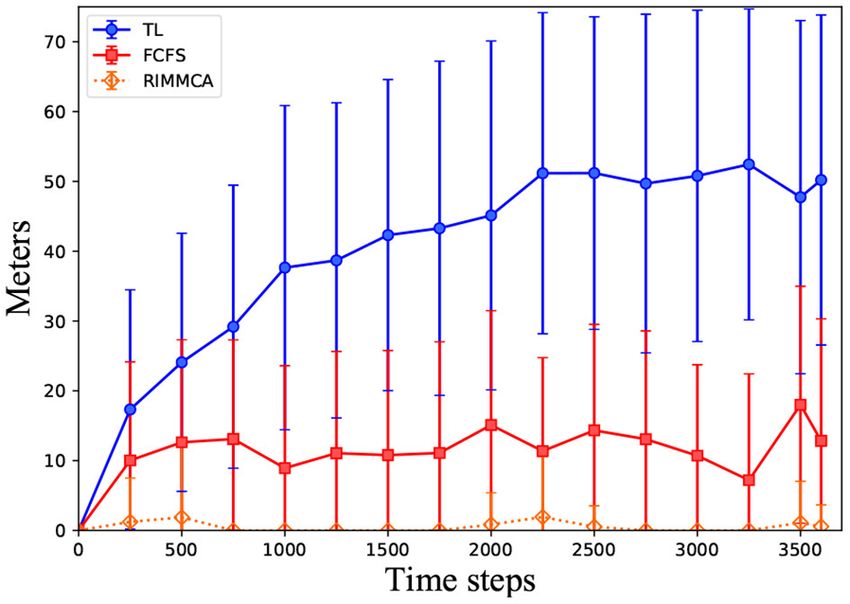
Worrawichaipat et al.                                                                                                           Resilient Intersection Management

(Vasirani and Ossowski, 2009; Carlino et al., 2013; Liu et al.,                           The rest of this paper is structured as follows. Second section
2013; Zohdy and Rakha, 2016; Lin et al., 2017; Isele et al.,                              describes related work. A description of the model and relevant
2018; Vu et al., 2018). However, to date, most works ignore two                           definitions and assumptions are presented in the third section.
important elements: (i) the dynamism of intersection topology,                            Fourthly, the details of our algorithm including behaviour of the
e.g., unequal numbers of lanes or heterogeneous traffic directions                        driver agents and the intersection agent are provided. The fifth
(ii) the resiliency of mechanism against the obstructions across                          section evaluates our algorithm against realistic traffic settings.
the intersection.                                                                         The last section concludes.
    To address the latter, a simple solution for the obstructions is
to close the obstructed lane(s), e.g., with a red traffic light, and
wait until the problem is resolved. However, doing so results in                          2. RELATED WORK
long delays which can be avoided if there is enough space to
route around obstructions. Instead, obstructions can be treated                           In addition to Dresner and Stone (2008) other related work
as a part of the collision avoidance problem. This problem is                             includes Vasirani and Ossowski (2009), Carlino et al. (2013),
widely studied in the robotics community, even though they are                            Liu et al. (2013), Au et al. (2015), and Vu et al. (2018). The
not explicitly designed for road intersection (Rebai et al., 2009;                        main objectives of these works are to optimise the efficiency
Savkin and Wang, 2014; Kim and Kwon, 2015; Pudics et al.,                                 of the intersection (either based on incentives or waiting time)
2015; Savkin and Li, 2018). Adapting the robotics algorithms to                           or to scale up the solution (e.g., consider multi-intersection
the road environment presents a certain challenge. In particular,                         systems or large numbers of vehicles). Most of these assume a
there are different physical constraints. For example, robots can                         centralised system where the an intersection manager performs
turn more easily and occupy a smaller footprint.                                          all of the computation.
    Against this background, we propose a new resource                                        Specifically, Vasirani and Ossowski (2009) proposed a market-
reservation intersection management mechanism that ensures                                inspired approach for intersection management that explicitly
obstructions can be avoided. In addition, it reduces the                                  schedules the access through bidding. Their method is designed
reliance on the intersection manager to compute paths through                             in a scalable manner, which can be extended to cover a
decentralised computation of dynamic trajectories for individual                          road network or multiple intersections. However, due to the
vehicles. By so doing, our mechanism is resilient to obstructions                         heterogeneous vehicles’ bidding power, the reduction in overall
and reduces computational cost at the intersection manager                                delays cannot be guaranteed, especially in rush hours. In the same
compared to the centralised FCFS. More specifically, our                                  vein, an auction-based method proposed by Carlino et al. (2013)
approach allows vehicles to use as much space as is available                             also experiences similar issues.
within the intersection and endow them with more intelligent                                  Moreover, recently, Vu et al. (2018) proposed an approach
path planning and conflict resolution. In particular, we build on                         based on a distributed constraint optimisation solution that
the work by Savkin and Li (2018) who provide a computationally                            aims to account for surges in traffic flow. This solution
and space-efficient approach to collision avoidance2 . We,                                addresses the risk of a single point of failure of such centralised
therefore, adapt it to consider the constraints from the traffic                          systems by distributing the computation across multiple CAVs.
intersection management problem. Thus, this paper advances the                            However, their distributed approach requires significantly high
state of the art in the following ways:                                                   communication costs, approximately 105 times more messages
                                                                                          than FCFS. Furthermore, unlike Dresner and Stone (2008),
1. First, we introduce a computationally decentralised method
                                                                                          Vasirani and Ossowski (2009), Carlino et al. (2013), and
   for the FCFS mechanism by having vehicles responsible
                                                                                          Liu et al. (2013), Zohdy and Rakha (2016) proposed an
   for path prediction and conflicts resolution against other
                                                                                          intersection Cooperative Adaptive Cruise Control (iCACC),
   reservations using minimal information provided by the
                                                                                          allowing multiple vehicles to cross the intersection as a group or
   intersection manager.
                                                                                          platoon simultaneously. The results show that the delays can be
2. Second, we propose a new path prediction algorithm with
                                                                                          reduced by 90% compared to the stop sign control.
   a collision avoidance extension customised for intersection
                                                                                              In general, while these approaches consider variations in
   management, that guarantees safe paths and adaptability to
                                                                                          traffic flow of different kinds, they ignore the dynamism inherent
   different intersection topology.
                                                                                          in the real world. For example, many approaches study only
3. We then empirically show that our mechanism algorithm
                                                                                          regular intersection topology where a number of lanes are
   can significantly outperform improved extensions of traffic
                                                                                          symmetrically equal. More importantly, vehicle trajectories are
   lights and FCFS that account for potential collisions with
                                                                                          often assumed to be static without considering any intervention
   obstructions. Specifically, we evaluate our mechanism on
                                                                                          cases, e.g., road obstructions. Therefore, these approaches are
   Simulation of Urban MObility (SUMO), a realistic simulator.
                                                                                          more likely to be vulnerable to real-world scenarios.
   Overall, the experiments show that we can maintain up to 94–
                                                                                              Furthermore, as we consider the problem of collision
   99% of the optimal performance while traffic lights and FCFS
                                                                                          avoidance, there are many recent relevant works from the
   can achieve up to only 65–90%.
                                                                                          robotics domain (e.g., Rebai et al., 2009; Savkin and Wang, 2014;
                                                                                          Kim and Kwon, 2015; Pudics et al., 2015; Savkin and Li, 2018).
2 Inthis paper, collision refers to the collision between obstacle and vehicle, not       In particular, Kim and Kwon (2015) proposed an algorithm that
between vehicles themselves.                                                              uses an ordinary camera sensor accomplishing lane following

Frontiers in Sustainable Cities | www.frontiersin.org                                 2                                      June 2021 | Volume 3 | Article 670454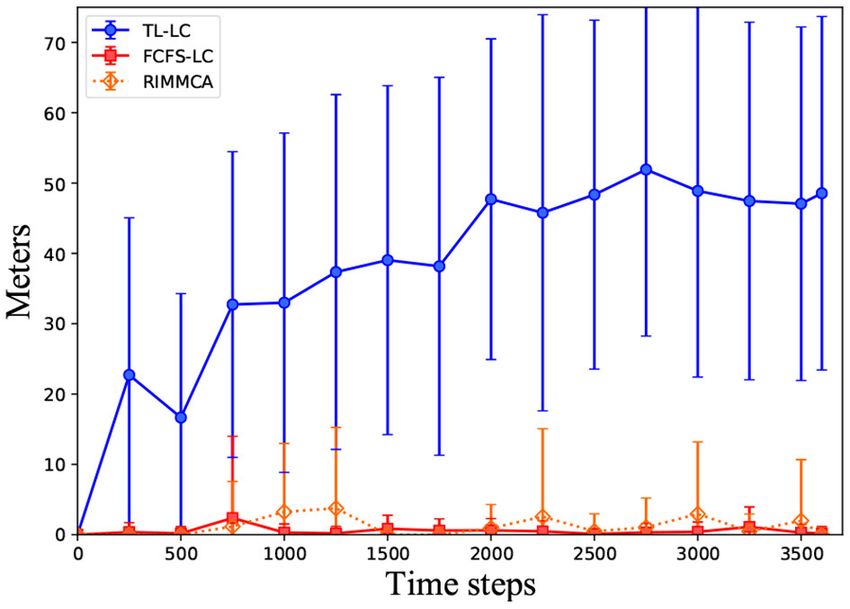
Worrawichaipat et al. Resilient Intersection Management
navigation while also avoiding obstacles. Similarly, Pudics et al.
(2015) uses a 360-degree camera as a sensor that can provide
rich information. With several calibrations and image processing
methods, the obstacles can be detected and avoided.
However, unlike Kim and Kwon (2015) and Pudics et al.
(2015), Savkin and Li (2018) proposed a simplified and more
computationally efficient collision avoidance method that only
uses 2D range finding sensors. Despite having a 2D sensor, the
information is sufficient to determine obstacle existence and
provide several tangent lines between the robot and the edge of
the obstacles. More precisely, the robot will choose a tangent
line to move along avoiding a head-on blockage before continue
moving on the obstacle’s boundary. Nevertheless, adapting such
algorithms to the road environment presents some difficulties,
mainly due to the physical differences between robots and
vehicles, such as turning or steering movements, occupancy,
speed, and, more importantly, centrifugal force.
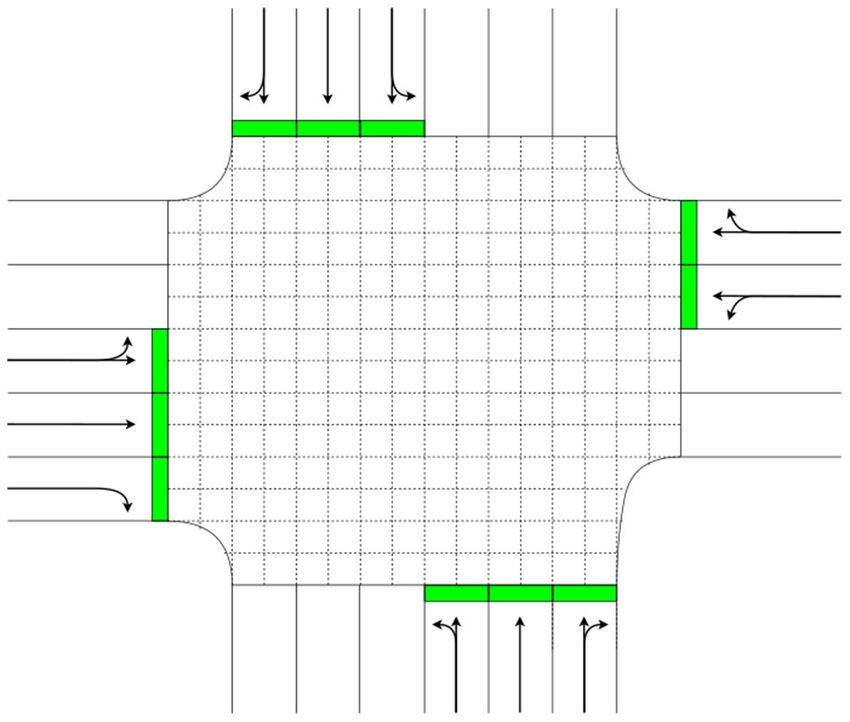
3. THE TRAFFIC MODEL FIGURE 1 | This figure illustrates the topology of intersection in Manhattan
where the space in the middle of the intersection is virtually divided into
squared cells. The arrows represent directions of the traffic.
This section describes how we model the vehicles, obstacles and
the intersection in our study system. Specifically, we base our
model on the original FCFS model (Dresner and Stone, 2008)
that considers a road intersection managed by an Intersection
Manager Agent or IMA3 . The intersection agent is able to grant its
3.3. The Intersection
Unlike the perfectly configured intersection in Dresner’s work
resource (time-slotted space in the intersection) to each vehicle—
where the number of lanes and traffic directions are identical
driver agent or DA—to coordinate each vehicle’s movement.
in all directions, we look at more general or non-symmetrical
Later, our traffic intersection management mechanism will be
intersections, i.e., with unequal numbers of lanes or nonidentical
explained in detail.
traffic directions. Additionally, when obstacles are located
nearby, this type of intersections has a realistic impact on the
3.1. Vehicles traffic, which allows us to study the disruption cause by obstacles
We define At = {a1 ...an } as a set of DAs in our system at time t. in more detail. Moreover, this type of intersection can be seen
Each ai ∈ At is modelled with its own properties: position posi , extensively in many urban areas such as New Delhi, Bangkok,
velocity vi , width wi , length li , minimum gap between the agent and Manhattan. We, therefore, model the intersection after a real
and the leading agent, and the orientation θi . All agents in At have and non-symmetrical intersection in Manhattan that intersects
the same value of maximum velocity vmax and accelerating rate α. between Park Av South and East 23rd Street. Note that our
algorithm works with different intersection settings as well.
3.2. Obstacles In this work, the access of vehicles are scheduled based on
In this paper, we only focus on static obstructions (e.g., road the cell-based space reservation similar to Dresner and Stone
construction) that occur either within the intersection or at (2008) where the centre of the intersection is discretised as a grid
the entrance of intersection. We assume the following about composed of a number of cells (k) (see Figure 1). These cells help
the obstacles: DAs keep track of their used space and time-slots according to
1. Each obstacle is unmovable and free shape. the predicted paths and also use to detect conflicts with other DAs
A virtual safe ring around is defined to ensure safety. preventing overlapping reservations (explains more in section 3).
2. The obstacles can only position in either (1) in the intersection Specifically, this method supports dynamic vehicles trajectories
area or (2) at the exit of the lanes. that may happen due to the collision avoidance while several
3. The IMA has full knowledge of the obstacles’ position and safe contemporary methods do not (e.g., Zohdy and Rakha, 2016; Lin
ring and also is able to pass these details to the DAs. et al., 2017; Vu et al., 2018).
However, whenever an obstacle is positioned at the exit of
Let O be an obstacle our system, and it is modelled with its own the lane, the vehicles in that lane must perform lane changing to
properties such as the position, the radius of the obstacle r(O), avoid the blockage before they begin crossing. These movements
the radius of the safe ring rsafe (O), the circle around the obstacle interrupt the flow, resulting in increasing delays. Therefore, we
C(O), and the circle of the safe ring Csafe (O). introduce an extension to this cell-based approach. In particular,
the grid is extended from the intersection area to cover the area
3 The
IMA typically sits within the infrastructure at the intersection and around the obstacle according to the position (see Figure 2).
communicates with nearby vehicles using typical RF communications. The benefit of this extended section is to have the lane-changing
Frontiers in Sustainable Cities | www.frontiersin.org 3 June 2021 | Volume 3 | Article 670454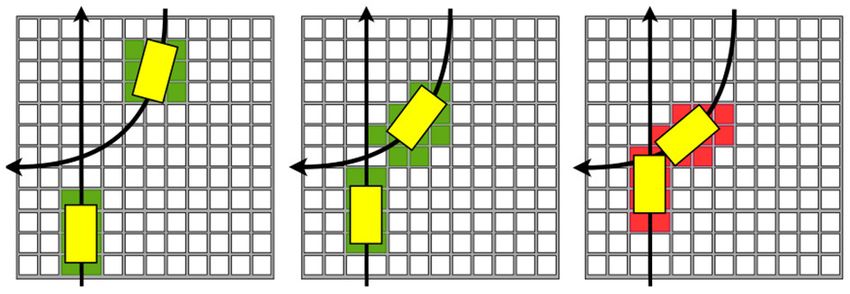
Worrawichaipat et al.                                                                                                               Resilient Intersection Management

                                                                                        FIGURE 3 | The predicted path considering the obstacle, where the solid line
                                                                                        represents path from the collision avoidance algorithm while the dashed line
                                                                                        represents the normal predicted path.
 FIGURE 2 | The extended area whenever obstacle is positioned at the exit of
 the lane. The circle represents the obstacle, and the highlighted area is where
 the grid is extended.

                                                                                          intersection are already reserved) and obstructions from the
                                                                                          intersection agent once they arrive at the waiting area.
movements combine with the crossing movements, allowing                                2. Initiate path prediction with or without collision avoidance
those movements to be reserved as one. As a result, DAs can                               depending on the presence of obstructions.
make a reservation promptly after arriving at the queuing area,                        3. Resolve the conflict that may arise due to the
bypassing the delays that lane-changing movements may cause.                              previous reservations.
    Additionally, to aid the queuing, a virtual stop bar is defined                    4. Send a requesting message containing the vehicle properties
in front of the extended grid. The virtual stop bar’s distance is                         and the predicted path to the intersection agent and then wait
calculated using the Gipps lane-changing model (Gipps, 1986).                             for a confirmation.
By limiting the lane changing speed to 25 km/h, a safe distance                           • If the request is rejected, go back to step (1)
can be derived, ∼7.5 m. DAs explicitly slow down until meeting                            • If the request is confirmed, begin the crossing.
that speed before changing the lane.
    Moreover, to decentralise the system, we introduce a new piece                     5. Notify the intersection agent that they have left the
of information for the IMA to hold called a reservation map,                              intersection area.
which is requestable by the DAs. This map contains a 2D-array of                       The main feature of decentralisation in our algorithm is that
cells, and each cell also contains a vector of numbers representing                    the driver agents are fully responsible for computations in two
its specific reserved timestamps. Simply put, this map allows the                      operations: path prediction (2) and conflict resolution (3). The
DAs to determine when and how long each cell is reserved and                           key objective of these two operations is to find a conflict-free path
able to perform the conflict resolution on their own.                                  from the agents’ position to the target lane.

                                                                                       4.1.1. Path Prediction
4. RESILIENT INTERSECTION
MANAGEMENT WITH MULTI-VEHICLE                                                          This operation simulates the agents’ movements step by step from
COLLISION AVOIDANCE                                                                    their position to the target lane. It modifies the orientation of
                                                                                       agents, θi , mimicking a steering mechanism while moving toward
Having defined the elements of the model, we next define                               the assigned target lane. The output of this operation is called a
our resilient intersection management mechanism that ensure                            predicted path pi = {< post+1        t+1
                                                                                                                       i , θi   >, ..., < post+s  t+s
                                                                                                                                             i , θi   >},
the computation is distributed while incorporating collision                           where t + s is the end timestamp of this path vector.
avoidance. The purpose of distributing the computation is                                  However, this prediction is only applicable in non-obstructed
to address the high computational load for the IMA which                               situations. Therefore, we introduce an alternative method that
is considered to be the main drawback of Dresner and                                   predicts a sub-optimal path avoiding collisions with obstacles,
Stone (2008). We thus propose a new mechanism called                                   which is explained in the next section.
Resilient Intersection Management with Multi-vehicle Collision
Avoidance (RIMMCA). Next, we detail the behaviour of the DAs                           4.1.2. Path Prediction With Obstructions
and the IMA in the system.
                                                                                       Here we explain how the agents perform path prediction even
                                                                                       when obstructions exist with two main procedures.
4.1. Driver Agents Behaviour
                                                                                          A. Obstruction detection function: This function task is to
DAs have to execute the following operations to reserve the
                                                                                       determines the need for collision avoidance. Upon DAs’ arrival
time-slotted space.
                                                                                       at the intersection, the DAs must execute the normal path
1. Ask for information about the target lane (important for                            prediction retrieving an initial predicted path. The obstruction is
   path prediction), the reservation map (i.e., which cells in the                     detected when the distance between one of the waypoints in the

Frontiers in Sustainable Cities | www.frontiersin.org                              4                                             June 2021 | Volume 3 | Article 670454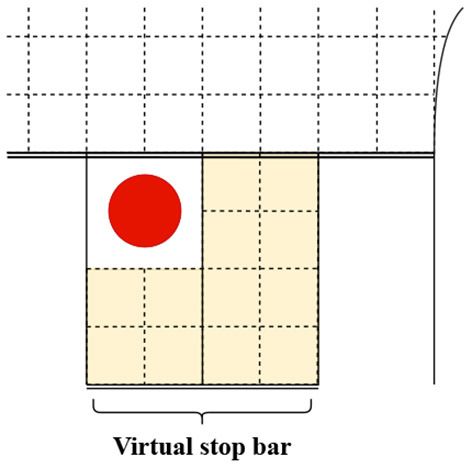
Worrawichaipat et al.                                                                                                  Resilient Intersection Management

predicted path and the centre of the obstacle’s circle is smaller           Algorithm 1: Collision avoidance.
than rsafe (O). If an obstruction is found, the initial predicted
                                                                                // When the ai is obstructed
path is discarded, and the DAs execute the path prediction with
                                                                                input : Obstacle O, tanget line T, agent ai , time step t
collision avoidance instead. Nevertheless, the collision avoidance
                                                                                output: path
still requires this function in the process, which is referred to as
                                                                            1   avir
                                                                                 i ← a virtual duplicate of ai
obstruction_detection(). Particularly, the usage is highlighted at
                                                                            2   τ ← a virtual time step of t
line 8 in Algorithm 1.
                                                                            3   obstructed ← True
    B. Collision avoidance algorithm:
    Here, we explain how the DAs can move to the target lane                4   while avir
                                                                                         i not reaching the target lane do
without causing any collisions. Our algorithm is designed based             5      if avir
                                                                                        i not touching Csafe (O) & obstructed then
on the model proposed by Savkin and Li (2018). However, we                  6          θ ← the orientation of T
adapt their models to suit the intersection environment. In their           7      if avir
                                                                                        i is touching Csafe (O) then
model, a robot agent has to explore a restricted area until it is           8          obstructed ← obstruction_detection()
fully discovered, which requires the robot to constantly check for          9          if avir
                                                                                            i is obstructed then
the collisions against walls. While, in our case, since the position       10             θ ← the orientation follows Csafe (O)’s curve
of the obstacle is static, the algorithm is modified to check for          11          else
the collisions only when needed, which is more suitable to our             12             θ ← the orientation to the target lane
environment and more computationally efficient than Savkin and             13      update aviri ’s position and orientation by steering toward
Li (2018). Moreover, due to the differences between robots and                     θ
vehicles, the physical constraints of each vehicle are taken into                  posτi ← avir
                                                                           14                  i position
account, e.g., the maximum steering angle and maximum turning                      θiτ ← avir
                                                                           15                i orientation
velocity. This is to prevent such sharp turns or potential accidents       16      path += < posτi , θiτ >
in the real environment.                                                   17      τ += 1
    Specifically, the key algorithm is described in Algorithm 1,           18   end
which mainly records the obstructed-free path per time step while
updating the vehicle’s position and orientation. The obstructed-
free path of each DA can be broken down into three main parts
of movement as follow:
1. Avoid the blockage that DA follows the tangent line T
   between its entry point and obstacles’ safe ring Csafe (O)4 ,
   line 5, 6, and 13.
2. Follow the Csafe (O) curve that DA moves along the safe ring
   until the obstruction is no longer detected (using obstruction
   detection function), line 7–10 and 13.
3. Continue to steer and move forward from the end position in              FIGURE 4 | An example of a conflict between two paths.
   (2) to the entry of the target lane, line 11–13.
The movement (3) acts as a recovery mechanism forcing the
agent to go back to the initial aiming direction while using the
                                                                              Specifically, our conflict resolution algorithms composed of
least possible space. The example of these movements is shown
                                                                           three main steps:
in Figure 3.
    Now, our driver agents can predict a path either with or               1. Calculate to-be-reserved cells and their timestamps by
without consideration of obstructions. Next, this predicted path              projecting ai ∈ At vehicle’s body using width wi , length li ,
is processed further in the conflict resolution operation.                    and < poshi , θih > in the predicted path pi on the intersection
                                                                              grid per timestamp h which starts from t + 1 and keep
4.1.3. Conflict Resolution                                                    increasing by 1.
                                                                                                                              begin
                                                                           2. Check potential conflicted timestamp qai = {qai , ..., qend
                                                                                                                                       ai } by
Although the predicted path is already defined, the DAs cannot                overlapping the to-be-reserved cells with the reservation map
begin crossing immediately due to the conflicts that may arise                                                  begin
                                                                              (retrievable from IMA), where qai is the timestamp conflict
against other reservations. An example of this situation is shown
                                                                              firstly occurs, and qend
                                                                                                   ai is the timestamp conflict ends.
in Figure 4. By following the first come first served principle, a
                                                                           3. Shift the begin timestamp of the predicted path pi by
typical solution is to have the DA that comes later wait for a
                                                                              waiting time = |qai | + 1.
certain time, waiting time, letting the DAs that come before pass
through first until no conflicts left, then the DAs that comes later       However, the conflicts may even occur again after the shifting.
can continue moving.                                                       To resolve this issue, the DAs must keep repeating the conflict
                                                                           checking (2) and timestamp shifting (3) until the predicted path
4 The size of C                                                            is free from any conflicts.
               safe (O) is   adaptable to different vehicles’ width.

Frontiers in Sustainable Cities | www.frontiersin.org                  5                                           June 2021 | Volume 3 | Article 670454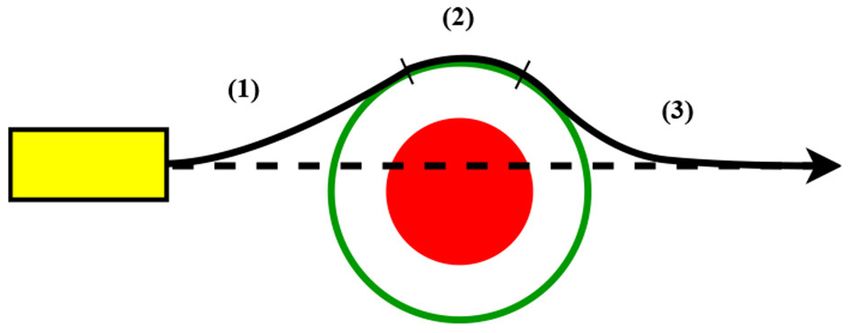
Worrawichaipat et al.                                                                                                           Resilient Intersection Management

                                                                               TABLE 1 | Average number of messages in comparison between FCFS and
                                                                               RIMMCA, under different number of vehicles.

                                                                               Number of vehicles                           FCFS                          RIMMCA

                                                                                       1,500                                5,260                           6,012
                                                                                       3,000                                13,362                         12,011
                                                                                       6,000                                41,480                         24,080

                                                                                  To compare the computational cost with the original FCFS,
                                                                               in FCFS the cost for the IMA is O[(wcell · kai )/vi ] + O(k) per
                                                                               requesting message. This is due to the path prediction and the
                                                                               conflict resolution operations. While, with our approach the
                                                                               computational cost is reduced to O(k) per requesting message.
                                                                               This opens an opportunity to replicate the function of IMA across
                                                                               multiple nodes, i.e., the vehicles, since the computational cost is
                                                                               reasonably small.
                                                                                  Furthermore, our distributed method can reduce the overall
 FIGURE 5 | The interactions flow between the IMA and DAs.
                                                                               number of messages compared to FCFS. This is because, in
                                                                               RIMMCA, DAs can internally resolve the reservation conflicts
                                                                               before sending requests to IMA. While, in FCFS, DAs notice
                                                                               the conflicts only when IMA notifies them via messages. Table 1
   In terms of the total computational cost for each DA, the
                                                                               shows a comparison of an average number of messages between
cost required for path prediction for a vehicle ai is in the order
                                                                               our method and FCFS. Indeed, it can be seen that with
O((wcell · kai )/vi ) and for conflict resolution is O(k) where wcell is
                                                                               1,500 vehicles our method requires more messages than FCFS.
the width of cell, kai is the number of cells used by ai , and k is the
                                                                               However, as the number of vehicles increases where the conflicts
total number of cells.
                                                                               are likely to occur, our RIMMCA requires significantly less
   Lastly, the DAs construct the requesting message with two
                                                                               messages than FCFS.
pieces of information: the properties of the vehicle and the
conflict-free path and send it to the IMA. We term the DA
that sends out the message as the requesting DA. With our                      5. EMPIRICAL EVALUATION
decentralised approach the IMA thus has only two tasks left,
                                                                               We aim to benchmark our RIMMCA model against two
namely, verifying the request and sending an approval. We next
                                                                               intersection controls: traffic lights (TL) and FCFS. To do so,
explain the function of this agent in more detail.
                                                                               we chose the open-source traffic simulator SUMO (Simulation
                                                                               of Urban MObility) (Krajzewicz et al., 2002). With the client-
4.2. Intersection Manager Agent Behaviour                                      server based Traffic Control Interface (TraCI) (Wegener et al.,
Unlike the original FCFS, the IMA does perform neither path                    2008) available in SUMO, external applications can be built upon
prediction nor conflict resolution since the path (or requested                allowing simulated vehicles to be controlled at run time. With this
path) is already included in the requesting message. However,                  feature, FCFS and RIMMCA algorithms can be implemented on
due to concurrency issues that occur in practice, to maintain the              the simulated intersections enabling coordination between DAs
synchronisation between agents, the IMA must be responsible for                and IMA. To do so, two important modifications were made to
the final permission granting process. In this process, the IMA                the SUMO: (1) the vehicles can progress beyond the stop bar
verifies the validity of the requested path against the current state          at any specific time even though the traffic lights are red5 (2)
of the reservation map.                                                        the vehicles can ignore their car following models when they are
    Specifically, the IMA simulates all the movements of the                   crossing the intersection6 .
requesting DA and the previously granted DAs with respect to the
timestamps while looking for reservation conflicts. If there is no             5.1. Obstacles Placement
conflict, the IMA will send an approval message with reservation               Since SUMO does not support the placement of obstacles, in
details back to the requesting DA and update the reservation                   the following we explain how we deal with obstacles in the
map as usual. However, the conflict may occur when a requesting                simulation. For an in-lane obstacle, we place an immobile vehicle
message of ai+1 arrives after the reservation map has already been             at a specific position on the lane, which partially reduces the
updated by accepting a request from ai . In this case, the request             lane’s available space. It sometimes even blocks the lane exit
will be rejected, and ai+1 has to start the path prediction and                5 The red traffic lights are required to aid the DAs waiting, indeed, according to the
conflict resolution from the beginning. The overall interaction                calculated waiting time.
flow between the IMA and DAs can be seen as a flow chart in                    6 This enables more close distance between vehicles allowing FCFS and RIMMCA

Figure 5.                                                                      to achieve their best performance.

Frontiers in Sustainable Cities | www.frontiersin.org                      6                                                June 2021 | Volume 3 | Article 670454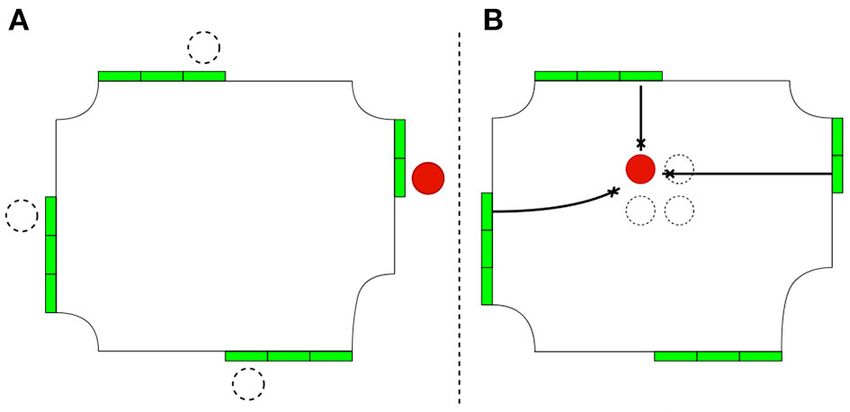
Worrawichaipat et al.                                                                                                         Resilient Intersection Management

                                                                                       not to exhaust the algorithm with such complex situations. For
                                                                                       example, in the case of the bigger obstacle, this means more lanes
                                                                                       will be blocked, which significantly worsens the performance
                                                                                       of TL-LC and FCFS-LC approaches in terms of queue lengths
                                                                                       and delays. While, RIMMCA does not rely on the lane-closure
                                                                                       approach, the bigger obstacle only has a moderate effect on
                                                                                       the results. Evaluation with this case would appear to have
                                                                                       considerably better performance than TL and FCFS, which is
                                                                                       considered an unfair comparison and overstating the results.
                                                                                           Moreover, with regards to the case of multiple obstruction
                                                                                       types at the same time, it will introduce an entirely new problem
 FIGURE 6 | This figure shows example placements of obstacles where the red            to the system, namely, multiple obstructions. The solution to this
 circle represents the obstacle, while the dashed circles represent the possible       problem would require a more complex algorithm. Even though
 alternative positions of the obstacle. The left part (A) shows in-lane                our proposed method can be modified to avoid obstacles one by
 obstructions, while the right part (B) shows in-intersection obstructions.
                                                                                       one, the resulting manoeuvring path would be only sub-optimal.
                                                                                       An additional optimisation process would be required to address
                                                                                       this aspect, which will be another challenge to our method. Still,
                                                                                       this is beyond our current research scope.
or entry depending on the position of the obstacle. However,
by using the SUMO vehicle objects as obstacles, all simulated                          5.2. Experimental Settings
vehicles can respond to the blockage themselves (e.g., changing                        Unlike Dresner and Stone (2008), where FCFS is tested in the
lane and choosing the best driving lane; Erdmann, 2015), without                       ideal conditions, we test our model on the real intersection which
any manipulation from the algorithms. This means that, in the                          is a replica of the intersection in Manhattan. Given that our
evaluation process, there is no collision avoidance extension                          focused intersection is located in New York, real traffic data
required for both TL and FCFS.                                                         is available via New York State Department of Transportation
   Nevertheless, an obstacle in the intersection cannot be                             (2016). This dataset provides the average daily traffic count of
expressed with the immobile vehicle in the same way as in-lane                         each road in 2016 allowing us to estimate the value of traffic flow.
obstacles. Otherwise, the car following model from Krauß et al.                        Specifically, the flow is between 2,300 and 2,500 vehicles/hour,
(1997) will force the crossing vehicles to stop in the middle of the                   including 10% peak-time increase. Additionally, to create more
intersection and eventually cause a deadlock (only for TL). Our                        practical traffic state, we weigh this flow across the two roads
solution is to represent this obstacle with a point of interest, a                     based on their actual usage, 67.46% on Park Av South and 32.54%
circle-shape object provided by SUMO despite having no physical                        on East 23rd Street. Given this, all simulated vehicles can be
meaning. Moreover, since no study has considered obstructions                          generated distributively and realistically per each run.
in the intersection to date, we have to evaluate our algorithm                             We leave all vehicles’ attributes as default. These attributes
against the naive collision avoidance extension of TL and FCFS,                        include width 1.8 m, length 5 m, maximum speed 11.18 m/s (≈
which is a lane closing solution. Specifically, any lanes that are                     40 km/h), acceleration 2.6 m/s2 , deceleration 4.5 m/s2 , minimum
blocked by the obstruction will be closed throughout the run.                          gap 2.5 m, and etc. The size of the obstacles are r(O) = 2.5 m,
We refer to the lane closing solution of TL and FCFS as TL-LC                          rsafe (O) = 4.5 m. Only one obstacle will be placed per run (i.e.,
and FCFS-LC.                                                                           simulation instance).
   We separate the experiment into two main types: in-lane                                 Note that the obstacle safe distance, rsafe (O), is defined
obstruction type and in-intersection obstruction type. In the first                    using three factors, obstacle radius r(O), vehicle’s width wi , and
type, to create situations that significantly worsen the throughput,                   additional safe gap gsafe . Specifically, rsafe (O) is equal to:
an obstacle is placed at the exit of the left most lane (see
Figure 6A). This left most lane is more likely to have a long                                           rsafe (O) = r(O) + (wi /2) + gsafe                  (1)
queue due to the left turn trajectory that heavily conflicts with
other trajectories. Having only one obstacle at this position                          Where SUMO passenger vehicle’s width (wi ) = 1.8 m, and gsafe
can seriously affect overall traffic throughput. In the second                         is set to be 1.1 m. Hence, rsafe (O) = 4.5 m as stated. Also, the
type, we place the obstacle in the middle of the intersection                          additional safe gap can be changed dynamically depending on
aiming to create three-lane blocking scenarios (see Figure 6B).                        specific vehicle types.
This three-lane blocking is sufficient to show its effect on the
throughput but still maintain a good flow. When more than                              5.3. Experimental Results and Discussions
three lanes are blocked, the throughput becomes poor and even                          We set each run to be 1 h simulation time with randomly
fluctuate whenever the position is changed, and it is difficult                        generated input flow and vehicles trips (from the estimated traffic
to acquire accurate results. This is due to the non-symmetric                          flow and the usage weight). For the evaluation, three traffic
intersection design.                                                                   measurement units: flow rate (vehicles/hour or veh/h), queue
   Note that the purpose of this obstacle placement is to                              length (metre) and delays (seconds/veh or s/veh) were chosen.
demonstrate how our method performs with baseline cases,                               Moreover, to gain more accurate results, each experiment was

Frontiers in Sustainable Cities | www.frontiersin.org                              7                                       June 2021 | Volume 3 | Article 670454
Worrawichaipat et al. Resilient Intersection Management
FIGURE 7 | Average queuing length results with standard deviation of four FIGURE 8 | Average queuing length results with standard deviation of four
different in-lane obstruction scenarios (20 runs per scenario). different in-intersection obstruction scenarios (20 runs per scenario).
also repeated more than 20 runs. The values reported below are By using the optimal performance without obstructions as a
the average over 20 runs. baseline, the traffic lights and FCFS offer the flow rate ≈ 65 and
≈ 98% of the optimal point, while RIMMCA offers 99% of the
5.3.1. No Obstructions optimal point. From the results, it can be seen that RIMMCA can
We initially set up obstruction-free experiments to see the outperform both traffic lights and FCFS even with the presence
optimal performance of traffic lights, FCFS and RIMMCA. The of in-lane obstacles.
results show that traffic lights are significantly outperformed
by FCFS and RIMMCA, while both FCFS and RIMMCA show 5.3.3. In-intersection Obstruction
similar results. To be exact, the optimal performance of traffic Given four possible obstacle positions (see Figure 6B), we were
lights is the flow rate of 1569.8 veh/h, queuing length of 33.28 m, able to create four distinct in-intersection obstruction scenarios.
and delays of 93.43 s/veh. While, the optimal performance of With this type of obstructions, even though the amount of the
FCFS and RIMMCA are similar and is much higher than the incoming lanes is greatly reduced due to the lane-closing solution
traffic lights, with the flow rate of 2, 402 veh/h, queuing length it affects the performance of each intersection control differently.
of ≈ 0.13 − 0.15 m and delays of 0.01 s/veh. Note that the flow For TL-LC, the performance is better than in-lane obstruction
rate and the delays are recorded at the end of each simulation. case with the flow rate of 1416.7 veh/h, queuing length of 42 m,
Next, we perform experiments with the two obstruction types: and delays of 118.82 s/veh. For FCFS-LC, the flow rate drops to
in-lane obstruction and in-intersection obstruction. 2, 170 veh/h, while the performance in queuing length and delays
are better, 1.3 m and 0.6 s/veh. Meanwhile, RIMMCA slightly
5.3.2. In-lane Obstructions loses its performance when compare to the in-lane obstruction
We created four different in-lane obstruction scenarios by case with the flow rate of 2, 260 veh/h, queuing length of 2.73 m,
placing obstacles at four distinct positions (see Figure 6A). The and the delays of 4.7 s/veh. The comparison graph of queuing
results show that the performance of TL significantly drops to length between three intersection controls with this obstruction
the flow rate of 1023.75 veh/h, queuing length of 44.85 m, and type is shown in Figure 8.
delays of 162.01 s/veh. Similarly, the performance of FCFS also Comparing FCFS-LC and RIMMCA, the average queuing
drops to the flow rate of 2371.75 veh/h, queuing length of 11.2 m, length of FCFS is better (smaller) than RIMMCA. This is because
and delays of 1.61 s/veh. While, RIMMCA can maintain its the required space of the obstructed-free paths are overlapping
performance to be close to its optimal point with the flow rate with other normal paths causing some DAs to wait longer, which
of 2380 veh/h, queuing length of 0.25 m and delays of 0.03 s/veh. results in increase of overall waiting time. However, even though
Due to the obstacles at the entry of the lane, the queuing RIMMCA has to sacrifice some efficiencies in the queuing length
length values become higher in both TL and FCFS, but not in and delays, RIMMCA still outperforms both TL-LC and FCFS-
RIMMCA. This is because in TL and FCFS, when vehicles are LC in terms of the flow rate. Specifically, with the presence of
blocked, they have to perform the lane changing, and it tends in-intersection obstacles, RIMMCA can offer the flow rate up
to interrupt the flow resulting in a long queue and high delays. to ≈ 94% of the optimal point, while the TF-LC and FCFS-LC
While, in RIMMCA the lane changing movements (only to avoid offer only ≈ 90% of the optimal point. The overall comparison
collisions) are already included in the reserved path, vehicles between three intersection controls can be seen in Table 2.
only have to follow the scheduled time-slots. Figure 7 shows the To conclude, the experiments of in-lane and in-intersection
average queuing length over time of TL, FCFS and RIMMCA. obstructions show that RIMMCA is more robust to obstructions
Frontiers in Sustainable Cities | www.frontiersin.org 8 June 2021 | Volume 3 | Article 670454Worrawichaipat et al. Resilient Intersection Management
TABLE 2 | A performance comparison table between three intersection controls in different experiment scenarios.
Flow rate (veh/h) Queuing length (m) Delays (s/veh)
TL FCFS RIMMCA TL FCFS RIMMCA TL FCFS RIMMCA
Optimal 1569.8 2402 2403 33.28 0.13 0.15 93.43 0.01 0.01
In-lane 1023.75 2371.75 2380 44.85 11.2 0.25 162.01 1.61 0.03
In-intersection 1416 2170 2260 42 1.3 2.73 118.82 0.6 4.7
in terms of flow rate compared to TL and FCFS, whether obstructions, while traffic lights and FCFS can maintain only up
obstructions are either in-lane or in-intersection. to 65–90% of the optimal performance without obstructions.
Future work will investigate how robust RIMMCA is to
communication drop-outs. Also, we plan to consider scenarios
6. CONCLUSION AND FUTURE WORK with dynamic obstacles and having multiple obstacles at the
same time.
Many intersection management approaches only consider well
behaved environments, and this means they are unable to cope DATA AVAILABILITY STATEMENT
with unexpected situations such as obstructions. To this end,
we presented a resilient intersection management method with The original contributions presented in the study are included
multi-vehicle collision avoidance. Our model offers decentralised in the article/supplementary material, further inquiries can be
computation of multiple vehicles to cross the intersection while directed to the corresponding author/s.
avoiding collisions with obstacles. Without obstructions, our
decentralised approach is shown to achieve a similar performance AUTHOR CONTRIBUTIONS
to FCFS. However, with obstructions, our realistic empirical
study shows that our model is more robust to obstructions PW wrote the first draft of the paper. All authors contributed
interfering with some crossing paths and maintain throughput to conception and design of the study, paper revision, read, and
or flow rate up to 94–99% of the optimal performance without approved the submitted version.
REFERENCES the 4th middle East Symposium on Simulation and Modelling (MESM20002)
(Sharjah), 183–187.
Au, T.-C., Zhang, S., and Stone, P. (2015). “Autonomous intersection management Krauß, S., Wagner, P., and Gawron, C. (1997). Metastable states in a microscopic
for semi-autonomous vehicles,” in Handbook of Transportation, ed D. model of traffic flow. Phys. Rev. E 55:5597. doi: 10.1103/PhysRevE.55.5597
Teodorović (New York, NY: Routledge), 88–104. Lin, P., Liu, J., Jin, P. J., and Ran, B. (2017). Autonomous vehicle-intersection
Carlino, D., Boyles, S. D., and Stone, P. (2013). “Auction-based coordination method in a connected vehicle environment. IEEE Intell. Transp.
autonomous intersection management,” in 16th International Syst. Mag. 9, 37–47. doi: 10.1109/MITS.2017.2743167
IEEE Conference on Intelligent Transportation Systems Liu, K., Chan, E., Lee, V., Kapitanova, K., and Son, S. H. (2013). Design and
(ITSC 2013) (The Hague), 529–534. doi: 10.1109/ITSC.2013. evaluation of token-based reservation for a roadway system. Transp. Res. Part
6728285 C 26, 184–202. doi: 10.1016/j.trc.2012.09.001
Dresner, K., and Stone, P. (2008). A multiagent approach to autonomous May, A. D. (2013). Urban transport and sustainability: the key challenges. Int. J.
intersection management. J. Artif. Intell. Res. 31, 591–656. Sustain. Transp. 7, 170–185. doi: 10.1080/15568318.2013.710136
doi: 10.1613/jair.2502 New York State Department of Transportation (2016). Traffic Data Viewer. New
Erdmann, J. (2015). “Sumo’s lane-changing model,” in Modeling Mobility with York State Department of Transportation.
Open Data, eds M. Behrisch, and M. Weber (Berlin: Springer), 105–123. Pudics, G., Szabó-Resch, M. Z., and Vámossy, Z. (2015). “Safe robot navigation
doi: 10.1007/978-3-319-15024-6_77 using an omnidirectional camera,” in 2015 16th IEEE International Symposium
Gipps, P. G. (1986). A model for the structure of lane-changing on Computational Intelligence and Informatics (CINTI) (Budapest), 227–231.
decisions. Transport. Res. Part B Methodol. 20, 403–414. doi: 10.1109/CINTI.2015.7382928
doi: 10.1016/0191-2615(86)90012-3 Rebai, K., Benabderrahmane, A., Azouaoui, O., and Ouadah, N. (2009). “Moving
Isele, D., Rahimi, R., Cosgun, A., Subramanian, K., and Fujimura, K. (2018). obstacles detection and tracking with laser range finder,” in 2009 International
“Navigating occluded intersections with autonomous vehicles using deep Conference on Advanced Robotics (Munich), 1–6.
reinforcement learning,” in 2018 IEEE International Conference on Robotics Savkin, A. V., and Li, H. (2018). A safe area search and map building algorithm for
and Automation (ICRA) (Brisbane, QLD), 2034–2039. doi: 10.1109/ICRA.2018. a wheeled mobile robot in complex unknown cluttered environments. Robotica
8461233 36, 96–118. doi: 10.1017/S0263574717000194
Kim, Y., and Kwon, S. (2015). A heuristic obstacle avoidance Savkin, A. V., and Wang, C. (2014). Seeking a path through the crowd: Robot
algorithm using vanishing point and obstacle angle. navigation in unknown dynamic environments with moving obstacles based on
Intell. Service Robot. 8, 175–183. doi: 10.1007/s11370-015- an integrated environment representation. Robot. Auton. Syst. 62, 1568–1580.
0171-4 doi: 10.1016/j.robot.2014.05.006
KPMG (2015). Connected and Autonomous Vehicles the UK Economic Opportunity. Schneider, B. (2018). Traffic’s Mind-Boggling Economic Toll. Bloomberg CityLab.
Technical report, KPMG. Available online at: https://www.bloomberg.com/news/articles/2018-02-07/
Krajzewicz, D., Hertkorn, G., Rössel, C., andWagner, P. (2002). “Sumo (simulation new-study-of-global-traffic-reveals-that-traffic-is-bad (accessed November
Q17 of urban mobility)-an open-source traffic simulation,” in Proceedings of 2019).
Frontiers in Sustainable Cities | www.frontiersin.org 9 June 2021 | Volume 3 | Article 670454Worrawichaipat et al. Resilient Intersection Management SMMT (2017). Connected and Autonomous Vehicles. Technical report, SMMT. Zohdy, I. H., and Rakha, H. A. (2016). Intersection management via vehicle Vasirani, M., and Ossowski, S. (2009). “A market-inspired approach to connectivity: the intersection cooperative adaptive cruise control system reservationbased urban road traffic management,” in Proceedings of the 8th concept. J. Intell. Transp. Syst. 20, 17–32. doi: 10.1080/15472450.2014.889918 International Conference on Autonomous Agents and Multiagent Systems, Vol. 1 (Budapest), 617–624. Conflict of Interest: The authors declare that the research was conducted in the Vu, H., Aknine, S., and Ramchurn, S. D. (2018). “A decentralised absence of any commercial or financial relationships that could be construed as a approach to intersection traffic management,” in Proceedings of potential conflict of interest. the Twenty-Seventh International Joint Conference on Artificial Intelligence, IJCAI-18 (Stockholm), 527–533. doi: 10.24963/ijcai. Copyright © 2021 Worrawichaipat, Gerding, Kaparias and Ramchurn. This is an 2018/73 open-access article distributed under the terms of the Creative Commons Attribution Wegener, A., Piórkowski, M., Raya, M., Hellbrück, H., Fischer, S., and Hubaux, License (CC BY). The use, distribution or reproduction in other forums is permitted, J.-P. (2008). “Traci: an interface for coupling road traffic and network provided the original author(s) and the copyright owner(s) are credited and that the simulators,” in Proceedings of the 11th Communications and Networking original publication in this journal is cited, in accordance with accepted academic Simulation Symposium (Ottawa, ON), 155–163. doi: 10.1145/1400713. practice. No use, distribution or reproduction is permitted which does not comply 1400740 with these terms. Frontiers in Sustainable Cities | www.frontiersin.org 10 June 2021 | Volume 3 | Article 670454
You can also read