Effects of Sinusoidal Vibrations on the Motion Response of Honeybees - Frontiers
←
→
Page content transcription
If your browser does not render page correctly, please read the page content below
BRIEF RESEARCH REPORT
                                                                                                                                                        published: 10 June 2021
                                                                                                                                                 doi: 10.3389/fphy.2021.670555

                                             Effects of Sinusoidal Vibrations on the
                                             Motion Response of Honeybees
                                             Martin Stefanec 1*, Hannes Oberreiter 1, Matthias A. Becher 1, Gundolf Haase 2 and
                                             Thomas Schmickl 1
                                             1
                                              Artificial Life Laboratory, Institute of Biology, University of Graz, Graz, Austria, 2Institute of Mathematics and Scientific Computing,
                                             University of Graz, Graz, Austria

                                             Vibratory signals play a major role in the organization of honeybee colonies. Due to the
                                             seemingly chaotic nature of the mechano-acoustic landscape within the hive, it is difficult to
                                             understand the exact meaning of specific substrate-borne signals. Artificially generated
                                             vibrational substrate stimuli not only allow precise frequency and amplitude control for
                                             studying the effects of specific stimuli, but could also provide an interface for human-animal
                                             interaction for bee-keeping-relevant colony interventions. We present a simple method for
                                             analyzing motion activity of honeybees and show that specifically generated vibrational
                                             signals can be used to alter honeybee behavior. Certain frequency-amplitude
                                             combinations can induce a significant decrease and other signals might trigger an
                                             increase in honeybees’ motion activity. Our results demonstrate how different subtle
                                             local modulatory signals on the comb can influence individual bees in the local vicinity of the
                                             emitter. Our findings could fundamentally impact our general understanding of a major
                         Edited by:
                   Natasha Mhatre,           communication pathway in honeybee colonies. This pathway is based on mechanic signal
          Western University, Canada         emission and mechanic proprio-reception of honeybees in the bee colony. It is a candidate
                        Reviewed by:         to be a technologically accessible gateway into the self-regulated system of the colony and
                        Michael Hrncir,
       University of São Paulo, Brazil
                                             thus may offer a novel information transmission interface between humans and honeybees
                Damian Octavio Elias,        for the next generation of “smart beehives” in future beekeeping.
     University of California, Berkeley,
                          United States      Keywords: honeybees, behavior, substrate-born communication, modulatory signals, freezing responds

                  *Correspondence:
                      Martin Stefanec
          martin.stefanec@uni-graz.at        1 INTRODUCTION
                    Specialty section:       Honeybees are not only economically valuable as producers of honey and wax, but most importantly
         This article was submitted to       they are highly efficient pollinators of wild flowers and hence they provide exceptionally important
                        Social Physics,      ecosystem services [1, 2]. Even beyond ecology, the economic dependency on honeybees for crop
               a section of the journal      production is significant: While the demand for bee-pollinated crops is constantly on the rise, the
                    Frontiers in Physics
                                             recently reported steep increases in colony losses have raised concerns about the sustainability of
        Received: 21 February 2021           honeybee populations and crop production [3].
           Accepted: 20 May 2021
                                                 The Western honeybee (Apis mellifera L.) has evolved a sophisticated communication system
          Published: 10 June 2021
                                             based on a set of very distinct locomotion behaviors, called “dances,” which involve the production
                              Citation:      and a localized emission of specific mechano-acoustic vibrational patterns. These specific dance types
Stefanec M, Oberreiter H, Becher MA,
                                             trigger very specific reactions or behavioral modulations in those animals that perceive the emitted
Haase G and Schmickl T (2021) Effects
of Sinusoidal Vibrations on the Motion
                                             stimuli. These dances form, in their totality, the “dance language” of the honeybees. Most notably the
             Response of Honeybees.          “waggle dance” is used for recruiting nest mates to a specific foraging source. A dancing bee
               Front. Phys. 9:670555.        communicates the location of a food source by a repeated figure-eight shaped movement. The
      doi: 10.3389/fphy.2021.670555          direction of the linear waggle phase relative to gravity represents the direction of the food source

Frontiers in Physics | www.frontiersin.org                                              1                                                June 2021 | Volume 9 | Article 670555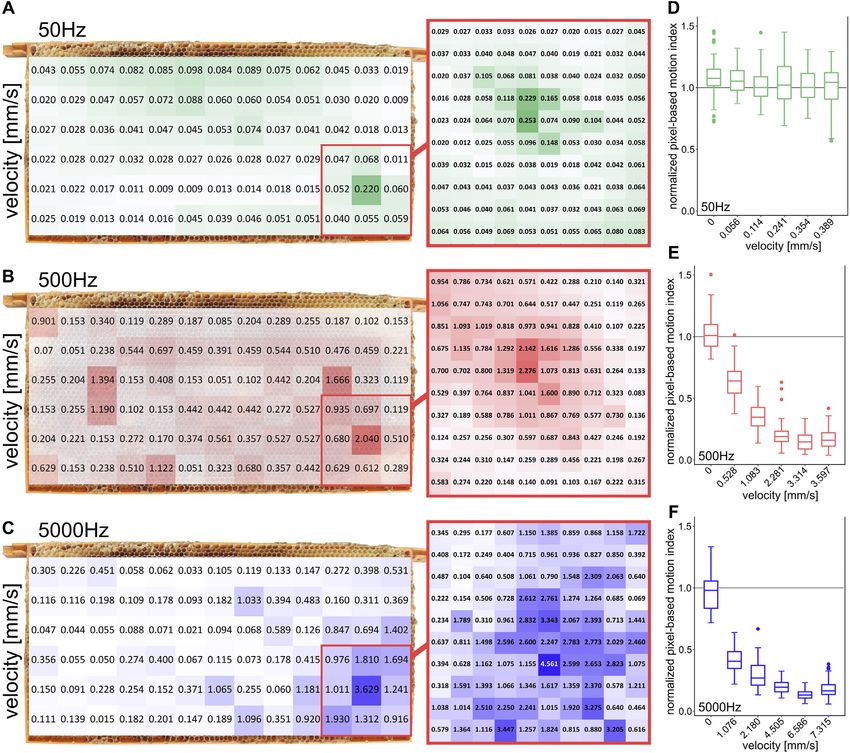
Stefanec et al.                                                                                        Honeybees’ Reactions to Sinusoidal Vibrations

relative to the sun, while the duration of each run increases with         reporting only qualitative annotations. We refrained from using a
the distance of the food source [4]. To decode the information             modified loudspeaker to transfer the vibrational stimulus onto the
from such a dance, the observer bees have to closely follow the            comb via a physical/mechanical bridge, but integrated a thin
movements of the dancing bee. As the inside of a hive is usually           piezoelectric loudspeaker into the honeycomb itself, to alter the
dark, information cannot be transferred visually but instead via           natural environment on the honeycomb as little as possible.
vibrations emitted during the waggling phase of each waggle
dance circuit. The vibration signals are typically composed of a ca.       2.1 Experimental Setup
15 Hz body movement and a 200–300 Hz vibration produced by                 All experiments were conducted on a small honeybee colony
the flight muscles [5, 6]. It has been shown that these signals also        (approx. 1,500 bees) housed in a one-comb observation hive (see
travel through the comb which can act as an amplifier [7, 8].               Figure 1E). The hive was located inside a building with the hive
Therefore the comb itself is the medium for sound transmission             entrance being connected to the outside, allowing the bees to
and the content of the cells affects the number of dance followers,        forage in a natural habitat. In our experimental setup, a
with empty cells attracting more recruits [7, 9]. Other bees may           commercially available food-grade plastic honeycomb, as
not only interact with a dancer by following her runs but they can         frequently used by beekeepers, was modified in the following
also interfere with the waggle dances and interrupt them. For              way: The outer frame elements of two plastic honeycombs were
example, if another bee encounters a dance advertising a food              shortened on one side each and both were joined together to form
source that she already knows to be sub-optimal, she may send a            a new combined double-layered honeycomb with a slim space in
“stop signal” [10]. In this case the bee bumps her head into the           between the two middle layers to allow cables and devices to
advertising dancer and emits another specific vibrational signal in         reside in this cavity (see Figure 1B). Into this cavity, which was
parallel to the head-butting [11]. As a consequence, the dancing           approx 10 mm wide, four piezoelectric elements were inserted
bee often stops advertising its food source. A similar effect of           (see Figures 1A,D). One of these piezoelectric elements (Murata
stopping the previously executed behavior can be triggered                 7BB-27-4L0) served as the emitter of the vibration stimuli we
artificially in lab studies: When bees were stimulated with                 tested here, while the other three elements were used for signal
sinusoidal sound vibrations emitted onto the honeycomb, they               recording for control and adjustment purposes. The emitter was
reacted with spontaneous movement stops, what is called the                placed at a specific area of the comb, the so-called “dance floor
“freezing response” [12–14]. While these stop and freezing signals         region,” the region in the hive where the majority of forager
are characterized by higher frequency vibrations, low frequency            recruitment dances happen. After these preparations, the
vibrations of ca. 10–40 Hz may be associated with increased                honeycomb was covered with a thin layer of wax and placed
activity levels of bees [15–17]. In addition, other signals and            in a conventional full-sized colony beehive for 10 weeks. During
feedback mechanisms are involved in the coordination of                    this time, it was fully accepted by bees and filled with cells
foraging by the bee colony [18]. We pick up this line of                   containing brood, pollen and nectar and received the required
research on the fundamental mechano-physical aspects of                    chemical nest-scent which is important for acceptance of the
honeybee interaction. In our study, we aim to understand the               comb. The honeycomb was then transferred into the
effects of vibrations on the individual and collective behavior of         experimental observation hive, replacing the original comb
honeybees. The main research question that drives our study is             that the experimental colony had in usage up until then. We
“How do specifically shaped vibration patterns on the combs alter           waited for additional 2 weeks for the experimental colony to fully
the behavior of the bees that perceive these stimuli?.” The answers        accept the modified comb before starting to conduct the
to this research question can offer insights into the recruitment          experiments. The experiments were recorded digitally as video
processes that governs the individual foraging behavior and the            with a Canon D5 camera (see Figure 1C). In the experiments we
collective foraging patterns that arise from them. This might be a         report here, a python script was used for the stimulus generation
door opening method for novel technology to boost the                      (see Figure 1G). We tested 19 different sinusoidal frequencies:
pollination service, and ultimately also the ecosystem service             From 50 to 750 Hz in 50 Hz steps, from 1000 to 2500 Hz in
provided by a honeybee colony in a new generation of “smart                500 Hz steps, and in addition, we examined the effect of white
beehives.”                                                                 noise. We repeated the excitation for each stimulus 12 times. The
                                                                           intensities used for each frequency stimulus are shown in
                                                                           Figure 2C. In addition, we tested the effect of different
2 MATERIALS AND METHODS                                                    amplitude levels on the bees’ response at 50, 500, and 5000 Hz
                                                                           and repeated each amplitude-frequency combination 10 times
Our basic concept in the setup of our experiments was initially            (shown in Figures 3D–F). These sinusoidal stimuli were passed
inspired by the setup reported in [12] and further elaborated to           through an audio amplifier (see Figure 1F) to the emitter inside
reflect and incorporate the technological progress we can build             the honeycomb. All experiments were carried out in continuous
upon. However, these innovations allowed us to make significant             30-min experiment cycles (see Figure 1L), which were recorded
improvements in the research focus and in the level of detail of           on video at 25FPS. Each cycle consisted of a series of 5 s long
our observations: Instead of subjectively evaluating the bees’             stimulus periods with vibrational emissions of specific
behavioral responses, we use here a simple but effective pixel-            frequencies and amplitudes, alternated by 10-s periods without
based evaluation metric to measure the change in motion activity.          any active stimulus emissions. The sequence of frequencies and
This allowed us to quantify the behavioral responses instead of            amplitudes was produced in a randomized order.

Frontiers in Physics | www.frontiersin.org                             2                                      June 2021 | Volume 9 | Article 670555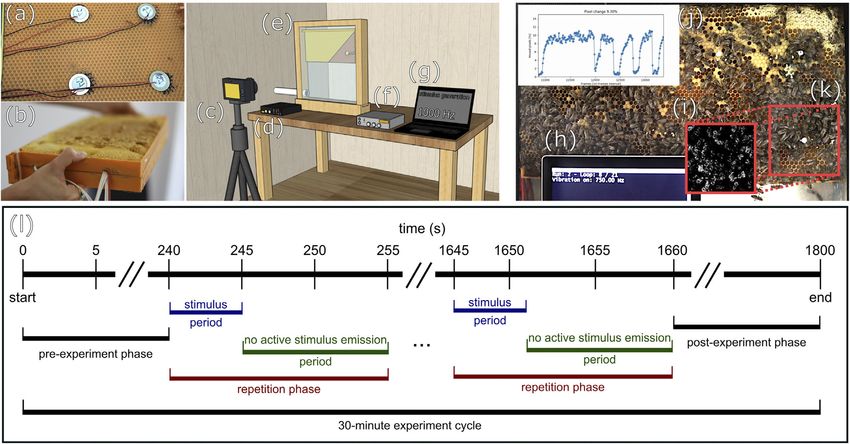
Stefanec et al.                                                                                                             Honeybees’ Reactions to Sinusoidal Vibrations

  FIGURE 1 | Modified honeycomb, experimental setup, and exemplary video frame with overlays (A) placement of piezoelectric elements on the inner side of the
  comb, (B) closed modified comb, (C) camera, (D) sound recorder, (E) observation beehive (position of vibration-emitter in diagram exposed), (F) amplifier, (G) frequency
  generation, (H) information on the actuation status, (I) motion detection in ROI: value changes between frames below (black) and above (white) threshold, (J) average
  PMI of ROI over time, (K) red markings indicate the position of ROI, (L) diagram of exemplary experiment cycle.

2.2 Optical Motion Activity Analysis                                                     previous studies [19]. To additionally account for noise in the
The experimental video recordings were processed after all                               video recordings, the PMI of 10 frames each were arithmetically
experiments were completed. For the evaluation of the                                    averaged.
honeybees’ motion activity modulations induced by the
                                                                                                     1 K K
vibrational patterns, we defined a pixel-based motion index                                   MIt          px,y,t 1, if px,y,t − px,y,t+1 > threshold                    (2)
(PMI) according to Eqs. 2, 3. A square-shaped region of                                              K 2 x1 y1    0,            otherwise
interest (ROI) was defined around the emitter of the
                                                                                                         1 10
vibrational stimuli, with a size of 400 × 400 pixels in each                                 PMIt10        MIt                                                           (3)
frame, respectively, 10 × 10 cm on the comb. Within this ROI,                                           10 t1
the three color (red, green blue) channels were combined into one
                                                                                         An exemplary frame of such a video recording with an indicated
average gray-scale image array for each frame t as ROIt :
                                                                                         ROI is shown in Figures 1H–K. Figure 4 shows four example
                               p1,1,t        p1,2,t    ...                               PMI arrays at different frequency excitations before arithmetic
                             ⎢
                             ⎡                                 ⎥⎥⎥⎤
                      ROIt  ⎢
                             ⎢
                             ⎣ «              1                   ⎦            (1)       averaging of the arrays. The experiments were conducted over the
                               pK,1,t                 pK,K,t                             course of 2 days at the end of August 2019. To account for
                                                                                         differences in the general motion activity levels that the bees
Each array element value of the gray-scale ROIt was compared to                          exhibited between experimental cycles, each MIi10 was normalized
the corresponding element in the consecutive video frame’s array.                        to the arithmetic mean MI of all no-active stimulus emission
To compensate for random noise of the image sensor, a threshold                          periods of the same experiment cycle. For the Python-based
value was defined. If the difference between two corresponding                            implementation of the PMI calculation, multiprocessing was
array items exceeded this threshold, the change was denoted as 1,                        used for efficient data processing, the source code can be
otherwise a value of 0 was denoted. This procedure resulted in a                         found in the repository.
set of (significantly) changed pixel values in the ROI, which can
be expressed as a fraction of changed pixels in the whole
population of pixels in the ROI. This pixel-change metric can                            2.3 Intensity Measurements
be understood as a proxy metric for the motion in the video                              The effects of different intensities on the motion activity of the
recording, a similar metric has been shown to be useful in                               bees at various frequencies (50, 500, and 5000 Hz) were

Frontiers in Physics | www.frontiersin.org                                           3                                              June 2021 | Volume 9 | Article 670555
Stefanec et al.                                                                                                                 Honeybees’ Reactions to Sinusoidal Vibrations

  FIGURE 2 | Normalized pixel-based motion index depending on the stimulus frequency (A) boxplots show the distribution of normalized PMI measurements to the
  respective frequency stimulus. 12 repetitions per frequency, each repetition phase consists of 5 s of stimulus, filmed at 25 FPS. 10 FPS are combined into one
  measurement, first and last measurement of each stimulus period were discarded. Same lowercase letters indicate non-significantly different data groups (pairwise
  Wilcoxon tests, Bonferroni–Holm adjusted p-value) [25]. Colored backgrounds indicate areas with related data groups. Section A: control to 200 Hz stimulus, high
  basic PMI; section B: 250–450 Hz stimulus, sharply decreasing PMI; section C: 500–2500 Hz stimulus, low PMI. Outside these ranges: white noise (B) shows the data
  as mean values and the corresponding standard deviation with correctly spaced frequency intervals. Models describing the courses of frequency dependence of the PMI
  were fitted to the mean values for the respective data groups in section A,B,C. Section A is described by a parabolic function, section B by a power function and section C
  by a line (C) shows the intensities of the stimulations at the respective frequencies (squares and red dotted line) measured at the position of the highest intensity on the
  surface of the comb. The figure also includes threshold curve of the freezing response (black solid line), data adopted from [14]. Incorporated into the dependency of
  frequency and displacement amplitude is also the change of PMI: blue fill color of the squares indicates a change in motion activity compared to control.

Frontiers in Physics | www.frontiersin.org                                              4                                                June 2021 | Volume 9 | Article 670555
Stefanec et al.                                                                                              Honeybees’ Reactions to Sinusoidal Vibrations

measured (Figures 3D–F). For this purpose, intensities were              wise error rate adjustment was used. Test results are represented
chosen that were respectively lower and higher than the                  as lowercase letters [25], whereas the same letters indicate a
intensities used for the frequency-dependent experiments                 nonsignificant comparison p > 0.05, see Figure 2A.
(which are shown in Figure 2C). The actual vibration
intensity on the surface of a comb depends on the size of                2.5 Code Availability
the comb, on the type of comb and foundation, on the housing             For reproducible code a public Github repository1 under MIT
and on the position of the measurement [8, 20]. Also the                 licence was created. It includes the exported dataset, session info
content of the comb, respectively the bees themselves, might             with packages, the code used for the statistical analysis, and the
influence the pervading vibrations [21]. To show the                      exported pairwise comparison test results.
distribution of the vibration intensity on the comb surface,
we measured the intensity for different frequencies (50, 500,
5000 Hz) in a 3 × 3 cm grid for the whole comb and a finer grid           3 RESULTS
within the ROI (1 × 1 cm). Since intensity measurements with
a laser vibrometer required direct, uninterrupted contact with           3.1 Motion Activity Depending on the
the surface of the comb, these measurements could not be                 Stimulus Frequency
conducted in an inhabited hive. After the completion of the              Figure 2 shows the normalized PMI (Eqs. 2, 3) in response to the
behavior experiments, the colony was removed from the comb               frequency of the applied vibration. All data groups were
and the bees were transferred to another hive. The same                  compared pairwise (Figure 2A). This allowed us to classify the
observation hive and the experimental comb, which still                  data into three distinct frequency-defined sections that share a
contained comb alterations of the bees affecting the                     common behavior: When bees were stimulated with frequencies
vibration propagation (food in cells, potentially brood), was            located in section A (in the range of 50–200 Hz, respectively the
used for post-hoc evaluation. The intensity measurements were            control group), the observed bees in the ROI did not show a
conducted at a later point in time, the comb was stored in a             significantly reduced motion activity in the normalized PMI, but
freezer in between. Changes that might alter the intensity of            even a slight increase in activity at low frequencies, with a
vibration on the front side of the comb can therefore not be             maximum at 100 Hz. Further increasing the frequency of the
ruled out. Hence, the distribution of vibration shown in                 signal yielded a diminishing of the reaction back again to the level
Figures 3A–C can only indicate the actual distribution of                observed in the control group at the highest frequency in section
vibration intensity in the live experimental setup. To                   A, which is 200 Hz. In contrast to that, when stimulating the bees
prepare the intensity measurements, we put self-adhesive                 with frequencies within section B (250–450 Hz) a different
reflector tapes on the surface of the honeycomb at even                   pattern was observed in the reaction of the bees: They
intervals. We measured the intensity exactly at the center of            exhibited a significant decrease in their normalized PMI with
each grid measurement point. We generated the vibration                  increasing frequencies. A further increase of frequencies covered
stimuli     of   the   behavioral     experiments      with   a          by section C (500–2500 Hz) resulted in a low normalized PMI,
piezotransducer and simultaneously recorded it with three                independent of the exact frequency.
surrounding piezoelectric sensors. To make the post-hoc                     To further detail the observed dependencies of behavioral
laser-measurement evaluation as comparable as possible, the              modulation and bees on the frequencies of the emitted stimuli, we
vibration generation was performed the same as in the                    fitted a set of regression functions for every section. These
behavior experiments and was additionally recorded by the                functions model the expected behavioral modulation of the
same piezoelectric sensors. The intensities in these recordings          PMI with respect to the tested vibrational frequencies
were digitally measured to match with the previously digitally           (Figure 2B), in order to allow prediction of the honeybees’
measured intensities of the behavior experiment recordings.              responses to signals in the regions on the frequency band
The alignment showed comparable digital intensities at the               between the tested frequencies. The honeybees’ response to
different frequencies tested. After we were able to ensure               signals with frequencies in section A can be predicted by a
similar vibration intensities through this step, we conducted            parabolic function (A(frq)  −(0.0032frq − 0.28)2 + 1.08), in
more precise intensity measurements using a laser vibrometer             response to frequencies in section B by a power function
(Polytec PDV 100), the measurements are shown in Figures                 (B(frq)  105 frq−2.21 ) and in response to frequencies in section
2C, 3. The data was transmitted to the Polytec Vibrometer                C by a linear function (C(frq)  0.127).
software (V5.2.2) via the USB break-out box (VIB-E-220). In                 In addition to the effect of specific frequencies, we also
this software the magnitude was measured as velocity via fast            tested the effect of white noise onto the bees’ motion
Fourier transform.                                                       behavior. As Figure 2A shows, this signal, which is
                                                                         composed by the definition of a collection, or a sum of all
2.4 Statistical Analysis                                                 possible frequencies, triggered again a clear, but not a
We used the software package R [22] with the RStudio IDE [23]            maximal, response in the honeybees’ motion modulation.
for the majority of our analyses. The package collection tidyverse       We observed that this mixed-frequency signal reduced the
[24] was used for graphs and exploratory data analysis. For
comparing effects of different frequency stimuli, a two sided
pairwise Wilcoxon rank sum test with Bonferroni–Holm family              1
                                                                             https://github.com/martin-st/motion-analysis-of-honeybees

Frontiers in Physics | www.frontiersin.org                           5                                              June 2021 | Volume 9 | Article 670555
Stefanec et al. Honeybees’ Reactions to Sinusoidal Vibrations
FIGURE 3 | Spatial distribution of local vibration stimulation intensities and effect of stimulation intensity on changes in honeybee movement activity (A–C) local
intensity measurements on the comb at 50, 500, and 5000 Hz, (D–F) normalized pixel-based motion index of bee activity in the region of interest depending on different
signal intensities for 50, 500, and 5000 Hz (10 repetitions per group). Signal intensity measured at the comb position of maximum intensity at the corresponding
frequency.
PMI down to be about four times higher than the lowest comb surface varied significantly depending on various factors.
observed PMI and was found to be a response similar to a To map an impression of the distribution of intensities on the
clean sinusoidal signal of 250 Hz. surface of the honeycomb, we measured the intensities for three
Exemplary results showcasing the different PMI for the different frequencies at different locations (Figures 3A–C). The
control group, 100 Hz, white noise and 750 Hz are shown in highest intensities were measured near the emitter in the center of
Figures 4A–D. the ROI for all frequencies. The emitter was placed in the inner
side of the hollow honeycomb.
Figures 3D,E shows the dependence of the freezing response on
3.2 Motion Activity Depending on the the amplitude of the emitted sinusoidal signal. For three specific
Stimulus Intensity frequencies, the normalized PMI was determined for different
We also observed the influence of the signal’s amplitude onto the intensity levels. At 50 Hz, no significant change in motion activity
observable behavioral modulation of the recipients’ motion was detected regardless of the applied stimulus magnitude. At 500 Hz a
behavior. However, the actual vibration intensities on the reduction of motion activity between video frames was determined at a
Frontiers in Physics | www.frontiersin.org 6 June 2021 | Volume 9 | Article 670555Stefanec et al. Honeybees’ Reactions to Sinusoidal Vibrations
FIGURE 4 | Comparison of PMI10 for different frequency stimuli. For each panel: small colored top left image shows part of the frame with indicated ROI, small gray
image shows gray-scale ROI, large black and white image shows PMI10 out of one exemplary stimulus period for (A) control group, (B) 100 Hz stimulus, (C) white noise,
and (D) 750 Hz stimulus before arithmetically averaging the array, white pixels indicate movement.
velocity of 0.528 mm/s and at 5000 Hz at a velocity of 1.076 mm/s. At redrawn from [14], has been added as a reference data set to
500 Hz and an intensity of more than 2.281 mm/s, respectively, at this graph.
5000 Hz and an intensity of more than 4.505 mm/s no further
reduction of the PMI was detected.
4 DISCUSSION
3.3 Correlation of Frequency and 4.1 Stimuli Generation for Studying
Displacement Amplitude Honeybee Communication Pathways
In order to provide a final interpretation of our data and to see its Much research effort has been invested over the past 50 years to
standing within the existing body of literature, we conducted a explore the effects of substrate-born vibrations in the honeybee
post-hoc meta-analysis on reference data from literature, which is colony [26–30]. One common approach of such studies has been
shown in Figure 2C. This graph depicts a 3Dimensional view of to playback vibration signals onto the combs [31, 32]. However,
our data: The X-Y plane depicts the relationship between these signals consist of a convolution of many frequencies, they
frequencies and displacement amplitude of the stimuli in our are often modulated, and can be very complexly structured.
experiments (measured directly on the emitter). The color of the Another approach has been to study the effects of pure-tone
data points represents our experimental results in a summarized sinusoidal frequencies, such was the study that first reported on
way: data points filled in blue indicate a significant response of the freezing response of honeybees to these stimuli [12]. The
honeybees to a stimulus compared to the control data set. In study reports a decreased locomotive activity, especially with
addition to that, a threshold curve for the freezing response, frequencies in a range of 500–1000 Hz. No such freezing response
Frontiers in Physics | www.frontiersin.org 7 June 2021 | Volume 9 | Article 670555Stefanec et al. Honeybees’ Reactions to Sinusoidal Vibrations
was reported at a frequency below 100 Hz or above 2500 Hz. The response to artificial vibratory stimulation may exist, but more
excitation of the subgenual organs of a honeybee is a mechanical detailed studies are needed to confirm this assumption.
energy transfer, thus the energy that the signal contains is
expected to be important. This energy depends on the signal’s
amplitude and on the frequency in combination, additionally 4.2 Strengths and Weaknesses of the
affected by material properties in the medium it spreads and Applied PMI Metric
wave-based effects like interference patterns, harmonic In contrast to the qualitative observer-based evaluation used in the
oscillations, the geometry of the substrate and dampening literature so far, the rather objective, as it is based on a computer
effects. The behavioral response of the animals depends not algorithm, and quantitative motion index metric used here allows
only on the specific frequency, or a specific amplitude, but on for a simple pixel-based assessment of the observed honeybees’
the combination of these two and the measurement point on the motion activity. This analysis reveals more details in the evaluation
honeycomb [14]. showed the threshold for the required signal of vibration signal effects on honeybee behavior. For example,
amplitude. Such a threshold curve indicates the expected set of without such a quantitative approach, it would not have been
minimum signal prerequisites in order to expect a specific possible to generate a model, based on three regression functions,
behavioral response (redrawn as a reference data set in that allows predicting the bees’ responses to specific frequencies in a
Figure 2C). The stimulus intensities applied in our quantitative way. This is a fundamental new piece of evidence that
experiments can be grouped into three distinct regions: In the can be utilized in technological approaches of human-honeybee
range of 50–300 Hz, the stimuli we generated were below the interaction, for example in “smart beehives.” However, this method
predicted behavior response threshold, thus if the prediction of assessment also has its weaknesses and does not evaluate strictly
holds we should not have observed the responses that we did the actual stimulus-behaviour response of the bees themselves, but
observe. In the region of 350–1000 Hz, the stimuli we generated uses rather the resulting optical flow as a proxy for quantification of
were approximately at the threshold level of the behavioral the video frames. But nevertheless, this simple method already
response, thus also here the previous predictions we found in allows quantification of changes in the overall movement patterns
the existing literature need to be questioned, given that the at certain areas on the comb over time, a feature that might suffice
behavioral responses we observed are too significant to assume for informing mean-field model based approaches of this system in
that the sensorial or behavioral threshold was just matched. Such the future. For individual-based models the data would need to be
a match would suggest that we see weak to medium responses, as extracted rather on an individual bee level, with sophisticated image
such thresholds differ across individuals and over time, thus we tracking and individually marked bees. Such systems already exist
should expect only a fraction of the bees in the ROI reacting to and are proven to be effective with honeybees [34–36], however,
such borderline signals. Only for signals in the 1500–2500 Hz these setups demand for much more sophisticated computer
range did the intensity of our signals lie above the threshold curve hardware than we used here, as our method could easily be
described in the literature and thus lead to the predicted performed in an all-in-one solution with a simple low-cost and
behavioral responses. Studies have already shown that the low-energy computing solution, likely even operating on a live
physiological threshold of the subgenual organ of honeybees is datastream and in a closed-loop setup in the near future.
lower than the behavioral threshold [33]. It is possible that the In this work we show that artificially generated vibration
behavioral threshold to vibration intensity was underestimated so patterns on the comb can affect the locomotor activity of bees.
far due to the subjective assessment of the behavioral response. The surface of the honeycomb serves as a communication
In addition, our experiments potentially indicate that stimulus platform through which the vibrations are transmitted. Many
intensities well below the reported behavioral threshold for factors influence the intensity of the signals on the surface of the
signals in the 50–100 Hz frequency range produce the opposite honeycomb [8, 20, 21]. Also in our experiments, the intensity of
effect of a freezing response: The PMI showed a statistically the stimulus decreased very rapidly as a function of distance from
significant increase in motion activity. This behavioral response the emitter, respectively, a very complex intensity pattern
to these vibrational stimuli was previously unknown and, to our emerged, even within the ROI (see Figures 3A–C).
knowledge, is the first time such a behavioral response to an Nevertheless, certain well-defined frequency-amplitude
artificial stimulus has been observed. Our finding result from combinations result in significant downregulation of their
statistical evaluation of the data and does not imply any motion, while others may result in upregulation.
behavioral/biological relevance of this stimulus response. In a Understanding these responses could be a door opener for
second series of experiments measuring the effect of vibration targeted interventions in the signal cascade of the colony.
intensity on behavioral modification, no increase in activity was The dance floor, where the waggle dances occur, is not the
detected with a pure tone of 50 Hz, regardless of intensity (see only the location where information is passed on from returning
Figure 3D). Activating vibration signals are known to occur in foragers to the bees inside the colony, this information is also
natural honeybee colonies, in particular the shaking dance. This further processed by a network of interacting bees, shaping the
signal is reported to cause a non-specific increase in activity [16]. foraging patterns of the colony as a whole [37]. By
However, the frequencies associated with this signal are downregulating the locomotor activity of the bees on the
significantly lower (x 16.3 Hz, S ± 5.8 Hz [15]) than the dance floor via artificial vibrations, the information flow on
frequencies we used in our experiments. The data from our the dance floor will be disturbed and changes in the foraging
experiments suggest that an increase in motion activity in patterns of the colony may arise as a result of this intervention.
Frontiers in Physics | www.frontiersin.org 8 June 2021 | Volume 9 | Article 670555Stefanec et al. Honeybees’ Reactions to Sinusoidal Vibrations
Especially since small interventions in the worker allocation However, during our work we attach great importance to
system, which is composed of many feedback loops [18], could causing as little harm to the animals as possible.
alter individual feedbacks and thus change the way the system
works. If these interventions could be triggered automatically in
a controlled way when dances to potentially hazardous forage AUTHOR CONTRIBUTIONS
sites (like fields freshly sprayed with pesticides) were detected, a
mechanism could be established to protect the colony from a MS developed the core hypothesis in this article together with
potentially fatal foraging decision. Whether or not the potential TS and HO. MS and HO conducted the experiments and
upregulation of motion activity we observed at low frequencies generated the Python code to determine the pixel change.
could potentially be used to stimulate foraging activities requires MS, HO, MB, and TS wrote the text of the article together in a
further studies. collaborative effort. MS designed Figures 1, 4 with input of
MB and TS. MS and HO designed Figures 2, 3 with input of
MB and TS. HO performed the data analyses and
DATA AVAILABILITY STATEMENT implemented the R Code for Figures 2, 3. GH improved
the PMI calculation performance by implementing
The datasets presented in this study can be found at: https:// multiprocessing.
github.com/martin-st/motion-analysis-of-honeybees.
FUNDING
ETHICS STATEMENT
This work was supported by the Field of Excellence “Complexity
According to the animal care principles of our institution and the of Life in Basic Research and Innovation” (COLIBRI) at
current animal protection laws of Austria, experiments on insects University of Graz and the EU H2020 FET-Proactive project
do not fall under animal experiments requiring a permit. “HIVEOPOLIS” (no. 824069).
13. Spangler HG. Suppression of Honey Bee Flight Activity with Substrate
REFERENCES Vibration123. J Econ Entomol (1969) 62:1185–6. doi:10.1093/jee/62.5.1185
14. Michelsen A, Kirchner WH, and Lindauer M. Sound and Vibrational Signals in
1. Klein A-M, Vaissière BE, Cane JH, Steffan-Dewenter I, Cunningham SA, the Dance Language of the Honeybee, Apis mellifera. Behav Ecol Sociobiol
Kremen C, et al. Importance of Pollinators in Changing Landscapes for World (1986) 18:207–12. doi:10.1007/bf00290824
Crops. Proc R Soc B (2007) 274:303–13. doi:10.1098/rspb.2006.3721 15. Gahl RA. The Shaking Dance of Honey Bee Workers: Evidence for Age
2. Gallai N, Salles J-M, Settele J, and Vaissière BE. Economic Valuation of the Discrimination. Anim Behav (1975) 23:230–2. doi:10.1016/0003-3472(75)
Vulnerability of World Agriculture Confronted with Pollinator Decline. Ecol 90068-8
Econ (2009) 68:810–21. doi:10.1016/J.ECOLECON.2008.06.014 16. Schneider SS, and Lewis LA. The Vibration Signal, Modulatory
3. Kearns CA, Inouye DW, and Waser NM. ENDANGERED MUTUALISMS: Communication and the Organization of Labor in Honey Bees, apis
The Conservation of Plant-Pollinator Interactions. Annu Rev Ecol Syst (1998) Mellifera. Apidologie (2004) 35:117–31. doi:10.1051/apido:2004006
29:83–112. doi:10.1146/annurev.ecolsys.29.1.83 17. Hrncir M, Maia-Silva C, and Farina WM. Honey Bee Workers Generate Low-
4. von Frisch K. The Dance Language And Orientation Of Bees (Cambridge, MA: Frequency Vibrations that Are Reliable Indicators of Their Activity Level.
Harvard University Press 2013) (1967) doi:10.4159/harvard.9780674418776 J Comp Physiol A (2019) 205:79–86. doi:10.1007/s00359-018-1305-x
5. Esch H. Über die Schallerzeugung beim Werbetanz der Honigbiene. Z Vergl 18. Anderson C, and Ratnieks FLW. Worker Allocation in Insect Societies:
Physiol (1961) 45:1–11. doi:10.1007/bf00297754 Coordination of Nectar Foragers and Nectar Receivers in Honey Bee (Apis
6. Michelsen A, Towne WF, Kirchner WH, and Kryger P. The Acoustic Near mellifera) Colonies. Behav Ecol Sociobiol (1999) 46:73–81. doi:10.1007/
Field of a Dancing Honeybee. J Comp Physiol (1987) 161:633–43. doi:10.1007/ s002650050595
bf00605005 19. Mariano P, Salem Z, Mills R, Schönwetter-Fuchs-Schistek S, Correia L, and
7. Nieh JC, and Tautz J. Behaviour-locked Signal Analysis Reveals Weak 200- Schmickl T. Evolving Robot Controllers for a Bio-Hybrid System. In: Artificial
300 Hz Comb Vibrations during the Honeybee Waggle Dance. J Exp Biol Life Conference Proceedings. (MIT Press) (2018) p. 155–62.
(2000) 203:1573–9. doi:10.1242/jeb.203.10.1573 20. Sandeman D, Tautz J, and Lindauer M. Transmission of Vibration across
8. Tautz J, Casas J, and Sandeman D. Phase Reversal of Vibratory Signals in Honeycombs and its Detection by Bee Leg Receptors. J Exp Biol (1996) 199:
Honeycomb May Assist Dancing Honeybees to Attract Their Audience. J Exp 2585–94. doi:10.1242/jeb.199.12.2585
Biol (2001) 204:3737–46. doi:10.1242/jeb.204.21.3737 21. Tautz J. Honeybee Waggle Dance: Recruitment success Depends on the Dance
9. Tautz J, and Rohrseitz K. What Attracts Honeybees to a Waggle Dancer? Floor. J Exp Biol (1996) 199:1375–81. doi:10.1242/jeb.199.6.1375
J Comp Physiol A: Sensory, Neural Behav Physiol (1998) 183:661–7. doi:10. 22. R Core Team. R. A Language and Environment for Statistical Computing.
1007/s003590050289 Vienna, Austria: R Foundation for Statistical Computing (2020).
10. Kietzman PM, and Visscher PK. The Anti-waggle Dance: Use of the Stop 23. RStudio Team. RStudio: Integrated Development Environment for R. Boston,
Signal as Negative Feedback. Front Ecol Evol (2015) 3:14. doi:10.3389/fevo. MA: RStudio, PBC (2021).
2015.00014 24. Wickham H, Averick M, Bryan J, Chang W, McGowan L, François R,
11. Nieh JC. The Stop Signal of Honey Bees: Reconsidering its Message. Behav Ecol et al. Welcome to the Tidyverse. Joss (2019) 4:1686. doi:10.21105/joss.
Sociobiol (1993) 33:51–6. doi:10.1007/bf00164346 01686
12. Little HF. Reactions of the Honey Bee, Apis mellifera L., to Artificial Sounds 25. Piepho H-P. An Algorithm for a Letter-Based Representation of All-Pairwise
and Vibrations of Known Frequencies1. Ann Entomol Soc America (1962) 55: Comparisons. J Comput Graphical Stat (2004) 13:456–66. doi:10.1198/
82–9. doi:10.1093/aesa/55.1.82 1061860043515
Frontiers in Physics | www.frontiersin.org 9 June 2021 | Volume 9 | Article 670555Stefanec et al. Honeybees’ Reactions to Sinusoidal Vibrations
26. Simpson J. The Mechanism of Honey-Bee Queen Piping. Z für vergleichende Dances in Honeybees. Front Ecol Evol (2015) 3:103. doi:10.3389/fevo.2015.
Physiologie (1964) 48:277–82. 00103
27. Ohtani T, and Kamada T. ‘Worker Piping’: The Piping Sounds Produced by 35. Boenisch F, Rosemann B, Wild B, Dormagen D, Wario F, and Landgraf T.
Laying and Guarding Worker Honeybees. J Apicultural Res (1980) 19:154–63. Tracking All Members of a Honey Bee colony over Their Lifetime Using
doi:10.1080/00218839.1980.11100016 Learned Models of Correspondence. Front Robot AI (2018) 5:35. doi:10.3389/
28. Hrncir M, Barth FG, and Tautz J. 32 Vibratory and Airborne-Sound Signals in frobt.2018.00035
Bee Communication (Hymenoptera). Insect sounds Commun Physiol Behav 36. Gernat T, Rao VD, Middendorf M, Dankowicz H, Goldenfeld N, and Robinson
Ecol Evol (2005) 421. doi:10.1201/9781420039337.CH32 GE. Automated Monitoring of Behavior Reveals Bursty Interaction Patterns
29. Seeley T, and Tautz Jx. r. Worker Piping in Honey Bee Swarms and its Role in and Rapid Spreading Dynamics in Honeybee Social Networks. Proc Natl Acad
Preparing for Liftoff. J Comp Physiol A: Sensory, Neural Behav Physiol (2001) Sci USA (2018) 115:1433–8. doi:10.1073/pnas.1713568115
187:667–76. doi:10.1007/s00359-001-0243-0 37. Seeley T, Camazine S, and Sneyd J. Collective Decision-Making in Honey Bees:
30. Schlegel T, Visscher PK, and Seeley TD. Beeping and Piping: Characterization How Colonies Choose Among Nectar Sources. Behav Ecol Sociobiol (1991) 28.
of Two Mechano-Acoustic Signals Used by Honey Bees in Swarming. doi:10.1007/BF00175101
Naturwissenschaften (2012) 99:1067–71. doi:10.1007/s00114-012-0990-5
31. Michelsen A, Kirchner WH, Andersen BB, and Lindauer M. The Tooting and Conflict of Interest: The authors declare that the research was conducted in the
Quacking Vibration Signals of Honeybee Queens: a Quantitative Analysis. absence of any commercial or financial relationships that could be construed as a
J Comp Physiol (1986) 158:605–11. doi:10.1007/bf00603817 potential conflict of interest.
32. Kirchner W, Dreller C, and Towne W. Hearing in Honeybees: Operant
Conditioning and Spontaneous Reactions to Airborne Sound. J Comp Copyright © 2021 Stefanec, Oberreiter, Becher, Haase and Schmickl. This is an open-
Physiol A (1991) 168:85–9. doi:10.1007/bf00217106 access article distributed under the terms of the Creative Commons Attribution
33. Kilpinen O, and Storm J. Biophysics of the Subgenual Organ of the Honeybee, License (CC BY). The use, distribution or reproduction in other forums is permitted,
apis Mellifera. J Comp Physiol A (1997) 181:309–18. doi:10.1007/ provided the original author(s) and the copyright owner(s) are credited and that the
s003590050117 original publication in this journal is cited, in accordance with accepted academic
34. Wario F, Wild B, Couvillon MJ, Rojas R, and Landgraf T. Automatic Methods practice. No use, distribution or reproduction is permitted which does not comply
for Long-Term Tracking and the Detection and Decoding of Communication with these terms.
Frontiers in Physics | www.frontiersin.org 10 June 2021 | Volume 9 | Article 670555You can also read