Predictability of COVID-19 Hospitalizations, Intensive Care Unit Admissions, and Respiratory Assistance in Portugal: Longitudinal Cohort Study
←
→
Page content transcription
If your browser does not render page correctly, please read the page content below
JOURNAL OF MEDICAL INTERNET RESEARCH                                                                                                     Patrício et al

     Original Paper

     Predictability of COVID-19 Hospitalizations, Intensive Care Unit
     Admissions, and Respiratory Assistance in Portugal: Longitudinal
     Cohort Study

     André Patrício1, BSc; Rafael S Costa2,3*, PhD; Rui Henriques1,4*, PhD
     1
      Instituto Superior Técnico, Universidade de Lisboa, Lisboa, Portugal
     2
      LAQV-REQUIMTE, NOVA School of Science and Technology, Universidade NOVA de Lisboa, Caparica, Portugal
     3
      IDMEC, Instituto Superior Técnico, Universidade de Lisboa, Lisboa, Portugal
     4
      Instituto de Engenharia de Sistemas e Computadores–Investigação e Desenvolvimento, Lisboa, Portugal
     *
      these authors contributed equally

     Corresponding Author:
     Rafael S Costa, PhD
     LAQV-REQUIMTE
     NOVA School of Science and Technology
     Universidade NOVA de Lisboa
     Campus Caparica, 2829-516
     Caparica, 2829-516
     Portugal
     Phone: 351 21 294 8351
     Email: rs.costa@fct.unl.pt

     Abstract
     Background: In the face of the current COVID-19 pandemic, the timely prediction of upcoming medical needs for infected
     individuals enables better and quicker care provision when necessary and management decisions within health care systems.
     Objective: This work aims to predict the medical needs (hospitalizations, intensive care unit admissions, and respiratory
     assistance) and survivability of individuals testing positive for SARS-CoV-2 infection in Portugal.
     Methods: A retrospective cohort of 38,545 infected individuals during 2020 was used. Predictions of medical needs were
     performed using state-of-the-art machine learning approaches at various stages of a patient’s cycle, namely, at testing
     (prehospitalization), at posthospitalization, and during postintensive care. A thorough optimization of state-of-the-art predictors
     was undertaken to assess the ability to anticipate medical needs and infection outcomes using demographic and comorbidity
     variables, as well as dates associated with symptom onset, testing, and hospitalization.
     Results: For the target cohort, 75% of hospitalization needs could be identified at the time of testing for SARS-CoV-2 infection.
     Over 60% of respiratory needs could be identified at the time of hospitalization. Both predictions had >50% precision.
     Conclusions: The conducted study pinpoints the relevance of the proposed predictive models as good candidates to support
     medical decisions in the Portuguese population, including both monitoring and in-hospital care decisions. A clinical decision
     support system is further provided to this end.

     (J Med Internet Res 2021;23(4):e26075) doi: 10.2196/26075

     KEYWORDS
     COVID-19; machine learning; intensive care admissions; respiratory assistance; predictive models; data modeling; clinical
     informatics

     https://www.jmir.org/2021/4/e26075                                                                 J Med Internet Res 2021 | vol. 23 | iss. 4 | e26075 | p. 1
                                                                                                                      (page number not for citation purposes)
XSL• FO
RenderX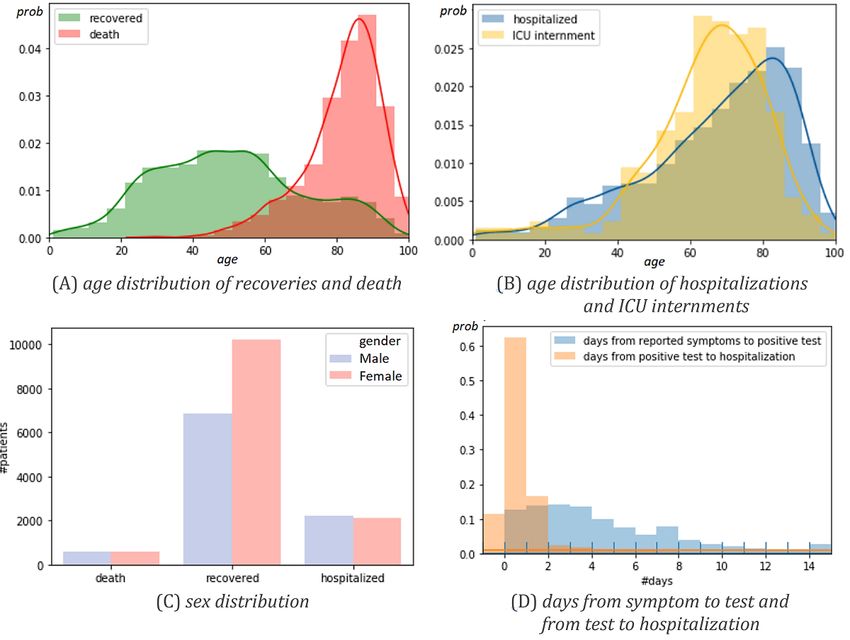
JOURNAL OF MEDICAL INTERNET RESEARCH                                                                                                  Patrício et al

                                                                            This Study
     Introduction
                                                                            This study provides a structured view on the predictability of
     Background                                                             hospitalizations, ICU admissions, respiratory assistance needs,
     COVID-19 is a disease caused by the novel coronavirus                  and survivability outcomes using a retrospective cohort
     SARS-CoV-2, transmissible from person to person and                    encompassing individuals with a SARS-CoV-2–positive result
     associated with acute respiratory complications in severe cases        in Portugal as of June 30, 2020.
     [1,2]. The main symptoms of patients infected are fever, cough,        To this end, and considering demographic, comorbidity, and
     and fatigue; others are asymptomatic [3]. The COVID-19                 care provision variables collected for the infected individuals,
     pandemic presents a substantial threat to global health and has        an assessment methodology was conducted, whereby
     been directly responsible for many deaths. Since the first             state-of-the-art predictive models were hyperparameterized and
     outbreak in December 2019 in Wuhan, China, the number of               robustly evaluated in order to assess the upper bounds on the
     confirmed infected patients worldwide has exceeded 55 million          predictive performance for each one of the targeted variables.
     cases, and nearly 1.3 million people have died from COVID-19           In addition, whenever applicable, this analysis was extended
     [4]. Current literature has shown that infected patients with          toward the various stages of a patient’s cycle: prehospitalization
     specific comorbidities or preconditions (eg, hypertension,             (at the time of testing), after hospitalization, and after ICU
     respiratory problems, diabetes) and of old age are expected to         admission.
     develop a more severe response to the infection and may
     consequently need longer hospitalizations and intensive care           This study offers a solid methodology for the robust assessment
     [5-7]. Strict social confinement measures have been                    of the predictability guarantees of future care needs of infected
     implemented to decrease the COVID-19 R0 value (average                 individuals, contrasting with the dominant correlation-based
                                                                            guarantees in literature. As comparable studies demonstrated
     number of individuals infected by each infected person) and
                                                                            in other populations, it lays a solid ground to compare type-I
     guarantee the optimal use of equipment and beds at normal,
                                                                            and type-II predictive errors and assess population-wise
     continuous, and intensive care units (ICUs). However, although
                                                                            differences.
     public health responses aim to delay the spread of the infection,
     several countries such as the United States, Brazil, Italy, and
     India have faced severe health care crises.                            Methods
     Without effective antiviral drugs and a vaccine, prognostic tools      Overview
     related to COVID-19 are required. Statistical and computational        Complete subpopulations from the target cohort were identified
     models could assist clinical staff in triaging patients at high risk   for each output (Figure 1), guaranteeing the presence of all
     for respiratory failure to better guide the allocation of medical      individuals undertaking the target forms of care (hospitalization,
     resources. Recently, several predictive models ranging from            ICU admission, respiratory support) with a recovery-or-death
     statistical and score-based systems to more recent machine             outcome.
     learning models have been proposed in response to COVID-19.
     Guan et al [8] proposed a Cox regression model to infer potential      After the sampling and data curation steps (Figure 1), we
     risk factors associated with serious adverse outcomes in patients      proceeded to the optimization of data preprocessing options and
     with COVID-19. Univariate and multivariate logistic regression         classifiers’ parameterization for each of the target variables
     models have been used to determine risk factors associated with        separately. To this end, we applied a nested 10-fold
     mortality [9]. Scoring systems have been proposed to predict           cross-validation assessment methodology, whereby we first
     COVID-19 patient mortality but are limited by small sample             create train-test partitions (outer cross-validation) to assess the
     sizes, with a poor discriminatory ability [10-12]. Other statistical   performance of an optimized classification method, and within
     approaches have also been emerging to aid prognostics [13,14].         each training fold we further create train-test partitions (inner
     Complementarily, machine learning methods offer the possibility        cross-validation) for hyperparameterizing the predictive model
     to model more complex data relationships, generally yielding           under assessment. This methodology guarantees that all
     powerful capabilities to predict outcomes of infectious and            observations are used to assess the final performance and
     noninfectious diseases in medical practice [15-17]. To this end,       prevents biases as hyperparameterization takes place within
     classification and regression models have been proposed for            each training folds.
     risk stratification of patients and to screen the spread of            Within each inner train-test fold, Bayesian optimization [29]
     COVID-19 [18-20]. Despite the inherent potentialities of               was applied to find the hyperparameters that best fit the pipeline.
     ongoing efforts, studies in the context of COVID-19 are limited        The optimization measures are:
     by either the size of available cohorts or the lack of a systematic
     comparison of different models [21-24], and generally neglect          •   F1 score and 0.7 × recall + 0.3 × precision for binary
     the predictability of medical needs (instead the focus is                  classes. These two views generate two sets of classifiers:
     commonly placed on measurable disease factors, early detection             one that equally weights recall-and-precision views, and
     of infection, and mortality risk prediction [25-28]). None of              other that, similar to the F2 score (Fβ, where β=2),
     these studies have comprehensively targeted the Portuguese                 prioritizes the optimization of the true-positive rate (recall)
     population at the present time.                                            at the cost of a lower positive predictive value (precision);
                                                                            •   Cohen kappa and average class recall for target variables
                                                                                with more than 2 classes (respiratory support).

     https://www.jmir.org/2021/4/e26075                                                              J Med Internet Res 2021 | vol. 23 | iss. 4 | e26075 | p. 2
                                                                                                                   (page number not for citation purposes)
XSL• FO
RenderX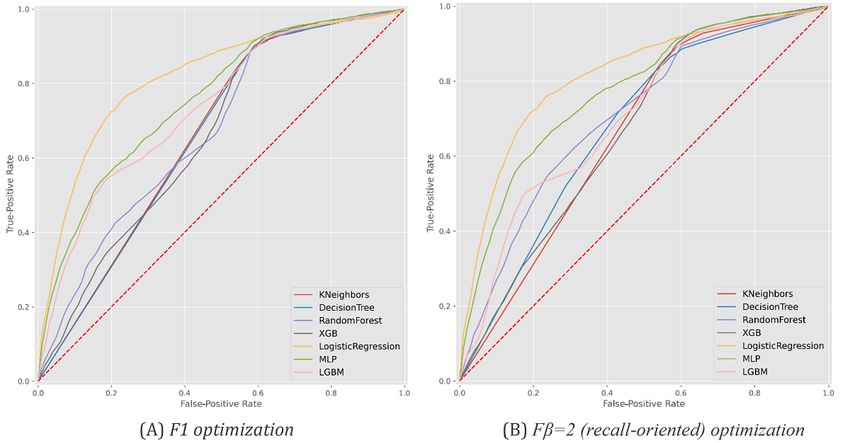
JOURNAL OF MEDICAL INTERNET RESEARCH                                                                                                         Patrício et al

     Figure 1. Exclusion and inclusion criteria for composing the outcome-conditional cohorts: hospitalization, respiratory assistance support, intensive
     care unit (ICU) admission, and survivability. Blank/unknown cells in the Direcção-Geral da Saúde data set are classified as missing values.

     Hospitalization, UCI admission, respiratory support, and                   performance is generally coincident with the best predictive
     recovery-or-death outcomes for SARS-CoV-2–infected                         model and thus not always disclosed in the Results section to
     individuals are considerably imbalanced, hence, the relevance              allow the identification of the best underlying predictors. We
     of the placed recall-precision and multiclass recall views. In             considered the implementations provided in the scikit-learn
     particular, considering both a balanced recall-precision                   [30] and xgboost [31] packages in Python (Python Software
     optimization and recall-oriented optimization is relevant for              Foundation). For each classifier, all supported parameters in
     clinical decisions. When the allocated teams have capacity to              scikit-learn were subjected to hyperparameterization. Regarding
     remotely monitor SARS-CoV-2–infected patients, the predictive              the MLP, we placed upper limits on the number of hidden layers
     models optimized with a schema that prioritizes recall should              (3) and nodes per layer (20) given the low-dimensionality nature
     be pursued to guarantee that no vulnerable patient is left out.            of the target data set. The hyperparameters were subjected to a
     Nevertheless, when monitoring capacity is limited, greater                 total of 50 iterations. Multimedia Appendix 1 displays the
     attention to precision is necessary, and only more vulnerable              optimized parameters for the best-performing predictive models
     patients (as suggested by the predictive models optimized with             per outcome.
     balanced recall-precision views) should be attemptively
                                                                                Differences in performance from the paired-error estimates
     monitored.
                                                                                collected per fold were statistically tested using t tests when
     The allowed preprocessing options are as follows: imputation               estimates passed the Shapiro–Wilk normality test. When this
     of missing values using median-mode imputation, KNNImputer,                condition was not satisfied, Wilcoxon signed-rank tests were
     or none; class balancing using subsampling, oversampling,                  applied.
     SMOTE (Synthetic Minority Oversampling Technique), or
                                                                                In addition to the conducted analysis, the best predictors trained
     none; and normalization of real-valued variables using
                                                                                on the whole data set were made available within a clinical
     standardization, scaling, or none. The selected classifiers are as
                                                                                decision support system built using flask technology and dash
     follows: Bernoulli naive Bayes, Gaussian naive Bayes, k-nearest
                                                                                facilities in Python [32], which can run as an offline web
     neighbors (KNN), decision tree (DT), random forest, XGBoost
                                                                                application.
     (XGB), logistic regression, Light Gradient Boosting Machine
     (LightGBM), Super Learner, and multilayer perceptron (MLP).                Data Source
     Super Learner uses folding to hyperparameterize models and                 A retrospective cohort (from March 1 to June 30, 2020) of
     selects predictors for out-of-fold predictions from individual             patients with confirmed COVID-19 in Portugal was used in this
     performance estimates per fold. In this context, Super Learner’s
     https://www.jmir.org/2021/4/e26075                                                                     J Med Internet Res 2021 | vol. 23 | iss. 4 | e26075 | p. 3
                                                                                                                          (page number not for citation purposes)
XSL• FO
RenderX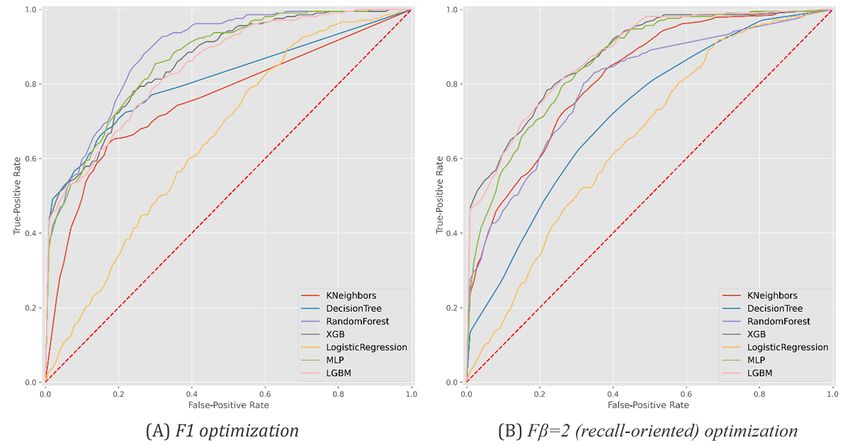
JOURNAL OF MEDICAL INTERNET RESEARCH                                                                                                Patrício et al

     study. The anonymized data set was provided by the Directorate       negative after positive testing) and 1155 deaths. Four individuals
     General of Health (Direcção-Geral da Saúde, DGS), the                were excluded from the data set due to inconsistent recordings
     Portuguese health authority. The gathered data, called the           related to age and pregnancy-gender variables. Table 1 provides
     covid19-DGS database, contains information pertaining to the         essential statistics. Figure 2 further describes sex and age
     demographic and clinical patient characteristics as well as          distributions in deaths, hospitalizations, ICU admissions, and
     preexisting conditions.                                              average number of days from symptom onset (traced by the
                                                                          public health line for COVID-19) to a positive test result and
     Data are available upon reasonable request.
                                                                          hospitalization.
     Ethical Considerations                                               Within the target population, there were 4326 hospitalizations
     The COVID-19 data set is provided by the DGS under the               (11.2% of population base) and 253 admissions to the ICU
     collaborative score4COVID research project proposal. The tasks       (5.8% of hospitalizations). Among ICU internments, there were
     conducted in the score4COVID project were further validated          82 recoveries and 61 deaths. In terms of respiratory support, a
     by the Ethical Committee of the NOVA School of Science and           total of 180 individuals undertook assisted ventilation, 292
     Technology.                                                          submitted to oxygen therapy, and 9 underwent alternative modes
                                                                          of respiratory support such as extracorporeal membrane
     Results                                                              oxygenation.

     Results on the predictability of hospitalization needs, ICU          The major classes of comorbidities monitored were neoplasm,
     admissions, respiratory assistance, and outcome of infected          diabetes, asthma, pulmonary, hepatic, hematological, renal,
     individuals living in Portugal, as of June 30, 2020, are discussed   neurological, neuromuscular, and immune deficiency conditions.
     below.                                                               The representativity of individuals with one or more
                                                                          comorbidities, as well as their impact on survivability, is
     Cohort Characteristics                                               depicted in Figure 3.
     The target cohort comprised 38,545 individuals who were
     SARS-CoV-2 positive: 17,046 recoveries (SARS-CoV-2

     https://www.jmir.org/2021/4/e26075                                                            J Med Internet Res 2021 | vol. 23 | iss. 4 | e26075 | p. 4
                                                                                                                 (page number not for citation purposes)
XSL• FO
RenderX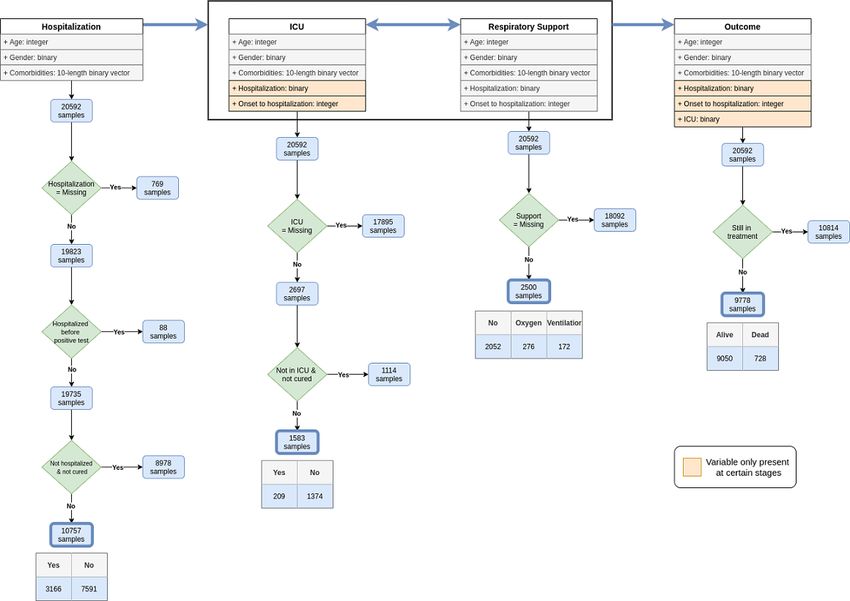
JOURNAL OF MEDICAL INTERNET RESEARCH                                                                                   Patrício et al

     Table 1. Characteristics of SARS-CoV-2–infected patients in the target cohort.
         Characteristic                                                                Value
         Numeric variables, mean (SD); range
             Age at notification (years)                                               48.3 (22.1); 0-105
             Onset to hospitalization (days)                                           1.1 (5.1); 0-169
         Categoric variables, n (%)
             Gender
                  Female                                                               11,252 (54.64)
                  Male                                                                 9340 (45.36)
             Hospitalization
                  Yes                                                                  16,651 (84.00)
                  No                                                                   3172 (16.00)
                  a
             ICU admission
                  Yes                                                                  209 (7.75)
                  No                                                                   2488 (92.25)
             Respiratory support
                  Oxygen therapy                                                       276 (11.04)
                  Assisted ventilation                                                 172 (6.88)
                  No support                                                           2052 (82.08)
             Comorbidities
                  Cancer                                                               940 (4.56)
                  Cardiac disease                                                      3025 (14.69)
                  Diabetes                                                             2134 (10.36)
                  Immune deficiency                                                    222 (1.08)
                  Renal disease                                                        718 (3.49)
                  Liver disease                                                        206 (1.00)
                  Lung disease                                                         794 (3.86)
                  Chronic neurological disease                                         1087 (5.28)
             Mortality
                  Yes                                                                  728 (7.45)
                  No                                                                   9050 (92.55)

     a
         ICU: intensive care unit.

     https://www.jmir.org/2021/4/e26075                                               J Med Internet Res 2021 | vol. 23 | iss. 4 | e26075 | p. 5
                                                                                                    (page number not for citation purposes)
XSL• FO
RenderX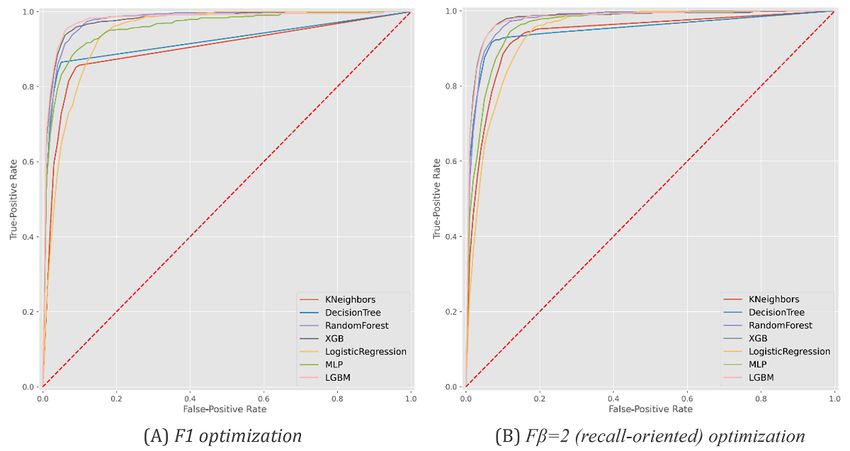
JOURNAL OF MEDICAL INTERNET RESEARCH                                                                                                           Patrício et al

     Figure 2. Cohort statistics: (A-C) demographic distribution of infected individuals with known outcome (death and recovery) and stage in the care life
     cycle (hospitalization and intensive care unit [ICU] admission); (D) average number of days between care stages (the plotted negative bin [ie, negative
     occurrences] corresponds to hospitalizations before SARS-CoV-2 testing).

     Figure 3. Cohort statistics: (A) distribution of individuals with one or more comorbidities among deaths, recovered cases, and hospitalizations; and
     (B) association between individual comorbidities and survivability outcomes.

                                                                                  they are tested as SARS-CoV-2 positive given their (1)
     Hospitalization                                                              demographic group (age and gender) and (2) comorbidity
     Figure 4 and Table 2 provide results pertaining to the models’               factors. Comorbidity factors were categorized in accordance
     ability to predict the need for individuals to be hospitalized once          with the presence or absence of kidney, asthma, lung, cancer,
     https://www.jmir.org/2021/4/e26075                                                                       J Med Internet Res 2021 | vol. 23 | iss. 4 | e26075 | p. 6
                                                                                                                            (page number not for citation purposes)
XSL• FO
RenderX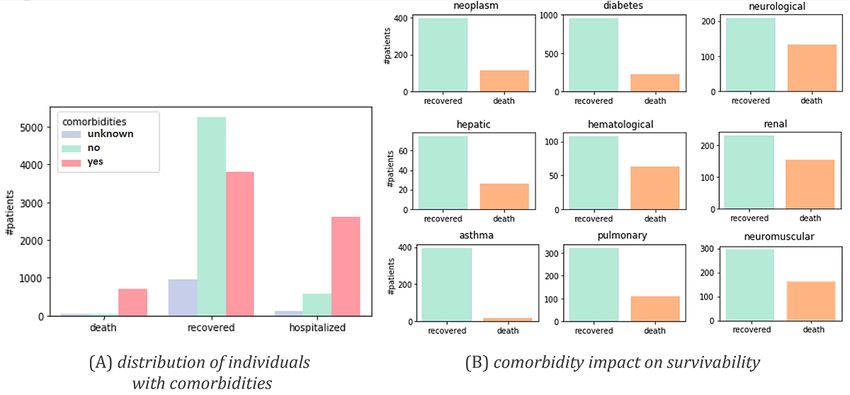
JOURNAL OF MEDICAL INTERNET RESEARCH                                                                                                            Patrício et al

     neuromuscular, diabetes, HIV, cardiac, and pregnancy                         approximate 55% precision, meaning that more than half of the
     conditions. Nonhospitalized individuals without a clear outcome              predicted hospitalization needs were in fact observed. Logistic
     (recovery or death) were excluded from this analysis. Figure 5               regression and MLP were the best-performing classification
     provides the receiver operating characteristic curve per predictor           models according to F1-score and recall, respectively. Statistical
     for each optimization setting.                                               superiority was verified for logistic regression but not MLP
                                                                                  against peer models (at =.05). These results provide empirical
     Generally, we observed that nearly 90% of hospitalization needs
                                                                                  evidence toward the role of these predictors in supporting
     could be identified at the time of SARS-CoV-2 testing. This
                                                                                  individual remote monitoring decisions.
     level of recall/sensitivity was observed at the expense of an
     Figure 4. Predictability of hospitalizations for individuals testing SARS-CoV-2 positive. Recall, precision, and F1 for the best predictors in F1 (left)
     and recall-oriented (right) scores on the validation set after nested cross-validation. MPL: multilayer perceptron.

     https://www.jmir.org/2021/4/e26075                                                                        J Med Internet Res 2021 | vol. 23 | iss. 4 | e26075 | p. 7
                                                                                                                             (page number not for citation purposes)
XSL• FO
RenderX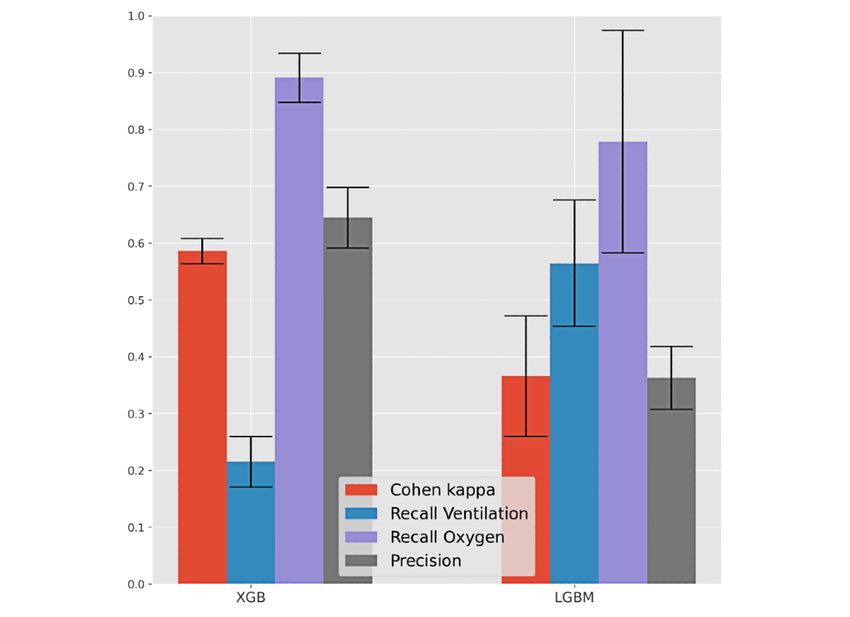
JOURNAL OF MEDICAL INTERNET RESEARCH                                                                                                                 Patrício et al

     Table 2. Predictability of hospitalizations per predictive model.
         Model                            F1 optimization, mean (SD)                                Recall-oriented (Fβ=2) optimization, mean (SD)

                                          F1-score                     Recall                       F1-score                            Recall
               a                          0.544 (0.007)                0.883 (0.020)                0.545 (0.005)                       0.890 (0.017)
         KNN

         DTb                              0.562 (0.030)                0.837 (0.069)                0.548 (0.004)                       0.897 (0.007)

         RFc                              0.535 (0.010)                0.878 (0.016)                0.541 (0.005)                       0.874 (0.029)

         XGBd                             0.546 (0.004)                0.897 (0.012)e               0.545 (0.004)                       0.895 (0.011)

         LRf                              0.582 (0.006)e               0.878 (0.015)                0.583 (0.010)e                      0.879 (0.015)

         MLPg                             0.549 (0.006)                0.892 (0.010)                0.551 (0.003)                       0.897 (0.011)e

         LGBMh                            0.545 (0.005)                0.893 (0.013)                0.545 (0.005)                       0.893 (0.016)

     a
         KNN: k-nearest neighbors.
     b
         DT: decision tree.
     c
         RF: random forest.
     d
         XGB: XGBoost.
     e
         Best-performing models
     f
      LR: logistic regression.
     g
         MLP: multilayer perceptron.
     h
         LGBM: LightGBM.

     Figure 5. Receiver operating characteristic curves with the predictive behavior of the selected classifiers in asserting hospitalization needs at the time
     of SARS-CoV-2 testing. XGB: XGBoost, MLP: multilayer perceptron, LGBM: LightGBM.

                                                                                        proposed methodology was pursued considering demographic
     ICU Admissions                                                                     factors, comorbidity factors, and the time to hospitalization for
     Figures 6 and 7 and Table 3 assess the ability to anticipate                       hospitalized    individuals.      Individuals     without       a
     intensive care needs for infected individuals at two stages: before                SARS-CoV-2–negative test result after infection were excluded.
     hospitalization and after hospitalization. To this end, the

     https://www.jmir.org/2021/4/e26075                                                                             J Med Internet Res 2021 | vol. 23 | iss. 4 | e26075 | p. 8
                                                                                                                                  (page number not for citation purposes)
XSL• FO
RenderX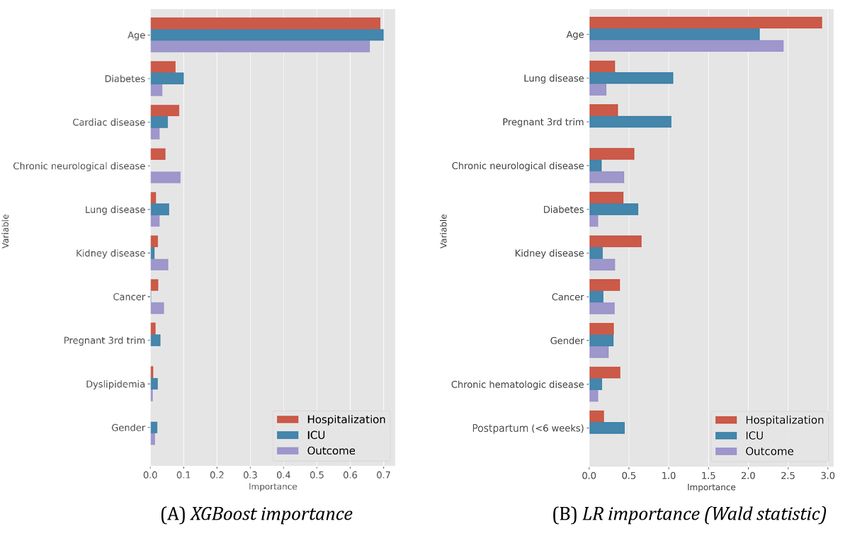
JOURNAL OF MEDICAL INTERNET RESEARCH                                                                                                            Patrício et al

     Figure 6. Predictability of intensive care unit admission. Results for the best F1 predictor (left) and recall-oriented predictor (right). XGB: XGBoost.

     Figure 7. Receiver operating characteristic curves with the predictive behavior of the selected classifiers in predicting intensive care unit admission
     needs at the time of hospitalization. XGB: XGBoost, MLP: multilayer perceptron, LGBM: LightGBM.

     https://www.jmir.org/2021/4/e26075                                                                        J Med Internet Res 2021 | vol. 23 | iss. 4 | e26075 | p. 9
                                                                                                                             (page number not for citation purposes)
XSL• FO
RenderX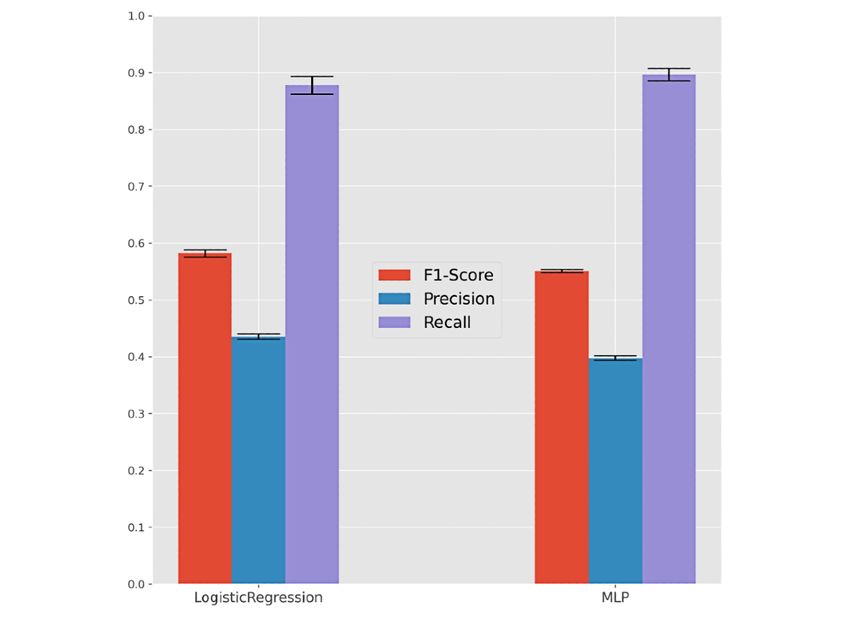
JOURNAL OF MEDICAL INTERNET RESEARCH                                                                                                               Patrício et al

     Table 3. Predictability of intensive care unit admissions per predictive model.
         Model                            F1 optimization, mean (SD)                                Fβ=2 (recall-oriented) optimization, mean (SD)

                                          F1-score                     Recall                       F1-score                          Recall
         At the time of hospitalization

             KNNa                         0.428 (0.039)                0.574 (0.156)                0.369 (0.037)                     0.741 (0.088)

             DTb                          0.461 (0.016)                0.651 (0.056)                0.309 (0.083)                     0.904 (0.033)c

             RFd                          0.454 (0.027)                0.713 (0.088)c               0.382 (0.103)                     0.794 (0.128)

             XGBe                         0.505 (0.040)c               0.541 (0.074)                0.431 (0.040)                     0.766 (0.084)

             LRf                          0.250 (0.015)                0.622 (0.041)                0.248 (0.013)                     0.651 (0.074)

             MLPg                         0.449 (0.060)                0.703 (0.145)                0.410 (0.039)                     0.818 (0.050)

             LGBMh                        0.480 (0.023)                0.536 (0.048)                0.435 (0.025)c                    0.770 (0.051)

         At the time of SARS-CoV-2 testing
             KNN                          0.195 (0.016)                0.818 (0.090)                0.198 (0.007)                     0.852 (0.039)
             DT                           0.209 (0.012)                0.752 (0.135)                0.201 (0.007)                     0.890 (0.036)
             RF                           0.200 (0.008)                0.880 (0.038)                0.200 (0.008)                     0.880 (0.044)
             XGB                          0.205 (0.009)                0.857 (0.058)                0.203 (0.004)                     0.914 (0.032)
             LR                           0.200 (0.008)                0.847 (0.054)                0.201 (0.007)                     0.880 (0.034)
             MLP                          0.202 (0.006)                0.871 (0.049)                0.200 (0.008)                     0.880 (0.037)
             LGBM                         0.204 (0.012)                0.871 (0.074)                0.197 (0.012)                     0.861 (0.066)

     a
         KNN: k-nearest neighbors.
     b
         DT: decision tree.
     c
         Best-performing models.
     d
         RF: random forest.
     e
         XGB: XGBoost.
     f
      LR: logistic regression.
     g
         MLP: multilayer perceptron.
     h
         LGBM: LightGBM.

     The predictability of ICU needs is less satisfactory than                          Demographic, comorbidity, and time-to-hospitalization factors
     hospitalization needs, particularly for the prehospitalization                     were used as input variables.
     stage. We hypothesize that this difficulty was partially related
                                                                                        Individuals without a SARS-CoV-2–negative test result after
     to the smaller number of individuals with ICU internments,
                                                                                        infection were excluded from this analysis. As respiratory
     together with the presence of missing values associated with
                                                                                        support is a multiclass variable, we considered a different
     ICU internment needs for most individuals. Even though we
                                                                                        performance evaluation by focusing on (1) the recall for each
     can achieve recall levels over 90% with gradient boosting
                                                                                        major class (ventilation, oxygen, and nonrequired support), (2)
     (XGBoost) in a posthospitalization setting, it comes at the cost
                                                                                        the precision of individuals with oxygen or ventilation
     of a considerably low precision (with one-third of predictions
                                                                                        assistance, and (3) the Cohen kappa coefficient.
     seen in practice). Still, the best-performing predictive models
     are suggested to support monitoring decisions at the hospital                      XGBoost, LightGBM, and random forests attained a satisfactory
     bedside, as their recall and specificity are considerably high.                    identification of hospitalized individuals who may require
                                                                                        respiratory support in the future, generally providing recalls for
     Respiratory Support                                                                each assistance mode around 60% at the cost of a 40% precision.
     Figure 8 and Table 4 assess respiratory assistance needs for                       According to the conducted methodology, they are thus
     hospitalized individuals with SARS-CoV-2, considering three                        pinpointed as good candidates to support in-hospital care
     assistance modes: (1) ventilation support, (2) oxygen therapy,                     decisions.
     and (3) combined ventilation and oxygen therapies.

     https://www.jmir.org/2021/4/e26075                                                                         J Med Internet Res 2021 | vol. 23 | iss. 4 | e26075 | p. 10
                                                                                                                               (page number not for citation purposes)
XSL• FO
RenderX
JOURNAL OF MEDICAL INTERNET RESEARCH Patrício et al
Figure 8. Predictability of respiratory support needs—assisted ventilation, oxygen therapy, and combined support—for hospitalized individuals with
SARS-CoV-2. Performance of the best F1 predictor (right) and recall-oriented predictor (left) is shown. XGB: XGBoost, LGBM: LightGBM.
Table 4. Predictability of respiratory needs per predictive model.
Model Kappa optimization, kappa, mean (SD) Recalls optimization average, kappa, mean (SD)
KNNa 0.324 (0.050) 0.162 (0.022)
DTb 0.708 (0.017)c 0.110 (0.126)
RFd 0.518 (0.013) 0.017 (0.014)
XGBe 0.586 (0.022) 0.043 (0.013)
LRf 0.080 (0.009) 0.070 (0.009)
MLPg 0.464 (0.046) 0.204 (0.164)
LGBMh 0.567 (0.037) 0.366 (0.106)c
a
KNN: k-nearest neighbors.
b
DT: decision tree.
c
Best-performing models.
d
RF: random forest.
e
XGB: XGBoost.
f
LR: logistic regression.
g
MLP: multilayer perceptron.
h
LGBM: LightGBM.
https://www.jmir.org/2021/4/e26075 J Med Internet Res 2021 | vol. 23 | iss. 4 | e26075 | p. 11
(page number not for citation purposes)
XSL• FO
RenderXJOURNAL OF MEDICAL INTERNET RESEARCH Patrício et al
Survivability (Outcome) Our results showed a high ability to identify death outcomes.
Finally, Figures 9 and 10 and Table 5 provide an analysis of However, at the SARS-CoV-2 testing stage, this comes at a cost
the ability of the models to predict recovery-or-death outcomes of incorrectly classifying two-thirds of individuals susceptible
for individuals with SARS-CoV-2 infection at three time points: to death. In the posthospitalization scenario, we achieved more
(1) before hospitalization (at the time of testing), (2) after balanced results, with both precision and recall around 75%
hospitalization, and (3) after ICU admission when applicable. using gradient boosting (XGBoost and LightGBM). The
To this end, we preserved the input variables and validation introduction of the intensive care variable hampered the results
methodology (see Methods section) considered in previous since it restricted the analysis of deaths to individuals with acute
scenarios. needs and dependent on continuous care instruments.
Figure 9. Predictability of the survivability (outcome) of infected individuals at 3 stages. Results for the best F1 predictor (left) and recall-optimized
predictor (right) per stage are shown. XGB: XGBoost, LGBM: LightGBM.
Figure 10. Receiver operating characteristic curves with the predictive behavior of the selected classifiers in asserting patient survivability at the time
of hospitalization. XGB: XGBoost, MLP: multilayer perceptron, LGBM: LightGBM.
https://www.jmir.org/2021/4/e26075 J Med Internet Res 2021 | vol. 23 | iss. 4 | e26075 | p. 12
(page number not for citation purposes)
XSL• FO
RenderXJOURNAL OF MEDICAL INTERNET RESEARCH Patrício et al
Table 5. Predictability of survivability per predictive model.
Model F1 optimization, mean (SD) Fβ=2 (recall-oriented) optimization, mean (SD)
F1-score Recall F1-score Recall
At the time of hospitalization
KNNa 0.616 (0.035) 0.735 (0.048) 0.546 (0.021) 0.901 (0.030)
DTb 0.707 (0.013) 0.864 (0.011) 0.673 (0.022) 0.908 (0.017)
RFc 0.696 (0.030) 0.901 (0.030) 0.666 (0.021) 0.666 (0.021)
XGBd 0.765 (0.025) 0.834 (0.042) 0.726 (0.008) 0.920 (0.022)
LRe 0.492 (0.012) 0.909 (0.019) 0.476 (0.035) 0.916 (0.022)
MLPf 0.681 (0.024) 0.824 (0.027) 0.569 (0.020) 0.922 (0.023)
LGBMg 0.761 (0.017) 0.874 (0.016) 0.717 (0.036) 0.922 (0.021)
At the time of intensive care unit admission
KNN 0.582 (0.040) 0.740 (0.053) 0.527 (0.030) 0.885 (0.049)
DT 0.652 (0.045) 0.879 (0.035) 0.638 (0.032) 0.922 (0.023)
RF 0.630 (0.018) 0.908 (0.039) 0.587 (0.035) 0.941 (0.016)
XGB 0.703 (0.035) 0.838 (0.068) 0.672 (0.021) 0.918 (0.051)
LR 0.497 (0.018) 0.908 (0.031) 0.470 (0.049) 0.920 (0.028)
MLP 0.633 (0.044) 0.790 (0.094) 0.529 (0.019) 0.935 (0.020)
LGBM 0.701 (0.025) 0.886 (0.034) 0.672 (0.024) 0.915 (0.027)
a
KNN: k-nearest neighbors.
b
DT: decision tree.
c
RF: random forest.
d
XGB: XGBoost.
e
LR: logistic regression.
f
MLP: multilayer perceptron.
g
LGBM: LightGBM.
for the assessed predictive models, Figures 11 and 12 illustrate
Determinants of Predictability the importance of the top features. To this end, we considered
To assess the determinant factors underlying the achieved relevance outputs from gradient boosting (XGBoost) due to its
predictability levels, we first statistically tested the correlation competitively high performance across all outcomes, as well as
between input and output variables using chi-square tests, the logistic regression for the hospitalization outcome by
ANOVA (analysis of variance), and their nonparametric computing the Wald statistic to assess the significance of the
counterparts, yielding results similar to those by Nogueira et al coefficients for predictions.
[33]. For a more in-depth understanding of the feature relevance
https://www.jmir.org/2021/4/e26075 J Med Internet Res 2021 | vol. 23 | iss. 4 | e26075 | p. 13
(page number not for citation purposes)
XSL• FO
RenderXJOURNAL OF MEDICAL INTERNET RESEARCH Patrício et al
Figure 11. Top features and their importance for each target variable at the time of SARS-CoV-2 testing (prehospitalization). ICU: intensive care unit,
LR: logistic regression.
We can observe that XGBoost distinguishes the relevance of of this variable consistently had top rank among associative
different comorbidities for the target variables along each stage models—XGBoost, random forests, and decision
of the care process. In addition to the age variable, the onset trees—pinpointing the importance of its collection for
period to hospitalization in days was also found to be a critical computer-aided predictions of ICU internment and respiratory
factor affecting the decisions (Figure 12). The high relevance needs.
Figure 12. XGBoost top features and their importance for the different outcomes at posthospitalization. ICU: intensive care unit.
Complementarily, Figure 13 offers additional insights into the be paid to the differences between true positives and false
target predictive tasks by plotting some of the characteristics negatives, that is, to the individuals requiring care, in order to
of the correctly classified individuals against incorrectly guarantee their timely and proper assistance. The susceptibility
classified individuals with XGBoost. Particular attention should
https://www.jmir.org/2021/4/e26075 J Med Internet Res 2021 | vol. 23 | iss. 4 | e26075 | p. 14
(page number not for citation purposes)
XSL• FO
RenderXJOURNAL OF MEDICAL INTERNET RESEARCH Patrício et al
to false negatives is higher for individuals within the 40-60-year age category and without comorbidities.
Figure 13. The characteristics of incorrectly predicted individuals with XGBoost. Particular attention should be paid to the differences between
true-positive and false-negative individuals given their clinical relevance. ICU: intensive care unit.
the care cycle (testing, hospitalization, ICU admission) for the
Clinical Decision Support System different outcome variables (care needs) after inserting essential
The learned predictive models based on simple variables (stage, demographic and comorbidity features. The output provides a
age, gender, and comorbidities) have been made available to bounded statistic based on the estimation returned by the
health care providers within a recommendation system with predictive models achieving better recall and F1-measure for
graphical facilities. The serialized predictive models are used each outcome variable. Figure 14 provides a visualization of
for the efficient testing of individuals at the different stages of the graphical interface.
https://www.jmir.org/2021/4/e26075 J Med Internet Res 2021 | vol. 23 | iss. 4 | e26075 | p. 15
(page number not for citation purposes)
XSL• FO
RenderXJOURNAL OF MEDICAL INTERNET RESEARCH Patrício et al
Figure 14. Snapshot of the provided clinical decision support system.
The variables required for each outcome score calculation are (with >50% precision); (4) death risk along different stages
usually available at hospitals, and the tool is easy to use. (testing time, after hospitalization, and after ICU admission)
Although recommendations are provided within a statistical had the highest degree of predictability.
frame, the tool does not categorize the risk into low- or high-risk
The predictive models yielding better accuracy performance
patients as clinical experts are more informed to approximate
were associative classifiers, particularly XGBoost and
this risk. In addition, we advise caution for clinicians who intend
RandomForests, neural networks with hyperparameterized
to use this tool as a predictive guide, especially for survivability
architectures, and logistic regressors, with the optimal choice
analysis. Clinicians must balance the predictions from this tool
varying in accordance with the target variable and evaluation
against their practical experience.
measure.
In collaboration with DGS, our predictors are expected to be
Publications on COVID-19 using machine learning models for
provided within public hospitals and care contact centers of the
different outcomes have been rapidly increasing. Gao et al [35]
Portuguese Health Service (Serviço Nacional de Saúde),
developed a model that includes the mortality risk prediction
particularly to support remote care monitoring decisions.
and reported an F1 ranging from 0.65 to 0.69 (κ=0.61-0.65), in
The decision support system is available as a software tool on line with our findings. Alternative studies [28,36,37] offer
GitHub [34]. additional results for generalizing results and identifying
population-specific differences. Yet, most of these studies do
Discussion not comprehensively assess models’ performance or the cohort
characteristics, impeding solid cross-population findings.
Principal Findings
Limitations
This work offers a discussion on the predictability of
hospitalization needs, ICU admissions, respiratory assistance, This study has some inherent shortcomings that should be noted:
and survivability outcome in individuals infected with (1) the number of clinical variables for the outcomes of interest
SARS-CoV-2 in Portugal as of June 30, 2020. A retrospective were limited (eg, BMI and clinical symptoms were missing);
cohort with all confirmed COVID-19 cases since March, (2) further external validation of the selected models is required;
encompassing demographic and comorbidity variables, was and (3) although some inconsistencies (listed in the Cohort
considered as the target population in this study. Description section) and missing/unknown entries in the original
DGS data set were excluded, data acquisition problems may
The results for the given cohort reveal that (1) over 75% of still persist and influence the outcomes of this work. The fully
hospitalization needs can be identified at the time of autonomous and parameter-free nature of the proposed
SARS-CoV-2 testing (with >50% precision); (2) ICU needs are computational approach/models allows it to be dynamically
generally less predictable at both the pre- and posthospitalization retrained with updated data.
stages in the given cohort; (3) respiratory assistance needs
(including ventilation support, oxygen therapy, and combined
ventilation-oxygen support) achieved recall levels above 60%
https://www.jmir.org/2021/4/e26075 J Med Internet Res 2021 | vol. 23 | iss. 4 | e26075 | p. 16
(page number not for citation purposes)
XSL• FO
RenderXJOURNAL OF MEDICAL INTERNET RESEARCH Patrício et al
Concluding Remarks Portuguese population, including both remote monitoring and
In this work, we developed a web-based clinical decision support in-hospital care decisions. Predicting the most probable
tool without biological variables as input that can be used by outcomes along the life cycle of a SARS-CoV-2–infected
clinicians. The conducted work pinpoints the relevance of the individual can identify patients who are expected to develop
proposed predictive models to aid medical decisions for the severe illness, thus optimizing the allocation of health care
resources and supporting more vulnerable patients.
Acknowledgments
The authors thank Portuguese Directorate General of Health (DGS) for providing the data. Data are available upon reasonable
request. This work was supported by Fundação para a Ciência e a Tecnologia (FCT), through IDMEC, under LAETA project
(UIDB/50022/2020), IPOscore (DSAIPA/DS/0042/2018) and Data2Help (DSAIPA/AI/ 0044/2018) projects, the contract
CEECIND/01399/2017 to RSC, FCT/MCTES funds for INESC-ID (UIDB/50021/2020) and the Associate Laboratory for Green
Chemistry - LAQV (UIDB/50006/2020 and UIDP/50006/2020).
Conflicts of Interest
None declared.
Multimedia Appendix 1
Optimized parameters for the best-performing classifiers (Figures 4, 6, 8, and 9).
[PNG File , 71 KB-Multimedia Appendix 1]
References
1. Chan J, Yuan S, Kok K, To K, Chu H, Yang J, et al. A familial cluster of pneumonia associated with the 2019 novel
coronavirus indicating person-to-person transmission: a study of a family cluster. The Lancet 2020 Feb;395(10223):514-523.
[doi: 10.1016/s0140-6736(20)30154-9]
2. Zhu N, Zhang D, Wang W, Li X, Yang B, Song J, et al. A Novel Coronavirus from Patients with Pneumonia in China,
2019. N Engl J Med 2020 Feb 20;382(8):727-733. [doi: 10.1056/nejmoa2001017]
3. Fu L, Wang B, Yuan T, Chen X, Ao Y, Fitzpatrick T, et al. Clinical characteristics of coronavirus disease 2019 (COVID-19)
in China: A systematic review and meta-analysis. J Infect 2020 Jun;80(6):656-665 [FREE Full text] [doi:
10.1016/j.jinf.2020.03.041] [Medline: 32283155]
4. World Health Organization. URL: https://www.who.int [accessed 2020-09-01]
5. Singh AK, Gupta R, Ghosh A, Misra A. Diabetes in COVID-19: Prevalence, pathophysiology, prognosis and practical
considerations. Diabetes Metab Syndr 2020 Jul;14(4):303-310 [FREE Full text] [doi: 10.1016/j.dsx.2020.04.004] [Medline:
32298981]
6. Sanyaolu A, Okorie C, Marinkovic A, Patidar R, Younis K, Desai P, et al. Comorbidity and its Impact on Patients with
COVID-19. SN Compr Clin Med 2020 Jun 25;2(8):1-8 [FREE Full text] [doi: 10.1007/s42399-020-00363-4] [Medline:
32838147]
7. Wang Y, Lu X, Li Y, Chen H, Chen T, Su N, et al. Clinical Course and Outcomes of 344 Intensive Care Patients with
COVID-19. Am J Respir Crit Care Med 2020 Jun 01;201(11):1430-1434. [doi: 10.1164/rccm.202003-0736le]
8. Guan W, Liang W, Zhao Y, Liang H, Chen Z, Li Y, China Medical Treatment Expert Group for COVID-19. Comorbidity
and its impact on 1590 patients with COVID-19 in China: a nationwide analysis. Eur Respir J 2020 May 26;55(5):2000547
[FREE Full text] [doi: 10.1183/13993003.00547-2020] [Medline: 32217650]
9. Du RH, Liang LR, Yang CQ, Wang W, Cao TZ, Li M, et al. Predictors of mortality for patients with COVID-19 pneumonia
caused by SARS-CoV-2: a prospective cohort study. Eur Respir J 2020 Sep 24;56(3):2050524. [doi:
10.1183/13993003.50524-2020] [Medline: 32973076]
10. Shi Y, Yu X, Zhao H, Wang H, Zhao R, Sheng J. Host susceptibility to severe COVID-19 and establishment of a host risk
score: findings of 487 cases outside Wuhan. Crit Care 2020 Mar 18;24(1):108 [FREE Full text] [doi:
10.1186/s13054-020-2833-7] [Medline: 32188484]
11. Hu H, Yao N, Qiu Y. Comparing Rapid Scoring Systems in Mortality Prediction of Critically Ill Patients With Novel
Coronavirus Disease. Acad Emerg Med 2020 Jun 21;27(6):461-468 [FREE Full text] [doi: 10.1111/acem.13992] [Medline:
32311790]
12. Cho S, Park S, Song M, Bae YY, Lee D, Kim D. Prognosis Score System to Predict Survival for COVID-19 Cases: a
Korean Nationwide Cohort Study. J Med Internet Res 2021 Feb 22;23(2):e26257 [FREE Full text] [doi: 10.2196/26257]
[Medline: 33539312]
13. Agosto A, Giudici P. A Poisson Autoregressive Model to Understand COVID-19 Contagion Dynamics. SSRN Journal
Preprint posted online Mar 10, 2020. [doi: 10.2139/ssrn.3551626]
https://www.jmir.org/2021/4/e26075 J Med Internet Res 2021 | vol. 23 | iss. 4 | e26075 | p. 17
(page number not for citation purposes)
XSL• FO
RenderXJOURNAL OF MEDICAL INTERNET RESEARCH Patrício et al
14. Li X, Xu S, Yu M, Wang K, Tao Y, Zhou Y, et al. Risk factors for severity and mortality in adult COVID-19 inpatients in
Wuhan. J Allergy Clin Immunol 2020 Jul;146(1):110-118 [FREE Full text] [doi: 10.1016/j.jaci.2020.04.006] [Medline:
32294485]
15. Barman RK, Mukhopadhyay A, Maulik U, Das S. Identification of infectious disease-associated host genes using machine
learning techniques. BMC Bioinformatics 2019 Dec 27;20(1):736 [FREE Full text] [doi: 10.1186/s12859-019-3317-0]
[Medline: 31881961]
16. Luz C, Vollmer M, Decruyenaere J, Nijsten M, Glasner C, Sinha B. Machine learning in infection management using
routine electronic health records: tools, techniques, and reporting of future technologies. Clin Microbiol Infect 2020
Oct;26(10):1291-1299. [doi: 10.1016/j.cmi.2020.02.003] [Medline: 32061798]
17. Boutilier J, Chan T, Ranjan M, Deo S. Risk Stratification for Early Detection of Diabetes and Hypertension in
Resource-Limited Settings: Machine Learning Analysis. J Med Internet Res 2021 Jan 21;23(1):e20123 [FREE Full text]
[doi: 10.2196/20123] [Medline: 33475518]
18. Sujath R, Chatterjee JM, Hassanien AE. A machine learning forecasting model for COVID-19 pandemic in India. Stoch
Environ Res Risk Assess 2020 May 30;34(7):959-972. [doi: 10.1007/s00477-020-01827-8]
19. Chassagnon G, Vakalopoulou M, Battistella E, Christodoulidis S, Hoang-Thi T, Dangeard S, et al. AI-driven quantification,
staging and outcome prediction of COVID-19 pneumonia. Med Image Anal 2021 Jan;67:101860 [FREE Full text] [doi:
10.1016/j.media.2020.101860] [Medline: 33171345]
20. Assaf D, Gutman Y, Neuman Y, Segal G, Amit S, Gefen-Halevi S, et al. Utilization of machine-learning models to accurately
predict the risk for critical COVID-19. Intern Emerg Med 2020 Nov 18;15(8):1435-1443 [FREE Full text] [doi:
10.1007/s11739-020-02475-0] [Medline: 32812204]
21. Wu G, Yang P, Xie Y, Woodruff HC, Rao X, Guiot J, et al. Development of a clinical decision support system for severity
risk prediction and triage of COVID-19 patients at hospital admission: an international multicentre study. Eur Respir J 2020
Aug 02;56(2):2001104 [FREE Full text] [doi: 10.1183/13993003.01104-2020] [Medline: 32616597]
22. Wynants L, Van Calster B, Collins GS, Riley RD, Heinze G, Schuit E, et al. Prediction models for diagnosis and prognosis
of covid-19 infection: systematic review and critical appraisal. BMJ 2020 Apr 07;369:m1328 [FREE Full text] [doi:
10.1136/bmj.m1328] [Medline: 32265220]
23. Burdick H, Lam C, Mataraso S, Siefkas A, Braden G, Dellinger RP, et al. Prediction of respiratory decompensation in
Covid-19 patients using machine learning: The READY trial. Comput Biol Med 2020 Sep;124:103949 [FREE Full text]
[doi: 10.1016/j.compbiomed.2020.103949] [Medline: 32798922]
24. Liang W, Liang H, Ou L, Chen B, Chen A, Li C, China Medical Treatment Expert Group for COVID-19. Development
and Validation of a Clinical Risk Score to Predict the Occurrence of Critical Illness in Hospitalized Patients With COVID-19.
JAMA Intern Med 2020 Aug 01;180(8):1081-1089 [FREE Full text] [doi: 10.1001/jamainternmed.2020.2033] [Medline:
32396163]
25. Gayam V, Chobufo MD, Merghani MA, Lamichhane S, Garlapati PR, Adler MK. Clinical characteristics and predictors
of mortality in African-Americans with COVID-19 from an inner-city community teaching hospital in New York. J Med
Virol 2021 Feb 05;93(2):812-819 [FREE Full text] [doi: 10.1002/jmv.26306] [Medline: 32672844]
26. Núñez-Gil IJ, Fernández-Pérez C, Estrada V, Becerra-Muñoz VM, El-Battrawy I, Uribarri A, HOPE COVID-19 Investigators.
Mortality risk assessment in Spain and Italy, insights of the HOPE COVID-19 registry. Intern Emerg Med 2020 Nov
09;51(1):e13436 [FREE Full text] [doi: 10.1007/s11739-020-02543-5] [Medline: 33165755]
27. Iwendi C, Bashir AK, Peshkar A, Sujatha R, Chatterjee JM, Pasupuleti S, et al. COVID-19 Patient Health Prediction Using
Boosted Random Forest Algorithm. Front Public Health 2020 Jul 3;8:357 [FREE Full text] [doi: 10.3389/fpubh.2020.00357]
[Medline: 32719767]
28. Vaid A, Somani S, Russak AJ, De Freitas JK, Chaudhry FF, Paranjpe I, et al. Machine Learning to Predict Mortality and
Critical Events in a Cohort of Patients With COVID-19 in New York City: Model Development and Validation. J Med
Internet Res 2020 Nov 06;22(11):e24018 [FREE Full text] [doi: 10.2196/24018] [Medline: 33027032]
29. Snoek J, Larochelle H, Adams RP. Practical Bayesian optimization of machine learning algorithms. In: NIPS'12: Proceedings
of the 25th International Conference on Neural Information Processing Systems. Red Hook, NY: Curran Associates Inc;
2012 Presented at: International Conference on Neural Information Processing Systems; Dec 3-6; Nevada p. 2951-2959
URL: https://papers.nips.cc/paper/2012/file/05311655a15b75fab86956663e1819cd-Paper.pdf
30. Pedregosa F, Varoquaux G, Gramfort A, Michel V, Thirion B, Grisel O, et al. Scikit-learn: Machine learning in Python. J
Mach Learn Res 2011;12:2825-2830 [FREE Full text]
31. Chen T, Guestrin C. XGBoost: A scalable tree boosting system. In: Proceedings of the 22nd ACM SIGKDD International
Conference on Knowledge Discovery and Data Mining. 2016 Presented at: KDD '16: The 22nd ACM SIGKDD International
Conference on Knowledge Discovery and Data Mining; Aug 13-16; San Francisco, CA p. 785-794. [doi:
10.1145/2939672.2939785]
32. Plotly. URL: https://plotly.com/dash/ [accessed 2021-04-13]
33. Nogueira PJ, de Araújo Nobre M, Costa A, Ribeiro RM, Furtado C, Bacelar Nicolau L, et al. The Role of Health Preconditions
on COVID-19 Deaths in Portugal: Evidence from Surveillance Data of the First 20293 Infection Cases. J Clin Med 2020
Jul 24;9(8):3442 [FREE Full text] [doi: 10.3390/jcm9082368] [Medline: 32722159]
https://www.jmir.org/2021/4/e26075 J Med Internet Res 2021 | vol. 23 | iss. 4 | e26075 | p. 18
(page number not for citation purposes)
XSL• FO
RenderXJOURNAL OF MEDICAL INTERNET RESEARCH Patrício et al
34. GitHub. URL: https://github.com/Andrempp/COVIDCalculator [accessed 2021-04-13]
35. Gao Y, Cai G, Fang W, Li H, Wang S, Chen L, et al. Machine learning based early warning system enables accurate
mortality risk prediction for COVID-19. Nat Commun 2020 Oct 06;11(1):5033 [FREE Full text] [doi:
10.1038/s41467-020-18684-2] [Medline: 33024092]
36. Hu C, Liu Z, Jiang Y, Shi O, Zhang X, Xu K, et al. Early prediction of mortality risk among patients with severe COVID-19,
using machine learning. Int J Epidemiol 2021 Jan 23;49(6):1918-1929 [FREE Full text] [doi: 10.1093/ije/dyaa171] [Medline:
32997743]
37. Yadaw AS, Li Y, Bose S, Iyengar R, Bunyavanich S, Pandey G. Clinical features of COVID-19 mortality: development
and validation of a clinical prediction model. The Lancet Digital Health 2020 Oct;2(10):e516-e525. [doi:
10.1016/s2589-7500(20)30217-x]
Abbreviations
ANOVA: analysis of variance
DGS: Direcção-Geral da Saúde
DT: decision tree
ICU: intensive care unit
KNN: k-nearest neighbors
LGBM: Light Gradient Boosting Machine
MLP: multilayer perceptron
SMOTE: Synthetic Minority Oversampling Technique
XGB: XGBoost
Edited by C Basch; submitted 26.11.20; peer-reviewed by S Hyland, X Zhang, Z Zhang; comments to author 28.01.21; revised version
received 14.02.21; accepted 18.03.21; published 28.04.21
Please cite as:
Patrício A, Costa RS, Henriques R
Predictability of COVID-19 Hospitalizations, Intensive Care Unit Admissions, and Respiratory Assistance in Portugal: Longitudinal
Cohort Study
J Med Internet Res 2021;23(4):e26075
URL: https://www.jmir.org/2021/4/e26075
doi: 10.2196/26075
PMID: 33835931
©André Patrício, Rafael S Costa, Rui Henriques. Originally published in the Journal of Medical Internet Research
(https://www.jmir.org), 28.04.2021. This is an open-access article distributed under the terms of the Creative Commons Attribution
License (https://creativecommons.org/licenses/by/4.0/), which permits unrestricted use, distribution, and reproduction in any
medium, provided the original work, first published in the Journal of Medical Internet Research, is properly cited. The complete
bibliographic information, a link to the original publication on https://www.jmir.org/, as well as this copyright and license
information must be included.
https://www.jmir.org/2021/4/e26075 J Med Internet Res 2021 | vol. 23 | iss. 4 | e26075 | p. 19
(page number not for citation purposes)
XSL• FO
RenderXYou can also read