COVID 19 vaccines that reduce symptoms but do not block infection need higher coverage and faster rollout to achieve population impact - Nature
←
→
Page content transcription
If your browser does not render page correctly, please read the page content below
www.nature.com/scientificreports
OPEN COVID‑19 vaccines that reduce
symptoms but do not block
infection need higher coverage
and faster rollout to achieve
population impact
David A. Swan1,9, Chloe Bracis2,9, Holly Janes1, Mia Moore1, Laura Matrajt1,
Daniel B. Reeves1, Eileen Burns3, Deborah Donnell1,4, Myron S. Cohen5,
Joshua T. Schiffer1,6,7,10 & Dobromir Dimitrov1,8,10*
Trial results for two COVID-19 vaccines suggest at least 90% efficacy against symptomatic disease
(VEDIS). It remains unknown whether this efficacy is mediated by lowering SARS-CoV-2 infection
susceptibility (VESUSC) or development of symptoms after infection (VESYMP). We aim to assess
and compare the population impact of vaccines with different efficacy profiles (VESYMP and VESUSC)
satisfying licensure criteria. We developed a mathematical model of SARS-CoV-2 transmission,
calibrated to data from King County, Washington. Rollout scenarios starting December 2020 were
simulated with combinations of VESUSC and VESYMP resulting in up to 100% VEDIS. We assumed
no reduction of infectivity upon infection conditional on presence of symptoms. Proportions of
cumulative infections, hospitalizations and deaths prevented over 1 year from vaccination start are
reported. Rollouts of 1 M vaccinations (5000 daily) using vaccines with 50% VEDIS are projected to
prevent 23–46% of infections and 31–46% of deaths over 1 year. In comparison, vaccines with 90%
VEDIS are projected to prevent 37–64% of infections and 46–64% of deaths over 1 year. In both cases,
there is a greater reduction if VEDIS is mediated mostly by VESUSC. The use of a “symptom reducing”
vaccine will require twice as many people vaccinated than a “susceptibility reducing” vaccine with
the same 90% VEDIS to prevent 50% of the infections and death over 1 year. Delaying the start of the
vaccination by 3 months decreases the expected population impact by more than 50%. Vaccines which
prevent COVID-19 disease but not SARS-CoV-2 infection, and thereby shift symptomatic infections
to asymptomatic infections, will prevent fewer infections and require larger and faster vaccination
rollouts to have population impact, compared to vaccines that reduce susceptibility to infection. If
uncontrolled transmission across the U.S. continues, then expected vaccination in Spring 2021 will
provide only limited benefit.
SARS-CoV-2 has infected more than 95 million people around the world as of January 19, 2021, causing more
eaths1. With the onset of winter in the Northern Hemisphere, cases are surging particularly
than 2 million d
in Europe and North America. The need for a COVID-19 vaccine is the most urgent public health priority in
recent human h istory2,3.
Two mRNA-based vaccines have already demonstrated efficacy greater than 90%4,5, two more viral vector
vaccines have proven effective6,7 with several more vaccine candidates in the final stage of testing. The primary
1
Vaccine and Infectious Disease Division, Fred Hutchinson Cancer Research Center, 1100 Fairview Ave N., M2‑C200,
P.O. Box 19024, Seattle, WA 98109‑1024, USA. 2Université Grenoble Alpes, TIMC-IMAG/BCM, 38000 Grenoble,
France. 3Independent Researcher, Seattle, WA, USA. 4Department of Global Health, University of Washington,
Seattle, WA, USA. 5Department of Epidemiology, University of North Carolina at Chapel Hill, Chapel Hill, NC,
USA. 6Clinical Research Division, Fred Hutchinson Cancer Research Center, Seattle, WA, USA. 7Department of
Medicine, University of Washington, Seattle, WA, USA. 8Department of Applied Mathematics, University of
Washington, Seattle, WA, USA. 9These authors contributed equally: David A. Swan and Chloe Bracis. 10These
authors contributed equally: Joshua T. Schiffer and Dobromir Dimitrov. *email: ddimitro@fredhutch.org
Scientific Reports | (2021) 11:15531 | https://doi.org/10.1038/s41598-021-94719-y 1
Vol.:(0123456789)
www.nature.com/scientificreports/
objective in each of these studies is to evaluate vaccine efficacy against virologically-confirmed symptomatic
SARS-CoV-2 infection, i.e. COVID-19 disease, denoted V EDIS. The COVID-19 endpoint is defined by protocol-
specified criteria for signs and symptoms consistent with COVID-19 and a confirmatory SARS-CoV-2 PCR test.
Asymptomatic cases are therefore not captured in the primary endpoint of these trials, though seroconversion
data will ultimately be available for all participants and potentially used to assess the proportion of asymptomatic
infections in the active and placebo arms.
The population impact of a vaccine is not fully captured by its efficacy against disease; several other types
of vaccine effects may have equal or greater influence8. First, a COVID-19 vaccine may reduce the likelihood
of acquiring SARS-CoV-2 upon exposure, i.e. vaccine efficacy on susceptibility ( VESUSC)9,10. Alternatively, or in
combination, a vaccine might reduce the likelihood of symptoms upon infection ( VESYMP) and lead to subclini-
cal (asymptomatic) infection with viral shedding that might still allow ongoing transmission. Critically, both
VESUSC and V ESYMP would contribute to observed V EDIS. Finally, a vaccine may decrease the infectiousness of
individuals who become infected ( VEINF). A vaccine’s population impact depends on all these vaccine effects.
A specific concern for COVID-19 vaccines is that a vaccine with high efficacy against COVID-19 disease
(VEDIS) but low efficacy against SARS-CoV-2 infection (VESUSC), would predominantly convert symptomatic
infections to asymptomatic infections. Furthermore, if the vaccine does not reduce infectiousness ( VEINF = 0),
it could in theory lead to increased spread of SARS-CoV-211,12. This is especially relevant in settings such as the
US where the testing and diagnosis of infection is primarily symptom-driven; individuals with asymptomatic
infection are less likely to be diagnosed and therefore may spread infection more readily than diagnosed and
socially-isolated symptomatic individuals. The concern is heightened by considerable evidence pointing to the
role that asymptomatic and pre-symptomatic cases play in transmission of SARS-CoV-2, with peak infectious-
ness typically occurring prior to the onset of symptoms13–15. The Pfizer and Moderna vaccines are reported to
have ~ 95% VEDIS with VESUSC and VESYMP remaining unknown. Unfortunately, V EINF for these vaccines is not
estimable from the completed trials.
Mathematical models are useful tools to simulate epidemic dynamics and several models have already pro-
jected the population impact of hypothetical COVID-19 v accines16–25. This work has mostly revolved around
vaccine prioritization groups16,17 and none have specifically assessed the population impact of “symptom avert-
ing” vaccines with high V EDIS but low V ESUSC and V
EINF. As a result, the modeling projections of achieving more
than 80% population effectiveness with 40% coverage may be overly optimistic23. Moreover, most of the previous
work has not considered vaccination rollouts initiated in the middle of epidemic wave which may reduce the
overall benefits from the vaccination.
Employing a mathematical model calibrated to King County, WA, we analyze the expected population benefits
of a COVID-19 vaccine with demonstrated efficacy in reducing COVID-19 disease under varying combinations
of vaccine effects ( VESUSC and V
ESYMP) and under different rollout timing and population coverage. Our results
suggest that the concern for increased transmission due to rollout of COVID-19 vaccines with at least 50% VEDIS
that mostly converts symptomatic to asymptomatic infections (low V ESUSC and high V
ESYMP) is not supported by
the evidence. However, we demonstrate that vaccines that do reduce the risk of infection (high VESUSC and low
VESYMP) are expected to have substantially greater population impact. Although focused on King County, WA,
we consider an ensemble of plausible epidemic trajectories with variable projections of the timing and magnitude
of the winter epidemic peak suitable to explore the vaccine effectiveness in various epidemic conditions observed
throughout the U.S. Our analysis highlights the importance of rolling out the vaccine fast and early which is
highly relevant to the current epidemic situation given the spike in the confirmed cases locally and nationwide.
Methods
Model description. We modified a previously developed deterministic compartment model which
describes the epidemic dynamics in King County, W A26 to allow for vaccine rollouts. Our model (Fig. 1, Fig S1)
stratifies the population by age (0–19 years, 20–49 years, 50–69 years, and 70+ years), infection status (suscep-
tible, exposed, asymptomatic, pre-symptomatic, symptomatic, recovered), clinical status (undiagnosed, diag-
nosed, hospitalized) and vaccination status.
In our main scenario we assume that 20% of infections are asymptomatic reflecting the estimated proportion
of SARS-CoV2 infections without symptoms in a published meta-analysis based on 79 s tudies14. We also assume
that asymptomatic people are as infectious as symptomatic individuals but missing the highly infectious pre-
symptomatic phase. As a result, the relative infectiousness of individuals who never express symptoms is 56%
of the overall infectiousness of individuals who develop symptomatic COVID-19 infection. This estimate falls
between the 35% relative infectiousness estimated in the meta-analysis14 and the current best estimate of 75%
suggested by the CDC in their COVID-19 pandemic planning s cenarios27. We explore alternative scenarios in
which asymptomatic infections are only 28% less infectious than symptomatic cases to assess the importance of
this assumption to the presented results.
The model is parameterized with local demographic and contact data from King County, WA and calibrated
to local case and mortality data (Figs. S2, S3) using transmission parameter ranges informed from published
sources (Tables S1, S2, S3)28–31. We used a genetic algorithm (NSGA-II multivariate optimization algorithm in the
mco R package) and Monte Carlo filtering to select 100 calibrated parameter sets on epidemic start, transmission
and hospitalization rates by age and physical isolation as a function of symptoms and diagnosis which reproduce
the data from the Spring 2020 lockdown within pre-specified tolerances. We validated our assumptions on the
diagnostic rates of symptomatic and asymptomatic cases during “reopening” period against independent data
not used for calibration (cases and deaths after the calibration period) and independent region-specific modeling
projections32,33. As a result, we obtained an ensemble of plausible epidemic trajectories with variable projections
of the timing and magnitude of the winter epidemic peak suitable to explore the uncertainty in the vaccine
Scientific Reports | (2021) 11:15531 | https://doi.org/10.1038/s41598-021-94719-y 2
Vol:.(1234567890)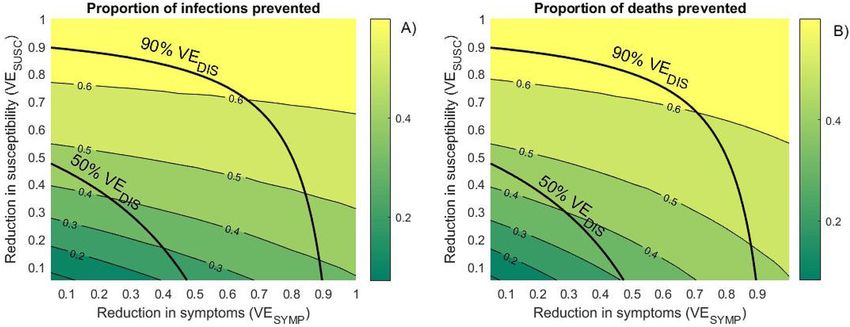
www.nature.com/scientificreports/
Figure 1. Schematic of the modeling analysis. (A) Diagram of the population transmission model with solid
lines representing the flows of individuals between compartments and dotted lines indicating compartments
which contribute to diagnosed cases; (B) mixing matrix between age groups showing proportions of contacts
each group (row) has with the other groups (columns); (C) simplified diagram of the SARS-CoV2 transmission
(red arrow) and the resulting force of infection (black arrow) in absence of vaccine and (D) the potential vaccine
effects on the transmission and the force of infection.
Vaccine efficacy profiles Vaccine 1 Vaccine 2 Vaccine 3 Vaccine 4
Vaccine effects on susceptibility (VESUSC) defined as reduction of the probability to
0.1 0.4 0.1 0.8
acquire infection upon exposure
Vaccine effects on symptomatology (VESYMP) defined as reduction in the probability to
0.444 0.167 0.889 0.5
develop symptoms upon infection
Vaccine effects on COVID-19 disease
(VEDIS) = 1 − (1 − V
ESUSC) (1 − VESYMP) defined as reduction in the likelihood to 0.5 0.5 0.9 0.9
develop symptomatic diseases upon exposure
Table 1. Vaccine efficacy profiles simulated in the main analysis. All profiles assume no reduction in
infectiousness (VEINF = 0).
effectiveness predictions associated with background epidemic conditions. We also explored additional scenarios
in which only symptomatic cases get tested and diagnosed to assess the importance of this assumption for the
projected impact of symptom averting vaccines. A full description of the model can be found in the Supplement.
Vaccination scenarios. We consider four vaccine efficacy profiles (Table 1) with respect to vaccine effects
on susceptibility (VESUSC) and symptomatology (VESYMP) which in combination determine the expected reduc-
tion in the likelihood to develop symptomatic diseases upon exposure (VEDIS) as described in Table 1. We com-
pare two profiles (Vaccine 1 and Vaccine 2) satisfying the WHO and FDA requirement for COVID-19 vaccines
to be at least 50% efficacious reducing the risk of symptomatic disease (50% VEDIS)34,35, and two profiles (Vaccine
3 and Vaccine 4) with efficacy against COVID-19 disease (90% VEDIS) comparable to the results reported on
the Pfizer and Moderna v accines4,5 and no effects on the infectiousness ( VEINF = 0) for either asymptomatic or
symptomatic infections. The values explored for VESUSC and VESYMP allow us to clearly differentiate “suscepti-
Scientific Reports | (2021) 11:15531 | https://doi.org/10.1038/s41598-021-94719-y 3
Vol.:(0123456789)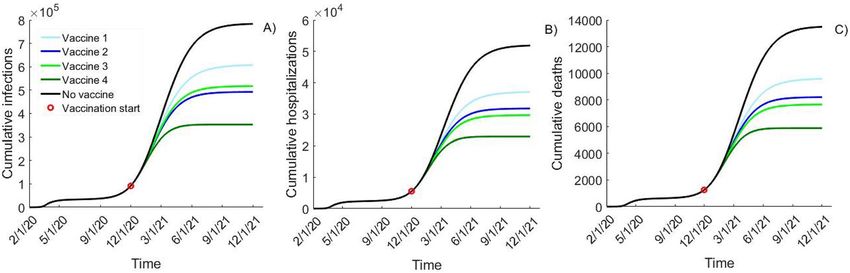
www.nature.com/scientificreports/
Figure 2. Epidemic projections with different vaccine efficacy profiles. Comparison of (A) cumulative
infections; (B) cumulative hospitalizations and (C) cumulative deaths over time simulated with different
efficacy profiles assuming vaccination start date of Dec. 1, 2020 and rolled out with 5000 vaccinated daily until
1,000,000 vaccinations are reached. Vaccine 1 (10% V ESUSC and 44.4% VESYMP) and Vaccine 2 (40% V ESUSC and
16.7% VESYMP) result in 50% reduction in symptomatic disease (VEDIS) while Vaccine 3 (10% VESUSC and 88.9%
VESYMP) and Vaccine 4 (80% V ESUSC and 50% VESYMP) result in 90% VEDIS. All projections represent the mean
value of epidemic simulations using 100 calibrated parameter sets.
bility reducing” vaccines which actively reduce the risk to acquire infection (Vaccine 2 and 4) from “symptom
reducing” vaccines which mostly convert symptomatic infections to asymptomatic (Vaccine 1 and 3).
In our main scenario we assume 5000 vaccinations a day (~ 0.2% of the population) starting Dec 1, 2020 until
1,000,000 individuals are vaccinated, enough to cover ~ 45% of the population. The number of daily vaccinations
gradually decreases when 90% of the coverage target is reached (see Fig S4). Daily vaccinations are distributed
proportionally between susceptible and recovered classes which implies that individuals from those two groups
are equally likely to be vaccinated. We do not explicitly model two-dose vaccine regimens but assume immediate
immunization at the time when the vaccine regimen is completed. Our vaccination rate is comparable to the vac-
cination plan revealed by Biden administration36 assuming that vaccine doses will be distributed proportionally
across regions but less optimistic compared to the prognosis by the Head of Operation Warp Speed who suggested
that 70% of the U.S. population could be vaccinated by M ay37. Alternative scenarios with delayed vaccination start
dates and 200,000–2,000,000 total vaccinated (10–90% population coverage) are also explored. Vaccinations are
proportionally distributed across age groups without excluding individuals with prior SARS-CoV-2 infection.
Metrics of interest. Population effectiveness is estimated as: (1) proportion of cumulative infections pre-
vented; (2) proportion of cumulative hospitalizations prevented and (3) proportion of cumulative deaths pre-
vented over 1 year after the vaccination start date compared to base-case scenarios in which vaccine is not avail-
able. Reductions in maximum daily infections, hospitalizations and deaths over 1 year from the vaccination start
date are also evaluated. The uncertainty in the estimates is presented as 80% uncertainty interval (UI) based on
simulations with 100 calibrated parameter sets per scenario.
Results
Base‑case epidemic conditions. In the absence of a vaccine all calibrated simulations predict epidemic
outbreaks reaching a maximum of 5900 (80% UI: 3700–8300) new infections, 390 (80% UI: 230–550) new hos-
pitalizations and 99 (80% UI: 65–138) deaths daily at their transmission peak expected between January and
July 2021. As of Dec. 1, 2020, the model projects that 4.2% of the population in King County is either infected
or recovered with estimates across simulated epidemic conditions spanning over a range (80% UI: 1.4–8.5%)
consistent with the COVID-19 seroprevalence projections for the majority of the US s tates38. The model pro-
jects 785,000 (80% UI: 647,000–914,000) cumulative infections and 13,500 (80% UI: 10,900–16,200) cumulative
deaths by December 2021 if no vaccine becomes available (Fig. 2, black).
Population impact of vaccines reducing the risk of COVID‑19 disease by 50%. A “symptom
reducing” vaccine with 50% VEDIS (Vaccine 1: moderate VESYMP, low VESUSC) is projected to prevent 25% of the
infections and 32% of the deaths over 1-year period reducing the cumulative number of infections by 180,000 to
approximately 605,000 and the cumulative number of deaths by almost 4000 to approximately 9600 (Fig. 2, Vac-
cine 1). Vaccine 1 is projected to reduce the maximum number of daily hospitalizations and deaths by approxi-
mately 25% (Fig S5).
In comparison, a “susceptibility reducing” vaccine (Vaccine 2: moderate VESUSC, low VESYMP) with the same
efficacy against COVID-19 disease (50% V EDIS) is expected to prevent additional 115,000 infections (17% more)
and 1400 deaths (11% more) over 1 year (Fig. 2, Vaccine 2). These differences correspond to 65% and 35% relative
increase in the population impact over the projections utilizing the “symptom reducing” (Vaccine 1), respectively.
Population impact of vaccines reducing the risk of COVID‑19 disease by 90%. A “symptom
reducing” vaccine with 90% VEDIS (Vaccine 3: low VESUSC, high VESYMP) is projected to have a comparable
Scientific Reports | (2021) 11:15531 | https://doi.org/10.1038/s41598-021-94719-y 4
Vol:.(1234567890)www.nature.com/scientificreports/
Figure 3. Projected vaccine effectiveness. Contour plots of the proportions of: (A) cumulative infections
prevented and (B) cumulative deaths prevented over 1 year after the start of vaccine rollout by vaccines with
different effects on susceptibility ( VESUSC) and the risk to develop symptoms ( VESYMP). Rollout assumes 5000
vaccinated daily till 1,000,000 vaccinations are reached. Thick lines represent VE profiles resulting in 50% and
90% reduction in symptomatic disease (VEDIS).
population impact to the “susceptibility reducing” vaccine with 50% VEDIS (Vaccine 2). Vaccine 3 is projected to
have a slightly smaller effect on SARS-CoV2 transmission than Vaccine 2 (39% vs 42% reduction over 1 year)
while reducing 2100 more hospitalizations and 550 more deaths than Vaccine 2 (Fig. 2, light green vs. dark blue).
Finally, a “susceptibility reducing” vaccine with 90% VEDIS (Vaccine 4: high VESUSC, moderate VESYMP) is
projected to be the most effective at population level preventing additional 165,000 infections, 6800 hospitali-
zations and 1800 deaths over Vaccine 3 and reducing the cumulative infections to approximately 350,000 and
cumulative deaths to approximately 5900 (Fig. 2, Vaccine 4).
Figure 3 shows the wide range of population effectiveness which may result from the same reduction of
the risk of COVID-19 disease observed in clinical studies. This uncertainty is particularly large for moderately
effective vaccines (50% VEDIS) which may result in 23–46% reduction in transmission and 31–46% reduction in
COVID-related mortality depending on which vaccine effects are induced. Vaccines with 90% VEDIS are projected
to prevent between 37 and 64% of the infections and between 46 and 64% of deaths over 1 year. Notably, the
effectiveness ranges for moderate and highly effective vaccines overlap which suggest that “susceptibility reduc-
ing” vaccine with moderate efficacy against COVID disease may have greater population impact than highly
effective “symptom reducing” vaccine. The importance of the effects on the disease severity ( VESYMP) decreases
if the vaccine provides a strong protection against acquisition ( VESUSC) with the contour line corresponding to
the same level of impact becoming more horizontal.
It is critical to rollout the vaccine early and rapidly. Our analysis demonstrates that if the vaccine
becomes available before the beginning of an outbreak it substantially increases the projected population impact
(Fig S6). The 25 simulations with the earliest transmission peak (before February 10, 2021) average only 25% and
35% reduction in mortality for the vaccines with 90% V EDIS (Vaccine 3 and Vaccine 4), respectively (Fig S6H,I,
blue). In comparison, the same vaccines average 72% and 88% mortality reduction over the 25 simulations with
the latest transmission peak after April 6, 2021 (Fig S6H,I, red).
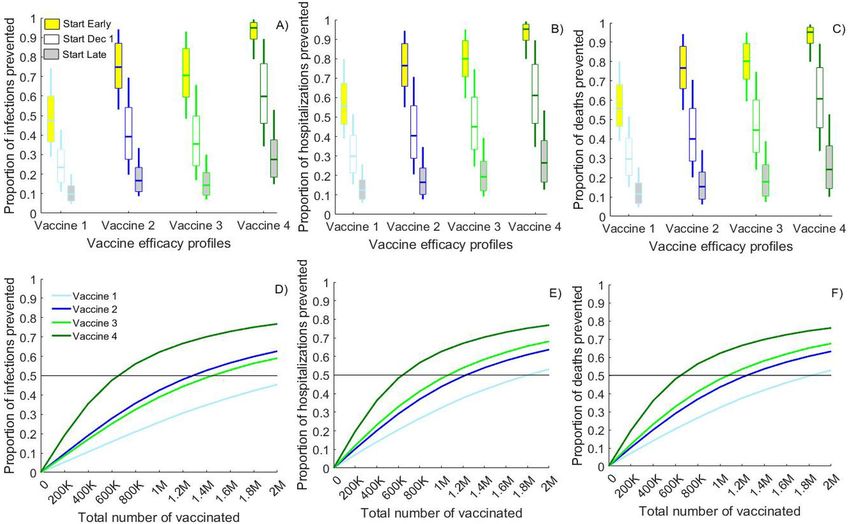
Delaying vaccination start to March 2021 decreases the expected population impact of the vaccination by
approximately 50–56% in terms of transmission reduction, 52–56% in terms of hospitalization reduction and
55–58% in terms of mortality reduction compared to the main scenario assuming start at December 1, 2020. All
simulated VE profiles are projected to prevent less than one third of the infections, hospitalizations and deaths
over 1 year if the vaccination starts late (Fig. 4A–C, gray boxes). Conversely, if vaccines had been available even
earlier (in Sept 2020) they would have averted additional 26–33% of the base-case infections, 25–32% of the
base-case hospitalizations and 23–33% of the base-case deaths over 1 year (Fig. 4A–C, yellow boxes).
We also demonstrate the importance of fast vaccine rollout in response to concerns that only limited quantities
will be available by Spring 2021. We project that only 650 K vaccinated (~ 30% coverage) with the “susceptibility
reducing” Vaccine 4 (90% V EDIS, high VESUSC) will be enough to reduce the COVID-19 transmission and mor-
tality in half (Fig. 4D–F, dark green) in conjunction with physical distancing measures to keep physical interac-
tions to 60% of pre-COVID levels (i.e., distancing, masking etc.). In comparison, the use of “symptom reducing”
vaccine with the same 90% V EDIS (Vaccine 3) will require 1.1 M vaccinations (~ 50% coverage) to achieve 50%
reduction in mortality and 1.45 M vaccinations (~ 65% coverage) to achieve 50% reduction in transmission
(Fig. 4D–F, light green). Averting three quarters of the annual transmission is impossible with Vaccine 1–3 even
at 90% coverage but is achievable with 1.8 M vaccinated (~ 80% coverage) with Vaccine 4. Notably, at all cover-
age levels, the population impact of “susceptibility reducing” Vaccine 2 with moderate 50% V EDIS is comparable
with the impact of “symptom reducing” Vaccine 3 with high 90% VEDIS.
Scientific Reports | (2021) 11:15531 | https://doi.org/10.1038/s41598-021-94719-y 5
Vol.:(0123456789)www.nature.com/scientificreports/
Figure 4. Importance of the timing and the coverage achieved with the vaccine rollout. Comparison of the
projected reductions in the number of: (A,D) cumulative infections; (B,E) cumulative hospitalizations and (C,F)
cumulative deaths over 1 year due to the use of vaccines with different efficacy profiles compared to base-case
scenarios without vaccination. (A–C) compare vaccine rollouts which start on Dec. 1, 2020 (white boxes), Sept.
1, 2020 (yellow boxes) or March 1, 2021 (gray boxes) assuming 5000 vaccinated daily till 1,000,000 vaccinations
are reached. (D–F) show the impact of rollouts starting on Dec. 1, 2020 and reaching different number of total
vaccinations over 200 days. Vaccine 1 (10% VESUSC and 44.4% VESYMP) and Vaccine 2 (40% V ESUSC and 16.7%
VESYMP) result in 50% reduction in symptomatic disease (VEDIS) while Vaccine 3 (10% VESUSC and 88.9%
VESYMP) and Vaccine 4 (80% V ESUSC and 50% VESYMP) result in 90% VEDIS. Lines represent the mean value while
boxplots represent the uncertainty generated by 100 calibrated simulations.
When a vaccine rollout may result in small population impact? In order to investigate the mini-
mum impact that can be expected with a licensed vaccine with 50% or 90% V EDIS, we simulated a scenario in
which: (1) no asymptomatic and pre-symptomatic cases are diagnosed, i.e., all SARS-CoV-2 testing is done after
symptoms occur and (2) the overall infectiousness of individuals who never express symptoms is only 28% lower
than symptomatic cases (Fig. S7). Under this pessimistic scenario “symptom reducing” vaccines are projected
to reduce SARS-CoV-2 transmission by 5% (Vaccine 1) and 6% (Vaccine 3) and COVID-19 mortality by 9%
(Vaccine 1) and 15% (Vaccine 3). These estimates should serve as a lower bound for the population effectiveness
of licensed vaccines with unclear protection against infection. Notably, none of the vaccine profiles projected
increased transmission for any of the simulated epidemic conditions.
Discussion
The COVID-19 vaccines currently being tested must lower the number of symptomatic cases by 50% relative
to placebo (50% V EDIS) in order to be licensed. Recent reports suggest that the first generation of mRNA vac-
cine have remarkable VEDIS but their ability to prevent infection is currently not a criterion for approval and is
unknown. Ultimately, seroconversion data from these studies may provide some insight regarding breakthrough
asymptomatic infection but may be marked by loss of a humoral response such that underestimation of asymp-
tomatic infection is possible.
In this analysis we explored different combinations of vaccine effects which result in 50% and 90% reduction
of symptomatic COVID-19 and demonstrated significant variability in projected population effectiveness based
on whether the vaccines fully prevent infection or convert symptomatic cases to asymptomatic cases with some
ongoing possibility of transmission. Although this difference is not being evaluated as a primary endpoint in
current studies, estimating the frequency and downstream transmission likelihood of asymptomatic infection
is recognized as a research p riority11,39,40. We identify that a high rate of conversion to asymptomatic infection
is unlikely to increase the incidence of new cases. We demonstrate that the population effectiveness of “suscep-
tibility reducing” vaccines can be up to 65% larger than “symptom reducing” vaccines even if resulting in the
same observed V EDIS. Such vaccines contribute to a more rapid attainment of necessary vaccination thresholds
Scientific Reports | (2021) 11:15531 | https://doi.org/10.1038/s41598-021-94719-y 6
Vol:.(1234567890)www.nature.com/scientificreports/
to achieve herd immunity. Moreover, we found that a “susceptibility reducing” vaccine with moderate 50% VEDIS
may provide comparable population benefits with a “symptom reducing” vaccine with high 90% V EDIS. With
multiple vaccine candidates in the pipeline, our results reveal the complexity of the problem and suggest that
the usefulness of a vaccine should not be judged by a single efficacy number.
A significant proportion of the population impact expected with a “symptom reducing” vaccine can be
attributed to the reduced infectiousness of the asymptomatic cases as has been reported for influenza vaccine41.
This is despite the fact that asymptomatically infected people may remain infectious for a longer period of time
given the lower likelihood of being diagnosed and self-isolating. Our analysis suggests that the population effec-
tiveness of “symptom reducing” vaccine, measured as reduction in SARS-CoV2 transmission, may decrease to
below 10% if the infectiousness gap between asymptomatic and symptomatic cases is smaller and if individuals
who do not show symptoms are not readily tested, diagnosed and isolated. This highlights the need to continue
the contact tracing and quarantine measures, currently in place, for at least the duration of the vaccine rollout.
We also conclude that vaccine rollout will be significantly more effective if introduced prior to rather than
during a surge in cases. Even the rollout of a vaccine with 90% V EDIS may result in very small reduction in
actual SARS-CoV-2 transmission if it occurs after a substantial number of people have been already infected.
Unfortunately, at the time of this writing, the effective reproductive number exceeds one in virtually every U.S.
state and many hospitals are already nearing capacity in many regions of the country. During the current surge,
there is little evidence as of yet that case incidence has started to lower as states in the Northern Plains now have
an estimated prevalence approaching 25% and few US states have reimposed lockdowns42,43. On November 15,
2020 Washington state (and thus King County, the focus of this paper) reimposed some restrictions closing busi-
nesses and limiting gatherings but the impact of these measures has not affected the upward epidemic trajectories
yet44. If the current uncontrolled increase in confirmed cases and hospitalizations across the U.S. continues, the
expected vaccination in Spring 2021 may come too late. The most recent projections of the Institute for Health
Metrics and Evaluations predict that the trend of increasing cases in Washington State will continue until Febru-
ary 202143. Our analysis provides a strong rationale for mitigation measures such as mask m andates45 and further
physical distancing46,47 to contain the epidemic surge and weather the incoming months in expectation of mass
production and distribution of safe and effective vaccines.
Our results qualitatively agree with previous s tudies17,23 that supporting non-pharmaceutical measures might
be needed during vaccination campaigns to slow down the epidemic and increase its effectiveness. We also share
the conclusion of other modeling teams that vaccines mediated by a reduction in susceptibility to infection will
have a greater impact than disease-modifying vaccines24,25. However, our analysis suggests that mortality reduc-
tion greater than 75%, projected in some studies23, is achievable under high vaccine coverage (50%) only if a
“susceptibility reducing” vaccine is rolled out rapidly in well-controlled epidemic environment but not in the mid-
dle of an epidemic wave. The importance of an early vaccine rollout has also been highlighted in other studies19.
Some caveats of this work are important to note. First, we assumed that the licensed vaccines have no direct
effect on the infectiousness (VEINF) of the breakthrough infections. Nevertheless, the vaccine shifting symp-
tomatic infections to less infectious asymptomatic infection indirectly reduces overall infectiousness. While a
moderate VEINF will not directly protect the vaccine recipient, it would likely effectively limit further chains of
transmission and therefore should be evaluated. Second, we do not explicitly model two-dose vaccine regimens,
yet our results point to early and rapid rollouts as a key for a successful vaccination campaign. We expect that
employing more realistic dose distribution (explicitly modeling two doses and lead-time to mount protective
immunity) will strengthen these conclusions. Third, we considered vaccination rollouts where all age groups
are vaccinated. Current recommendations point to vaccinating older age groups first, which are those at higher
risk. In that sense, our model might be underestimating the impact of vaccination rollouts on the number of
deaths prevented. We also exclude from vaccination individuals who are currently infected with SARS-CoV-2.
Even if some asymptomatic infected may get vaccinated they will be very small number compared to those from
susceptible and recovered groups. This will result in slightly more vaccine doses being “wasted” in addition to
all recovered individuals who become vaccinated while being fully protected. Forth, we assume that the level of
physical interactions remains steady for the next year which results in epidemic outbreaks of various magnitudes
providing a reasonable variability in the counterfactual epidemic conditions in which we evaluate vaccines with
different efficacy profiles. Enforcing partial or full lockdowns and reopenings would likely result in periodic
fluctuations in the number of infections and confirmed cases48 but unlikely to affect effectiveness projections if
the same schedule is applied to scenarios with and without vaccination. However, if physical interactions increase
with the rollout of vaccines either due to policy shifts or individual behavioral compensation, the resulting out-
comes would be worse than what we have predicted here. Finally, the emergence and spread of more contagious
variants may change the epidemic dynamics in King County but unlikely to affect the population impact dif-
ferences between “susceptibility reducing” and “symptom reducing” vaccines, reported here, provided that the
vaccines are equally effective against currently prevalent and new strains. Careful monitoring of the spread of
new variants and further research on these questions is warranted.
The results of this analysis suggest that fully understanding the efficacy profile of the vaccine is important,
since vaccines with different profiles may show similar efficacy in clinical studies but have considerably different
population impact. In particular, vaccines which prevent COVID-19 disease but not SARS-CoV-2 infection,
and thereby shift symptomatic infections to asymptomatic infections, will prevent fewer infections and require
larger and faster vaccination rollouts to achieve the same population impact as vaccines that reduce susceptibil-
ity to infection.
Scientific Reports | (2021) 11:15531 | https://doi.org/10.1038/s41598-021-94719-y 7
Vol.:(0123456789)www.nature.com/scientificreports/
Received: 28 January 2021; Accepted: 8 July 2021
References
1. COVID-19 Dashboard by the Center for Systems Science and Engineering (CSSE) at Johns Hopkins University (JHU). https://
coronavirus.jhu.edu/map.html (2020).
2. Chakraborty, I. & Maity, P. COVID-19 outbreak: Migration, effects on society, global environment and prevention. Sci. Total
Environ. 728, 138882 (2020).
3. Corey, L., Mascola, J. R., Fauci, A. S. & Collins, F. S. A strategic approach to COVID-19 vaccine R&D. Science 368, 948 (2020).
4. Moderna, P. R. Moderna Announces Primary Efficacy Analysis in Phase 3 COVE Study for Its COVID-19 Vaccine Candidate and
Filing Today with U.S. FDA for Emergency Use Authorization. (2020). https://investors.modernatx.com/news-releases/news-relea
se-details/moderna-announces-primar y-efficacy-analysis-phase-3-cove-study.
5. Pfizer. Pfizer and BioNTech Announce Vaccine Candidate Against COVID-19 Achieved Success in First Interim Analysis from
Phase 3 Study. (2020). https://www.pfizer.com/news/press-release/press-release-detail/pfizer-and-biontech-announce-vaccine-
candidate-against.
6. Voysey, M. et al. Single-dose administration and the influence of the timing of the booster dose on immunogenicity and efficacy
of ChAdOx1 nCoV-19 (AZD1222) vaccine: A pooled analysis of four randomised trials. Lancet 397, 881–891. https://doi.org/10.
1016/S0140-6736(21)00432-3 (2021).
7. Sadoff, J. et al. Safety and efficacy of single-dose Ad26.COV2.S vaccine against Covid-19. N. Engl. J. Med. https://doi.org/10.1056/
NEJMoa2101544 (2021).
8. ElizabethHalloran, I. M. L. Jr. & Claudio, J. S. Design and Analysis of Vaccine Studies (Springer, 2010).
9. Halloran, M. E., Struchiner, C. J. & Longini, I. M. Study designs for evaluating different efficacy and effectiveness aspects of vac-
cines. Am. J. Epidemiol. 146, 789–803 (1997).
10. Halloran, M. E., Longini, I. M. & Struchiner, C. J. Design and interpretation of vaccine field studies. Epidemiol. Rev. 21, 73–88
(1999).
11. Mehrotra, D. V. et al. Clinical endpoints for evaluating efficacy in COVID-19 vaccine trials. Ann. Intern. Med. 20, 2 (2020).
12. Lipsitch, M. & Dean, N. E. Understanding COVID-19 vaccine efficacy. Science 370, 763 (2020).
13. Tindale, L. C. et al. Evidence for transmission of COVID-19 prior to symptom onset. Elife 9, 20 (2020).
14. Buitrago-Garcia, D. et al. Occurrence and transmission potential of asymptomatic and presymptomatic SARS-CoV-2 infections:
A living systematic review and meta-analysis. PLoS Med. 17, e1003346. https://doi.org/10.1371/journal.pmed.1003346 (2020).
15. Arons, M. M. et al. Presymptomatic SARS-CoV-2 infections and transmission in a skilled nursing facility. N. Engl. J. Med. 382,
2081–2090 (2020).
16. Bubar, K. M. et al. Model-informed COVID-19 vaccine prioritization strategies by age and serostatus. Sci. 371(6532), 916–921
(2021).
17. Matrajt, L., Eaton, J., Leung, T. & Brown, E. R. Vaccine optimization for COVID-19: who to vaccinate first?. Sci. Adv. 7(6), eabf1374
(2021).
18. Mukandavire, Z. et al. Quantifying early COVID-19 outbreak transmission in South Africa and exploring vaccine efficacy scenarios.
PLoS One 15, e0236003 (2020).
19. Bartsch, S. M. et al. Vaccine efficacy needed for a COVID-19 coronavirus vaccine to prevent or stop an epidemic as the sole inter-
vention. Am. J. Prev. Med. 59, 493–503 (2020).
20. Makhoul, M. et al. Epidemiological impact of SARS-CoV-2 vaccination: Mathematical modeling analyses. Vaccines 8, 4. https://
doi.org/10.3390/vaccines8040668 (2020).
21. Gallagher, M. E. et al. Considering indirect benefits is critical when evaluating SARS-CoV-2 vaccine candidates. Nat Med. 27(1),
4–5 (2021).
22. Buckner, J. H., Chowell, G. & Springborn, M. R. Dynamic prioritization of COVID-19 vaccines when social distancing is limited
for essential workers. PNAS 118(16), e2025786118 (2021).
23. Moghadas, S. M. et al. The impact of vaccination on COVID-19 outbreaks in the United States. Clin. Infect. Dis. ciab079, https://
doi.org/10.1093/cid/ciab079 (2021).
24. Paltiel, A. D., Schwartz, J. L., Zheng, A. & Walensky, R. P. Clinical outcomes of a COVID-19 vaccine: Implementation over efficacy.
Health Aff. https://doi.org/10.1377/hlthaff.2020.02054 (2020).
25. Hogan, A. B. et al. Modelling the Allocation and Impact of a COVID-19 Vaccine (Imperial College London, 2020).
26. Bracis, C. et al. Widespread testing, case isolation and contact tracing may allow safe school reopening with continued moderate
physical distancing: A modeling analysis of King County, WA data. Infect. Dis. Modell. 6, 24–35. https://doi.org/10.1016/j.idm.
2020.11.003 (2021).
27. Centers for Disease Control and Prevention. COVID-19 Pandemic Planning Scenarios. https://www.cdc.gov/coronavirus/2019-
ncov/hcp/planning-scenarios.html#box.
28. Public Health-Seattle & King County. COVID-19 data dashboard. (2020). https://k ingco unty.g ov/d
epts/h
ealth/c ovid-1 9/d ata.a spx.
29. MIDAS. Online Portal for COVID-19 Modeling Research. (2020). https://midasnetwork.us/covid-19/.
30. Ferguson, N. M. et al. Impact of non-pharmaceutical interventions (NPIs) to reduce COVID-19 mortality and healthcare demand.
https://www.imperial.ac.uk/mrc-global-infectious-disease-analysis/covid-19/report-9-impact-of-npis-on-covid-19/.
31. Ferretti, L. et al. Quantifying SARS-CoV-2 transmission suggests epidemic control with digital contact tracing. Science 368,
eabb6936 (2020).
32. Thakkar, N. & Famulare, M. COVID-19 transmission was likely rising through April 22 across Washington State. Institute for
Disease Modeling (2020). https://covid.idmod.org/#/ResearchandReports.
33. Bedford, T. et al. Cryptic transmission of SARS-CoV-2 in Washington state. Science 370, 571–575. https://doi.org/10.1126/scien
ce.abc0523 (2020).
34. World Health Organization (WHO). WHO Target Product Profiles for COVID-19 Vaccines. (2020). https://www.who.int/publi
cations/m/item/who-target-product-profiles-for-covid-19-vaccines.
35. US Department of Health and Human Services: Food and Drug Administration, C. F. B. E. A. R. Development and Licensure
of Vaccines to Prevent COVID-19. (2020). https://www.fda.gov/regulatory-information/search-fda-guidance-documents/devel
opment-and-licensure-vaccines-prevent-covid-19.
36. Sullivan, K. Biden outlines plan to administer Covid-19 vaccines to Americans. CNN Politics (2021). https://www.cnn.com/2021/
01/15/politics/biden-administering-vaccines-plan/index.html.
37. Silva, C. Americans Could See A Vaccine By Mid-December, Says Operation Warp Speed Adviser. (2020). https://www.npr.org/
sectio ns/c orona virus-l ive-u
pdate s/2 020/1 1/2 2/9 37780 366/a meric ans-c ould-s ee-a-v accin e-b
y-m
id-d ecemb er-s ays-o
perat ion-w arp-
speed-adviser.
38. Centers for Disease Control and Prevention (CDC). Nationwide Commercial Laboratory Seroprevalence Survey. CDC COVID
Data Tracker (2021). https://covid.cdc.gov/covid-data-tracker/#national-lab.
39. Krause, P. et al. COVID-19 vaccine trials should seek worthwhile efficacy. Lancet 396, 741–743 (2020).
Scientific Reports | (2021) 11:15531 | https://doi.org/10.1038/s41598-021-94719-y 8
Vol:.(1234567890)www.nature.com/scientificreports/
40. Lipsitch, M., Siller, S. & Nowak, M. A. The evolution of virulence in pathogens with vertical and horizontal transmission. Evolution
50, 1729–1741 (1996).
41. Van Kerckhove, K., Hens, N., Edmunds, W. J. & Eames, K. T. D. The impact of illness on social networks: Implications for transmis-
sion and control of influenza. Am. J. Epidemiol. 178, 1655–1662 (2013).
42. The New York Times. See Coronavirus Restrictions and Mask Mandates for All 50 States. (2020). https://www.nytimes.com/inter
active/2020/us/states-reopen-map-coronavirus.html?auth=login-google.
43. Institute for Health Metrics and Evaluation (IHME). COVID-19 Projections. (2020). https://covid19.healthdata.org/global?view=
total-deaths&tab=trend.
44. Washington governor Jay Inslee. COVID-19 Reopening Guidance for Businesses and Workers. (2020). https://www.governor.wa.
gov/issues/issues/covid-19-resources/covid-19-reopening-guidance-businesses-and-workers.
45. Eikenberry, S. E. et al. To mask or not to mask: Modeling the potential for face mask use by the general public to curtail the
COVID-19 pandemic. Infect. Dis. Modell. 5, 293–308 (2020).
46. Islam, N. et al. Physical distancing interventions and incidence of coronavirus disease 2019: Natural experiment in 149 countries.
BMJ 370, m2743 (2020).
47. Koh, W. C., Naing, L. & Wong, J. Estimating the impact of physical distancing measures in containing COVID-19: An empirical
analysis. Int. J. Infect. Dis. 100, 42–49 (2020).
48. Duque, D. et al. Timing social distancing to avert unmanageable COVID-19 hospital surges. Proc. Natl. Acad. Sci. 117, 19873.
https://doi.org/10.1073/pnas.2009033117 (2020).
Acknowledgements
This work was partially supported by Grants from the National Institute of Allergy and Infectious Diseases of
the National Institutes of Health (UM1AI068635) and (R01 AI121129-04 to Dr. Schiffer). DAS, CB, MM, JTS
and DD were also supported by a Grant from Centers for Disease Control and Prevention (NU38OT000297-02)
through their cooperative agreement with the Council of State and Territorial Epidemiologists. DBR reported
support from the Washington Research Foundation.
Author contributions
H.J., L.M., D.D., M.S.C., J.T.S. and D.D. conceptualized the problem. H.J., J.T.S. and D.D secured funding. D.A.S,
C.B., M.M., E.B., D.B.R., J.T.S. and D.D.developed the methodology. D.A.S. and C.B. performed the analysis.
D.A.S., C.B., L.M., E.B., and D.B.R. created the figures. D.A.S, C.B., H.J., M.S.C and D.D wrote the first draft. All
authors interpreted results and reviewed the manuscript.
Competing interests
The authors declare no competing interests.
Additional information
Supplementary Information The online version contains supplementary material available at https://doi.org/
10.1038/s41598-021-94719-y.
Correspondence and requests for materials should be addressed to D.D.
Reprints and permissions information is available at www.nature.com/reprints.
Publisher’s note Springer Nature remains neutral with regard to jurisdictional claims in published maps and
institutional affiliations.
Open Access This article is licensed under a Creative Commons Attribution 4.0 International
License, which permits use, sharing, adaptation, distribution and reproduction in any medium or
format, as long as you give appropriate credit to the original author(s) and the source, provide a link to the
Creative Commons licence, and indicate if changes were made. The images or other third party material in this
article are included in the article’s Creative Commons licence, unless indicated otherwise in a credit line to the
material. If material is not included in the article’s Creative Commons licence and your intended use is not
permitted by statutory regulation or exceeds the permitted use, you will need to obtain permission directly from
the copyright holder. To view a copy of this licence, visit http://creativecommons.org/licenses/by/4.0/.
© The Author(s) 2021
Scientific Reports | (2021) 11:15531 | https://doi.org/10.1038/s41598-021-94719-y 9
Vol.:(0123456789)You can also read