Recruitment and representativeness of blood donors in the INTERVAL randomised trial assessing varying inter-donation intervals
←
→
Page content transcription
If your browser does not render page correctly, please read the page content below
Moore et al. Trials (2016) 17:458
DOI 10.1186/s13063-016-1579-7

 RESEARCH                                                                                                                                      Open Access

Recruitment and representativeness of
blood donors in the INTERVAL randomised
trial assessing varying inter-donation
intervals
Carmel Moore1,8, Thomas Bolton1,8, Matthew Walker1,8, Stephen Kaptoge1,8, David Allen2, Michael Daynes3,
Susan Mehenny4, Jennifer Sambrook5,6, Nicholas A. Watkins6, Gail Miflin7,8, Emanuele Di Angelantonio1,8,
Willem H. Ouwehand5,6,9, David J. Roberts2,8,10, John Danesh1,8 and Simon G. Thompson1,8,11*

  Abstract
  Background: The interpretation of trial results can be helped by understanding how generalisable they are to the
  target population for which inferences are intended. INTERVAL, a large pragmatic randomised trial of blood donors
  in England, is assessing the effectiveness and safety of reducing inter-donation intervals. The trial recruited mainly
  from the blood service’s static centres, which collect only about 10 % of whole-blood donations. Hence, the extent
  to which the trial’s participants are representative of the general blood donor population is uncertain. We compare
  these groups in detail.
  Methods: We present the CONSORT flowchart from participant invitation to randomisation in INTERVAL. We
  compare the characteristics of those eligible and consenting to participate in INTERVAL with the general donor
  population, using the national blood supply ’PULSE’ database for the period of recruitment. We compare the
  characteristics of specific groups of trial participants recruited from different sources, as well as those who were
  randomised versus those not randomised.
  Results: From a total of 540,459 invitations, 48,725 donors were eligible and consented to participate in INTERVAL.
  The proportion of such donors varied from 1–22 % depending on the source of recruitment. The characteristics of
  those consenting were similar to those of the general population of 1.3 million donors in terms of ethnicity, blood
  group distribution and recent deferral rates from blood donation due to low haemoglobin. However, INTERVAL
  participants included more men (50 % versus 44 %), were slightly older (mean age 43.1 versus 42.3 years), included
  fewer new donors (3 % versus 22 %) and had given more donations over the previous 2 years (mean 3.3 versus 2.2)
  than the general donor population. Of the consenting participants, 45,263 (93 %) donors were randomised. Compared
  to those not randomised, the randomised donors showed qualitatively similar differences to those described above.
  Conclusions: There was broad similarity of participants in INTERVAL with the general blood donor population of
  England, notwithstanding some differences in age, sex and donation history. Any heterogeneity of the trial’s results
  according to these characteristics will need to be studied to ensure its generalisability to the general donor population.
  Trial registration: Current Controlled Trials ISRCTN24760606. Registered on 25 January 2012.
  Keywords: Randomised trial, Recruitment, Representativeness, Generalisability, Blood donors, Blood donation

* Correspondence: interval@medschl.cam.ac.uk; sgt27@medschl.cam.ac.uk
1
 Department of Public Health and Primary Care, University of Cambridge,
Strangeways Research Laboratory, Worts Causeway, Cambridge CB1 8RN, UK
8
 NIHR Blood and Transplant Research Unit in Donor Health and Genomics,
Strangeways Research Laboratory, Worts Causeway, Cambridge CB1 8RN, UK
Full list of author information is available at the end of the article

                                      © 2016 The Author(s). Open Access This article is distributed under the terms of the Creative Commons Attribution 4.0
                                      International License (http://creativecommons.org/licenses/by/4.0/), which permits unrestricted use, distribution, and
                                      reproduction in any medium, provided you give appropriate credit to the original author(s) and the source, provide a link to
                                      the Creative Commons license, and indicate if changes were made. The Creative Commons Public Domain Dedication waiver
                                      (http://creativecommons.org/publicdomain/zero/1.0/) applies to the data made available in this article, unless otherwise stated.
Moore et al. Trials (2016) 17:458 Page 2 of 12 Background collections at the static donor centres reflects the One of the key roles of the National Health Service Blood focus, at that time, on the collection of platelet dona- and Transplant (NHSBT) is to provide an efficient supply tions at these sites. of blood and blood components to hospitals in England In this paper we describe recruitment to INTERVAL and North Wales. The INTERVAL trial is a parallel group, and investigate how representative the trial participants pragmatic, individually randomised controlled trial (RCT) were of the general donor population. which aimed to recruit approximately 50,000 blood do- nors registered with NHSBT [1]. INTERVAL seeks to ad- Methods dress an important question for NHSBT and potentially Selection and recruitment of participants blood services worldwide: What is the optimum frequency Recruitment of donors to the INTERVAL trial took of whole-blood donation to enhance blood supplies and place between June 2012 and June 2014. Donors were maintain donors’ health? The trial is sufficiently powered eligible to join the trial if they were aged 18 years or to provide evidence on whether donation intervals should older (to meet ethical requirements, with the normal be tailored to donor subgroups who are more or less sus- lower age limit for donation being 17 years old), fulfilled ceptible to iron deficiency [2]. The trial’s objectives are all routine criteria for blood donation, were willing to be driven by the need to meet the dual potential challenge of randomised to any of the trial’s intervention groups and increases in demand for blood as the population ages, and had an email address and access to the Internet (since difficulties in attracting new blood donors [3–5]. the trial collects data mainly via remote and web-based Giving a unit (about 0.5 litres) of whole blood is the methods). In addition, donors had to be willing to give most common type of blood donation and differs from blood at one of the 25 static donor centres; this condi- other donations involving the collection of specific blood tion was necessary to overcome NHSBT information components such as red cells, platelets or plasma. In technology safeguards to prevent donors giving at less current NHSBT practice, male and female whole-blood than standard donation intervals. donors can give blood as frequently as every 12 and Invitations were sent to specific groups (or ‘sources’) 16 weeks, respectively. During their 2-year involvement of donors during the recruitment period (Table 1). Ini- in the INTERVAL trial, participants were randomised to tially postal invitations were sent to donors registered at give blood at either these standard donation intervals or one of the 25 static donor centres. However, in order to more often, specifically every 12, 10 or 8 weeks for men meet the trial’s recruitment target, we broadened the and 16, 14 or 12 weeks for women. The trial’s primary pool of potential participants by extending postal or outcome is the number of whole-blood units donated email invitations to mobile session donors thought to be over 2 years, and the key secondary outcome is the Short most likely to join the trial (and transfer to a static Form Survey-36 composite measure of physical well- donor centre); email was preferred for large groups in being at 2 years [6]; the trial’s statistical analysis plan is order to reduce costs. In particular, we approached mo- provided in Additional file 1. A criticism of research bile session donors either because they had previously studies (especially RCTs) is a lack of consideration for agreed to give platelet donations at static centres or be- external validity and whether the findings are generalis- cause of the donor’s proximity to a static donor centre able to a wider setting than that in which they were (judged by the location of their usual mobile session or initially tested [7]. Therefore, the extent to which the NHSBT correspondence address). In addition, donors trial’s main findings (due to be reported in 2017) are ap- arriving at a static donor centre who had not received an plicable to future donation strategies will be influenced invitation could also be informed about INTERVAL. by how representative the INTERVAL participants are of Donors expressing an interest in the trial, and able to the general donor population. donate following NHSBT’s routine screening, were asked Anyone between the ages of 17 and 65 years can regis- to complete the trial consent form prior to giving their ter with NHSBT as a blood donor; once registered a usual donation [1]. Donors who were temporarily unable donor may continue donating up to and beyond 65 years to donate (for reasons such as failure to meet haemoglo- old if they meet all usual criteria for giving blood. In bin thresholds, recent overseas travel) had the opportun- 2013, more than 1.7 million whole-blood donations were ity to join the trial at their next donation visit, as long as made by almost 1 million donors at more than 23,000 the visit occurred within the recruitment period. donation venues across England and North Wales [8]. Approximately 90 % of these donations were made at Data collection community venues or ‘mobile sessions’ (e.g. village halls, Data used to populate the CONSORT flowchart were local schools). The remaining 10 % were made at the 25 derived from NHSBT’s national blood supply database premises run by NHSBT as ‘static’ donor centres across (PULSE) and the INTERVAL trial’s research database. England. The relatively small proportion of whole-blood PULSE covers all aspects of donor and donation
Moore et al. Trials (2016) 17:458                                                                                                 Page 3 of 12

Table 1 Description of recruitment sources for the INTERVAL trial
Recruitment source     Source description                                                                  Invitation period     Invitation type
Centre                 Donors registered at a static donor centre                                          Jun 2012 – Jan 2013   Letter
Mobile (platelet)      Mobile session donors who had previously registered an interest in giving           Jan 2013 – Oct 2013   Letter
                       platelets at a static donor centre
Mobile (10-mile)       Donors giving blood at a mobile session within 10 miles of a static donor centre    Jan 2013 – Oct 2013   Letter or email
Mobile (30-mile)       Donors with a correspondence address within 30 miles (but typically 20 miles)       Jan 2013 – Oct 2013   Email
                       of a static donor centre
No invitation          Donors giving blood at a static donor centre who expressed an interest in joining   Jun 2012 – Jun 2014   Not applicable
                       the trial but who did not receive a previous invitation

management: procedure codes are added to donors’ re-                       additionally completed the baseline questionnaire and
cords according to the type of donations given (e.g.                       were randomised.
platelet, whole-blood), and communication codes are                          In defining recruitment source, participants receiving
used to record types of messages sent to donors. New                       an invitation following their enrolment were deemed
communication codes were added to PULSE for donors                         not to have received a postal/email invitation. Where
invited to join INTERVAL from different sources                            participants had received more than one postal/email
(Table 1), along with procedure codes to enable tracking                   invitation type during the recruitment period, the invi-
of INTERVAL participants [1]. Further communication                        tation immediately prior to their enrolment in the study
codes were placed on the records of donors who, on at-                     was used to indicate their source of recruitment. For
tending a static donor centre during the recruitment                       donors who did not join the study and were sent more
period, expressed an interest in and/or enrolled in the                    than one invitation, the first one sent was taken as their
study.                                                                     invitation type.
   These enrolment codes served to activate the secure                       The general donor population, used as a comparator,
transfer of participants’ trial-relevant data from PULSE to                was defined as all donors registered with NHSBT who
the INTERVAL research database (held at the academic co-                   did not consent to INTERVAL but had attended an ap-
ordinating centre at the University of Cambridge). Receipt                 pointment during the INTERVAL recruitment period
of these data then triggered an email from the academic                    (11 June 2012 – 14 June 2014); see Fig. 1. To define
coordinating centre requesting consenting participants to                  donor characteristics it was necessary to fix an appropri-
complete the INTERVAL baseline questionnaire. Only                         ate reference date. For INTERVAL participants this date
those consenting participants who responded to this initial                corresponded to the date of their baseline attendance.
online questionnaire were subsequently randomised into                     For the general donor population, it was defined as par-
the trial [1].                                                             ticipants’ date of attendance nearest to the mid-point
   The PULSE database was also used to create a bespoke                    of the INTERVAL recruitment period (12 June 2013).
dataset on all registered NHSBT blood donors to com-                       Age at baseline was calculated from the attendance
pare the characteristics of the INTERVAL cohort with                       date and recorded date of birth. Ethnicity and ABO/
the general donor population. This dataset consisted of                    Rhesus D blood group were as recorded on NHSBT’s
entries for 3,362,757 donors, including INTERVAL par-                      PULSE database.
ticipants (identified by an anonymous study number).                         The focus of the analysis is on the magnitude of differ-
Information retrieved included individual-level data on                    ences between groups rather than their statistical signifi-
donors’ sex, age and ethnicity, ABO and Rhesus D blood                     cance. Given the very large numbers, even very small
group, NHSBT registration date, date of first attendance                   differences can have extreme P values. Hence, differ-
for donation (whether successful or not), date of first                    ences with 95 % confidence intervals (CI) are presented
successful donation and detailed information on the out-                   rather than P values.
comes of each attendance over the past 7 years. Geographic
reference data, held on PULSE, were used to calculate                      Results
distances between donors’ correspondence address and                       Participant recruitment
their nearest static donor centre.                                         Figure 2 summarises the status of participants at dif-
                                                                           ferent stages of recruitment. Between June 2012 and
Data analysis                                                              October 2013, more than 500,000 blood donors were
The INTERVAL cohort is defined as blood donors who                         sent an invitation, just under 100,000 attended one of
completed a consent form and were eligible to join the                     the 25 static donor centres during the recruitment
study. The INTERVAL trial comprises participants who                       period and of these 44 % expressed an interest in joining
Moore et al. Trials (2016) 17:458 Page 4 of 12
Fig. 1 Flow diagram showing the selection of donors forming the NHSBT general donor population
the trial and (on initial questioning) met the age and Inter- considerable size, however, their contribution to the
net/email criteria. There was a further group of approxi- INTERVAL cohort was not insubstantial (7,649 partici-
mately 11,000 donors who did not receive an invitation pants). The recruitment rate from the Mobile (platelet)
but who attended a recruitment centre for donation group was higher than from the other mobile session re-
and responded positively when asked by donor-centre cruitment sources, as expected due to their prior willing-
staff if they wished to enrol (the denominator for this ness to transfer to a static donor centre. However, as
group is unknown). this group represented a small pool of donors, the over-
Data collected by donation staff using a pre-defined all number of recruited participants from this source
questionnaire indicated that the main reason given for was relatively small.
not wanting to join the study was the time commitment
required (41 % of donors who gave a reason). About
16 % of donors wanted greater flexibility with respect to Comparison of INTERVAL donors to the general donor
donation appointments, 6 % were concerned about the population
donation frequency, 7 % were being evaluated as poten- The INTERVAL cohort represented approximately 4 %
tial platelet donors, 1 % disagreed with the aims of the of NHSBT’s 1.3 million general donor population. The
study and 29 % indicated that they had other reasons for characteristics of these groups are compared in Tables 3
not joining. and 4. Some notable differences were that the INTER-
The majority of donors who expressed an initial inter- VAL cohort included more men (50 % versus 44 %),
est in the trial then gave their consent to join the were slightly older (mean age: 43.1 versus 42.3 years,
INTERVAL cohort (93 %) with only a small proportion with a lower proportion of 17–24 year olds: 13 % versus
who either did not meet the study/donation criteria or 18 %) and lived closer to a static donor centre (62 % ver-
for other reasons decided not to enrol. Only those mem- sus 19 % within 0–4 miles, partly by design). In both
bers of the INTERVAL cohort who completed the trial’s samples the majority of individuals (91 %) reported their
baseline questionnaire were subsequently randomised; as ethnicity as ‘white’ (Table 3); however, after excluding
such the INTERVAL trial represents 93 % of the INTER- donors with missing values (Table 4), this proportion
VAL cohort (and 87 % of all those expressing an inter- was slightly lower in the INTERVAL cohort. The distri-
est). The numbers of male and female randomised bution of blood groups was similar. By design the entire
donors were similar, and there was an even split of do- INTERVAL cohort attended a static donor centre at
nors into the gender-specific treatment allocations. baseline. Several factors suggest that the INTERVAL co-
hort was a more long-standing and dedicated group of
Participation by sources of recruitment donors: they had a slightly longer history of donation
The participation by subgroups of donors according to with NHSBT (10.7 versus 8.6 years), a much lower pro-
their sources of recruitment is shown in Table 2. The portion of new donors (3 % versus 22 %) and had given,
largest group of INTERVAL participants (31,945) came on average, more whole-blood donations during the
from the pool of donors who had attended a static donor 2 years prior to baseline (mean 3.2 versus 2.1). The pro-
centre prior to recruitment — this group showed the portion of donors with a deferral over the previous 2 years
highest consent rate to the INTERVAL cohort (22.1 % of (both for low haemoglobin and any other reason) ap-
all invitations sent) and trial recruitment (20.4 %). In peared higher in the INTERVAL cohort. However, when
contrast, the recruitment rate was lower in mobile ses- this is expressed relative to the average number of whole-
sion donors who either donated within 10 miles (2.8 %) blood donations given, the deferral rate for low haemoglo-
or had a correspondence address within 30 miles (1.3 %) bin is similar to that in the general donor population (i.e.
of a static donor centre. As these sources were of a 2.1 % and 2.3 % per donation, respectively).Moore et al. Trials (2016) 17:458 Page 5 of 12
Invitation sent 540459
Excluded 445274
Did not attend donation at Donor Centre
during recruitment period
Attended Donation 95185
Attended Donor Centre during
recruitment period
Excluded 53499
Not interested or ineligible as < 18y old
and/or no access to internet/ email1
Expressed interest 41686
Excluded 3795
Eligible, did not consent (1265)
Expressed interest 108342 Ineligible, donation criteria not met
(2489) for reasons including low Hb -
1007, medical - 535, infection/contact -
203, administrative - 296, failed
venepuncture -118, travel - 94, Clinical
- 75, skin piercing - 61, surgery - 52,
other - 15, false reaction - 12,
Consented and eligible vaccination - 9, apheresis sample - 6,
INTERVAL cohort 48725 blood pressure -5, malaria test - 1.
Ineligible, agedMoore et al. Trials (2016) 17:458 Page 6 of 12
Table 3 Demographic characteristics of the NHSBT general donor population and of the INTERVAL cohort and trial
Demographics INTERVAL cohort
n (%) or mean (SD) INTERVAL cohort NHSBT general donor Randomised in INTERVAL Not randomised
population trial
All donors 48,692 (100.0 %)a 1,330,506 (100.0 %) 45,235 (100.0 %)a 3457 (100.0 %)
Sex
Male 24,212 (49.7 %) 586,372 (44.1 %) 22,456 (49.6 %) 1756 (50.8 %)
Female 24,480 (50.3 %) 744,134 (55.9 %) 22,779 (50.4 %) 1701 (49.2 %)
Age at baseline (years) 43.1 (14.3) 42.3 (15.0) 43.3 (14.2) 39.9 (14.7)
Age at baseline
17–24 6424 (13.2 %) 234,367 (17.6 %) 5679 (12.6 %) 745 (21.6 %)
25–34 10,236 (21.0 %) 235,238 (17.7 %) 9468 (20.9 %) 768 (22.2 %)
35–44 9095 (18.7 %) 246,225 (18.5 %) 8500 (18.8 %) 595 (17.2 %)
45–-54 11,158 (22.9 %) 304,927 (22.9 %) 10,456 (23.1 %) 702 (20.3 %)
55–-64 8822 (18.1 %) 221,143 (16.6 %) 8362 (18.5 %) 460 (13.3 %)
65+ 2957 (6.1 %) 88,606 (6.7 %) 2770 (6.1 %) 187 (5.4 %)
Ethnicity
White 44,192 (90.8 %) 1,207,593 (90.8 %) 41,259 (91.2 %) 2933 (84.8 %)
Asian 1127 (2.3 %) 31,829 (2.4 %) 941 (2.1 %) 186 (5.4 %)
Black African 118 (0.2 %) 3852 (0.3 %) 105 (0.2 %) 13 (0.4 %)
Black Caribbean 307 (0.6 %) 4971 (0.4 %) 271 (0.6 %) 36 (1.0 %)
Black other 31 (0.1 %) 743 (0.1 %) 29 (0.1 %) 2 (0.1 %)
Chinese 164 (0.3 %) 3831 (0.3 %) 141 (0.3 %) 23 (0.7 %)
Mixed 679 (1.4 %) 14,838 (1.1 %) 606 (1.3 %) 73 (2.1 %)
Other 138 (0.3 %) 3558 (0.3 %) 122 (0.3 %) 16 (0.5 %)
Unknown 1936 (4.0 %) 59,291 (4.5 %) 1761 (3.9 %) 175 (5.1 %)
Blood group
A RhD positive (A+) 14,737 (30.3 %) 397,277 (29.9 %) 13,768 (30.4 %) 969 (28.0 %)
A RhD negative (A-) 3744 (7.7 %) 97,450 (7.3 %) 3489 (7.7 %) 255 (7.4 %)
B RhD positive (B+) 4244 (8.7 %) 102,650 (7.7 %) 3877 (8.6 %) 367 (10.6 %)
B RhD negative (B-) 1070 (2.2 %) 27,317 (2.1 %) 993 (2.2 %) 77 (2.2 %)
O RhD positive (O+) 17,642 (36.2 %) 460,501 (34.6 %) 16,398 (36.3 %) 1244 (36.0 %)
O RhD negative (O-) 5542 (11.4 %) 138,349 (10.4 %) 5138 (11.4 %) 404 (11.7 %)
AB RhD positive (AB+) 1293 (2.7 %) 33,817 (2.5 %) 1199 (2.7 %) 94 (2.7 %)
AB RhD negative (AB-) 402 (0.8 %) 9550 (0.7 %) 368 (0.8 %) 34 (1.0 %)
Unknown 18 (0.0 %) 63,595 (4.8 %) 5 (0.0 %) 13 (0.4 %)
Distance to nearest static donor centre (miles)b
0–4 30,405 (62.4 %) 252,068 (18.9 %) 27,971 (61.8 %) 2434 (70.4 %)
5–9 9801 (20.1 %) 245,652 (18.5 %) 9236 (20.4 %) 565 (16.3 %)
10–29 7203 (14.8 %) 584,850 (44.0 %) 6832 (15.1 %) 371 (10.7 %)
30–59 775 (1.6 %) 220,388 (16.6 %) 730 (1.6 %) 45 (1.3 %)
60+ 98 (0.2 %) 18,045 (1.4 %) 93 (0.2 %) 5 (0.1 %)
Unknown 410 (0.8 %) 9503 (0.7 %) 373 (0.8 %) 37 (1.1 %)
Donor status at baselinec
New 1392 (2.9 %) 288,653 (21.7 %) 1147 (2.5 %) 245 (7.1 %)
Occasional 7912 (16.2 %) 226,507 (17.0 %) 7053 (15.6 %) 859 (24.8 %)
More frequent 39,388 (80.9 %) 815,346 (61.3 %) 37,035 (81.9 %) 2353 (68.1 %)Moore et al. Trials (2016) 17:458 Page 7 of 12
Table 3 Demographic characteristics of the NHSBT general donor population and of the INTERVAL cohort and trial (Continued)
Demographics INTERVAL cohort
n (%) or mean (SD) INTERVAL cohort NHSBT general donor Randomised in INTERVAL Not randomised
population trial
Donations (over last 2 years prior to baseline)d
All donations 3.28 (2.00) 2.24 (2.37) 3.33 (2.00) 2.61 (1.92)
Whole-blood donations 3.19 (1.81) 2.08 (1.87) 3.23 (1.80) 2.55 (1.80)
Other donations 0.10 (1.05) 0.16 (1.64) 0.10 (1.07) 0.06 (0.79)
Deferrals (during the 2 years prior to baseline)e
Deferral for low haemoglobin 3308 (6.8 %) 63,071 (4.7 %) 3094 (6.8 %) 214 (6.2 %)
Any other deferral 14,628 (30.0 %) 327,747 (24.6 %) 13,632 (30.1 %) 996 (28.8 %)
Length of NHSBT donation history at baseline (years)f 10.7 (8.4) 8.58 (8.44) 10.9 (8.4) 8.47 (8.02)
Venue type attended at baselineg
Static centre 48,692 (100.0 %) 99,724 (7.5 %) 45,235 (100.0 %) 3457 (100.0 %)
Mobile 0 (0.0 %) 1,230,782 (92.5 %) 0 (0.0 %) 0 (0.0 %)
a
The characteristics of 33 donors in the INTERVAL cohort (of whom 28 are in the INTERVAL trial) could not be identified in the PULSE database due to merged
donor records
b
The correspondence address (used to calculate ’Distance to nearest static donor centre’ and derive ’Region’) was correct at the time the data were extracted
from PULSE (Nov 2015). Historical correspondence addresses were not available in PULSE
c
’New’ has been defined according to the classification used by NHSBT, i.e. an individual who has not previously provided a full donation is considered to be a
new donor. ’Occasional’ and ’More frequent’ have been defined as less than or equal to two full donations in the last 5 years and more than two full donations in
the last 5 years, respectively
d
Including donations where volume equals ’Normal’, ’Overweight’ or ’Missing’ (not including donations where volume equals ’Empty’ or ’Underweight’)
e
Deferrals during the 2 years prior to baseline were summarised as counts of people with a deferral for low haemoglobin levels and more generally deferral for
reasons other than low haemoglobin
f
Length of donation history with NHSBT at baseline was defined as the period of time between baseline and the minimum of date of registration, date of first
attendance (whether successful or not) and date of first successful donation
g
For venue type, some old venues that are no longer used do not have an associated PULSE venue code. In these cases, although venue type was missing,
because the only venues that were no longer being used were mobile venues, we have assumed that the venue type was mobile
SD, Standard deviation
Table 4 Differences (95 % CIs): INTERVAL cohort versus NHSBT general donor population and INTERVAL randomised versus not
randomised
Demographics INTERVAL cohort
a
mean or proportion (%) INTERVAL NHSBT general donor Difference (95 % CI) Randomised Not randomised Difference (95 % CI)
cohort population
Sex: Male (%) 49.7 % 44.1 % 5.7 % (5.2 %, 6.1 %) 49.6 % 50.8 % -1.2 % (-2.9 %, 0.6 %)
Age at baseline (years) 43.1 42.3 0.73 (0.59, 0.87) 43.3 39.9 3.37 (2.88, 3.86)
Ethnicity: White (%) 94.5 % 95.0 % -0.5 % (-0.7 %, -0.3 %) 94.9 % 89.4 % 5.5 % (4.5 %, 6.6 %)
Blood group: O (%)b 47.6 % 47.3 % 0.4 % (-0.1 %, 0.8 %) 47.6 % 47.9 % -0.2 % (-2.0 %, 1.5 %)
Distance to nearest static donor 6.29 18.1 -11.8 (-12.0, -11.7) 6.37 5.24 1.12 (0.82, 1.43)
centre (miles)
Number of all donationsc 3.28 2.24 1.04 (1.02, 1.06) 3.33 2.61 0.73 (0.66, 0.80)
c
Deferral for low haemoglobin (%) 6.8 % 4.7 % 2.1 % (1.8 %, 2.3 %) 6.8 % 6.2 % 0.6 % (-0.2 %, 1.5 %)
Any other deferral (%)c 30.0 % 24.6 % 5.4 % (5.0 %, 5.8 %) 30.1 % 28.8 % 1.3 % (-0.2 %, 2.9 %)
Length of NHSBT donation history 10.7 8.58 2.15 (2.07, 2.22) 10.9 8.47 2.43 (2.14, 2.72)
at baseline (years)
a
Those with missing values excluded
b
Blood group O includes both RhD groups
c
During the 2 years prior to baselineMoore et al. Trials (2016) 17:458 Page 8 of 12
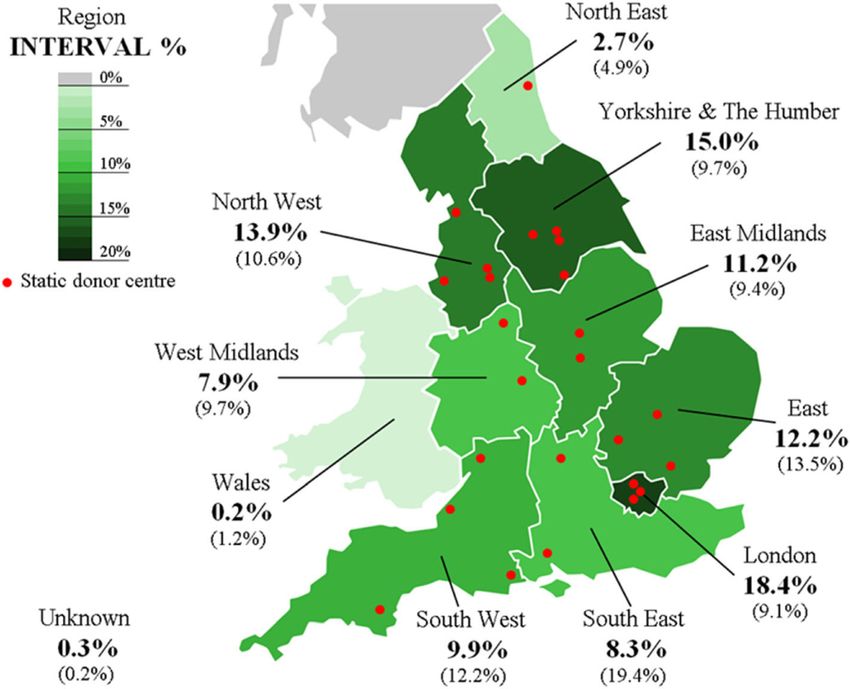
Fig. 3 Geographical distribution of the INTERVAL cohort (NHSBT general donor population in brackets) by region
of the baseline questionnaire. Whereas the sex ratio was who were less than 35 years old and of blood group O
comparable, randomised participants were slightly older Rh(D) positive. In contrast, the ‘No invitation’ donors
(mean age: 43 versus 40 years, with a lower proportion showed the highest proportion of participants in the 17–
aged 17–24 years: 13 % versus 22 %), were more likely 24 year age group, the highest proportion of new donors,
to be of white ethnicity (91 % versus 85 %), were more the shortest average history of donation and the fewest
likely to have been a frequent donor (82 % versus 68 %) donations in the 2 years prior to baseline.
and had given a greater average number of donations in
the 2 years prior to baseline (3.3 versus 2.6). The groups
were similar in terms of the distribution of blood groups Discussion
and proportion of deferrals for both low haemoglobin More than 45,000 blood donors have been successfully re-
and any other reason. Surprisingly, the data do not sug- cruited into the NHSBT-embedded INTERVAL trial, mak-
gest that members of the INTERVAL cohort who had a ing it the largest randomised study, worldwide, of the
correspondence address at a greater distance from a impact of more frequent donations on blood supplies and
static donor centre were less likely to be randomised. donor health. Unusually, our study had the ability to com-
pare directly a range of participants’ characteristics be-
Comparison of donors by recruitment source tween the INTERVAL trial and the target population. We
As shown in Table 5, the characteristics of the INTERVAL found that there was broad similarity of participants in
cohort participants from the Centre, Mobile (10-mile) and INTERVAL with the general blood donor population of
Mobile (30-mile) sources were generally similar (with England, notwithstanding some differences in age, sex
some differences as expected in the distances between do- and donation history. These observations lend support to
nors’ correspondence address and a static donor centre). the generalisability of the trial’s future results, at least for
Both the Mobile (platelet) and ‘No invitation’ participants NHSBT. Nevertheless, any heterogeneity of the trial’s re-
showed characteristics distinct from other groups. The sults according to the characteristics listed above will
Mobile (platelet) group showed a markedly greater pro- need to be studied to ensure its generalisability to the
portion of men and, from their donation history, were general donor population (Additional file 1). The current
shown to be an especially committed group of donors. analysis also shows that a broad range of donors have par-
This group also had a lower proportion of participants ticipated in INTERVAL, enabling future assessment ofMoore et al. Trials (2016) 17:458 Page 9 of 12 Table 5 Demographic characteristics of the INTERVAL cohort by recruitment sourcea Demographics INTERVAL cohort n (%) or mean (SD) Centre Mobile (platelet) Mobile (10-mile) Mobile (30-mile) No invitation All donors 31,929 (100.0 %) 1741 (100.0 %) 5237 (100.0 %) 2409 (100.0 %) 7376 (100.0 %) Sex Male 15,996 (50.1 %) 1379 (79.2 %) 2196 (41.9 %) 1110 (46.1 %) 3531 (47.9 %) Female 15,933 (49.9 %) 362 (20.8 %) 3041 (58.1 %) 1299 (53.9 %) 3845 (52.1 %) Age at baseline (years) 43.7 (14.4) 51.2 (13.2) 41.9 (11.7) 45.2 (13.6) 38.3 (14.2) Age at baseline 17–24 3866 (12.1 %) 82 (4.7 %) 544 (10.4 %) 268 (11.1 %) 1664 (22.6 %) 25–34 6688 (20.9 %) 166 (9.5 %) 1102 (21.0 %) 365 (15.2 %) 1915 (26.0 %) 35–44 5849 (18.3 %) 263 (15.1 %) 1205 (23.0 %) 430 (17.8 %) 1348 (18.3 %) 45–54 7233 (22.7 %) 446 (25.6 %) 1576 (30.1 %) 612 (25.4 %) 1291 (17.5 %) 55–64 5938 (18.6 %) 495 (28.4 %) 797 (15.2 %) 734 (30.5 %) 858 (11.6 %) 65+ 2355 (7.4 %) 289 (16.6 %) 13 (0.2 %) 0 (0.0 %) 300 (4.1 %) Ethnicity White 28,924 (90.6 %) 1644 (94.4 %) 4774 (91.2 %) 2227 (92.4 %) 6623 (89.8 %) Asian 790 (2.5 %) 12 (0.7 %) 83 (1.6 %) 36 (1.5 %) 206 (2.8 %) Black African 78 (0.2 %) 1 (0.1 %) 13 (0.2 %) 2 (0.1 %) 24 (0.3 %) Black Caribbean 201 (0.6 %) 5 (0.3 %) 38 (0.7 %) 21 (0.9 %) 42 (0.6 %) Black other 24 (0.1 %) 0 (0.0 %) 2 (0.0 %) 3 (0.1 %) 2 (0.0 %) Chinese 120 (0.4 %) 1 (0.1 %) 12 (0.2 %) 4 (0.2 %) 27 (0.4 %) Mixed 451 (1.4 %) 11 (0.6 %) 67 (1.3 %) 33 (1.4 %) 117 (1.6 %) Other 94 (0.3 %) 2 (0.1 %) 14 (0.3 %) 4 (0.2 %) 24 (0.3 %) Unknown 1247 (3.9 %) 65 (3.7 %) 234 (4.5 %) 79 (3.3 %) 311 (4.2 %) Blood group A RhD positive (A+) 9414 (29.5 %) 635 (36.5 %) 1612 (30.8 %) 854 (35.5 %) 2222 (30.1 %) A RhD negative (A-) 2405 (7.5 %) 209 (12.0 %) 371 (7.1 %) 207 (8.6 %) 552 (7.5 %) B RhD positive (B+) 2783 (8.7 %) 121 (7.0 %) 436 (8.3 %) 258 (10.7 %) 646 (8.8 %) B RhD negative (B-) 737 (2.3 %) 45 (2.6 %) 96 (1.8 %) 0 (0.0 %) 192 (2.6 %) O RhD positive (O+) 11,589 (36.3 %) 485 (27.9 %) 1995 (38.1 %) 1073 (44.5 %) 2500 (33.9 %) O RhD negative (O-) 3859 (12.1 %) 199 (11.4 %) 515 (9.8 %) 0 (0.0 %) 969 (13.1 %) AB RhD positive (AB+) 880 (2.8 %) 40 (2.3 %) 164 (3.1 %) 0 (0.0 %) 209 (2.8 %) AB RhD negative (AB-) 256 (0.8 %) 7 (0.4 %) 48 (0.9 %) 17 (0.7 %) 74 (1.0 %) Unknown 6 (0.0 %) 0 (0.0 %) 0 (0.0 %) 0 (0.0 %) 12 (0.2 %) Distance to nearest static donor centre (miles) 0–4 21,298 (66.7 %) 570 (32.7 %) 3446 (65.8 %) 508 (21.1 %) 4583 (62.1 %) 5–9 5778 (18.1 %) 471 (27.1 %) 1329 (25.4 %) 818 (34.0 %) 1405 (19.0 %) 10–29 3946 (12.4 %) 649 (37.3 %) 377 (7.2 %) 1057 (43.9 %) 1174 (15.9 %) 30–59 538 (1.7 %) 36 (2.1 %) 37 (0.7 %) 13 (0.5 %) 151 (2.0 %) 60+ 68 (0.2 %) 2 (0.1 %) 7 (0.1 %) 7 (0.3 %) 14 (0.2 %) Unknown 301 (0.9 %) 13 (0.7 %) 41 (0.8 %) 6 (0.2 %) 49 (0.7 %) Donor status at baseline New 453 (1.4 %) 0 (0.0 %) 6 (0.1 %) 8 (0.3 %) 925 (12.5 %) Occasional 4180 (13.1 %) 35 (2.0 %) 1039 (19.8 %) 411 (17.1 %) 2247 (30.5 %) More frequent 27,296 (85.5 %) 1706 (98.0 %) 4192 (80.0 %) 1990 (82.6 %) 4204 (57.0 %)
Moore et al. Trials (2016) 17:458                                                                                                  Page 10 of 12

Table 5 Demographic characteristics of the INTERVAL cohort by recruitment sourcea (Continued)
Demographics                                           INTERVAL cohort
n (%) or mean (SD)                                     Centre            Mobile (platelet)   Mobile (10-mile)   Mobile (30-mile)   No invitation
Donations (during the 2 years prior to baseline)
    All donations                                      3.47 (1.87)       4.28 (1.68)         3.06 (1.66)        3.35 (1.75)        2.39 (2.54)
    Whole-blood donations                              3.38 (1.73)       4.13 (1.51)         3.05 (1.65)        3.33 (1.73)        2.15 (1.92)
    Other donations                                    0.08 (0.89)       0.15 (1.08)         0.01 (0.29)        0.02 (0.32)        0.23 (1.87)
Deferrals (during the 2 years prior to baseline)
    Deferral for low haemoglobin                       2597 (8.1 %)      73 (4.2 %)          242 (4.6 %)        119 (4.9 %)        277 (3.8 %)
    Any other deferral                                 10,174 (31.9 %)   461 (26.5 %)        1238 (23.6 %)      660 (27.4 %)       2095 (28.4 %)
Length of NHSBT donation history at baseline (years)   11.2 (8.4)        14.2 (8.4)          10.2 (8.1)         11.4 (9.1)         7.78 (7.71)
a
For definitions see footnotes to Table 3

the impact of increased donation frequency in relevant                     donation history indicated that the INTERVAL partici-
subgroups.                                                                 pants represented a longer-standing group of donors
   INTERVAL required a substantial commitment from                         who had donated more frequently. It is possible that a
donors: blood donations at regular (and more frequent                      more dedicated group of donors may make greater ef-
than usual) intervals over a 2-year period and comple-                     forts (or have fewer other commitments) to attend
tion of online questionnaires every 6 months. Exclusion                    more frequent donations. Hence, any impact observed
criteria were kept to a minimum, and all eligibility cri-                  in INTERVAL of inviting donors to give blood more
teria were necessary for operational considerations (at-                   frequently to increase blood supplies may be greater
tendance at a static donor centre), ethics requirements                    than that achieved in the general donor population.
(aged ≥18 years), scalability (access to email/Internet)                   The data in this paper, however, suggest that the
and data integrity (completion of questionnaires at base-                  INTERVAL cohort were similarly resilient to iron defi-
line). Recruitment was initially planned only from do-                     ciency following repeat donations as the general donor
nors registered at a static donor centre. However, only                    population, with deferral rates for low haemoglobin
about half of the donors from this source attended one                     levels similar in both groups.
of these centres during the recruitment period, rather                        Donor centres offer permanent sites for blood dona-
than the approximately 70 % that would have been needed                    tion, which are typically open daily during the working
to meet recruitment targets. Given the shortfall in recruit-               week in specific geographical locations across England.
ment from the static donor centres, extra recruitment                      This is in contrast to temporary ‘mobile’ donation ses-
strategies were employed which focused on targeting                        sions in community venues, which visit locations at
groups of mobile session donors who were most likely to                    weekly or less frequent intervals. It is possible that the
be able to transfer to a static donor centre to take part in               trial’s requirement to attend a static donor centre con-
the study and/or were of a significant size. The take-up                   tributed, in part, to the subtle differences in characteris-
rate in these groups of donors, while lower than that for                  tics of INTERVAL participants compared to the general
the static centre donors, contributed almost 20 % of the                   donor population. In recent years, NHSBT’s strategy has
total participants recruited into INTERVAL.                                been to increase the proportion of whole-blood dona-
   The trial’s participation rates varied according to                     tions collected in static donor centres; in 2015/2016 ap-
the groups of donors targeted. Furthermore, donors                         proximately 15 % of whole-blood donations were made
recruited from different sources showed distinct char-                     at donor centres, and the target is to increase this to
acteristics; this was especially the case for the Mobile                   25 % in 2020/2021. It is possible, therefore, that the
(platelet) and ‘No invitation’ participants. For the former                INTERVAL cohort may be more representative of the
group, this can probably be attributed to the commitment                   general donor population in the future.
that is required to give platelet donations up to every                       Not all donors who consented to participate in INTER-
2 weeks and NHSBT’s platelet donor recruitment strategy.                   VAL were randomised. Compared to the randomised
   We compared the characteristics of participants ran-                    group, consenting but non-randomised participants had a
domised into INTERVAL with the general donor popu-                         higher proportion of younger donors, a shorter history of
lation, focusing on features potentially relevant to trial                 donation, a smaller proportion of more frequent donors, a
outcomes. Although we found that the populations                           lower average number of donations and a higher propor-
were generally similar, there were subtle differences in                   tion of non-white ethnic groups. Perhaps surprisingly, a
sex and age distributions. Moreover, a comparison of                       greater proportion of randomised participants had a
Moore et al. Trials (2016) 17:458 Page 11 of 12
correspondence address that was 10 miles or more from a Donation Centres (managers): Birmingham (Aziz T); Bradford (Davies C);
static donor centre. Brentwood (Wakeman P); Bristol (Dent A); Cambridge (Wakeman A); Edgware
(Anthony B); Gloucester (Dent A); Lancaster (Weatherill C); Leeds CBTU
(Forsyth A); Leeds City (Butterfield C); Leicester (Wright T); Liverpool
Conclusions (Johnston K); Luton (Brooks C); Manchester Norfolk House (Littler L);
Manchester Plymouth Grove (Blair D); Newcastle (Woods L); Nottingham
It is important that the conclusions from the analysis of (Stanley S); Oxford (Franklin G); Poole (Sharpe S); Plymouth (Smith D);
RCT data can be appropriately generalised and, for this Sheffield (Botham L); Southampton (Williams C); Stoke (Sowerbutts G);
reason, RCTs should try to establish formally how repre- Tooting (Thake M); West End (Patel S)
NHSBT collaborators: Appleton MJ, Bays E, Bowyer G, Clarkson S, Halson S,
sentative the individuals recruited are of the target popu- Holmes K, Humphreys G, Johnston K, Mehenny S, Parvin-Cooper L, Towler J,
lation. This is often not easy to achieve, but we had the Watkins NA
opportunity to do this because of the existence of a na- UK Biocentre: Fenton J, King A, Muhammed O, Oates N, Peakman T, Ryan C,
Spreckley K, Stubbins C, Williams J (previous members Brennan J, Mochon C,
tional database. There was broad similarity of partici- Taylor S, Warren K).
pants in INTERVAL with the general blood donor
population of England, notwithstanding some differences Funding
The trial is funded by NHS Blood and Transplant. The trial’s coordinating centre
in age, sex and donation history. Factors which differ be- at the Department of Public Health and Primary Care at the University
tween the recruited sample and the target population of Cambridge has received core support from the UK Medical Research
will need to be investigated as potential effect modifiers Council, the British Heart Foundation and the UK National Institute of Health
Research (Cambridge Biomedical Research Centre). Investigators at the
in the analysis of the trial data (using subgroup analyses University of Oxford have been supported by the Research and Development
or tests of interaction). However, it is not possible to Programme of NHSBT, the NHSBT Howard Ostin Trust Fund, the UK National
rule out differences in unmeasured variables or unob- Institute of Health Research (Oxford Biomedical Research Centre) through
the programme grant NIHR-RP-PG-0310-1004 and the Oxford Biomedical
servable characteristics, so there always remains an Research Centre.
element of uncertainty in generalising the results of
RCTs. Furthermore, we acknowledge that the extrapo- Availability of data and materials
The data that support the findings of this study are available from NHS
lation of INTERVAL’s results to blood services outside Blood and Transplant, but restrictions apply to the availability of these data,
England and Wales is not straightforward, because which were used under license for the current study, and so are not publicly
blood services differ in several important respects, such available. However, data are available from the authors upon reasonable
request and with permission of NHS Blood and Transplant.
as donor selection practices and policies about allow-
able inter-donation intervals. Authors’ contributions
JD and DJR are the chief investigators. WHO, SGT, CM and EDA are
co-investigators. CM, TB, MW, DA, MD, SM, JS, NW, GM and EDA contributed
Additional file to the acquisition of data. MW, TB and SK cleaned and analysed the data. CM,
TB, MW, SK, DA, MD and SGT contributed to the interpretation of the data. CM
Additional file 1: INTERVAL trial – statistical analysis plan for principal and SGT wrote the initial draft of the paper. TB, MW, SK, DA, SM, NW, GM, EDA,
paper. (PDF 74 kb) DJR, JD and SGT contributed to writing the paper. SGT supervised the analysis
of data and writing of the manuscript. All authors have contributed to the
conception, design and execution of the trial, and have read and approved this
Abbreviations submitted version of the manuscript.
CI: Confidence interval; NHSBT: National health service blood and transplant;
RCT: Randomised controlled trial Authors’ information
This section is not applicable.
Acknowledgements
Trial Steering Committee: Armitage J (independent chair), Danesh J (co-chief Competing interests
investigator), Di Angelantonio E, Donovan J (independent member), Ford I The authors declare that they have no competing interests.
(independent member), Henry R, Hunt BJ (independent member), le Huray B
(lay member), Mehenny S, Miflin G, Moore C (trial coordinator), Ouwehand Consent for publication
WH, Pearson J, Roberts DJ (co-chief investigator), Stredder M, Thompson SG This section is not applicable.
(chief statistician), Walker M, Watkins NA (previous members McDermott A,
Ronaldson C, Thomson C, Tolkien Z, Williamson L) Ethics approval and consent to participate
Trial Management Committee: Allen D, Danesh J, Di Angelantonio E, Henry R, The trial has received ethics committee approval from the National Research
Mehenny S, Moore C, Ouwehand WH, Roberts DJ, Sambrook J, Walker M Ethics Service Committee East of England - Cambridge East (Research
(previous members Hammerton T, Thomson C, Tolkien Z) Ethics Committee reference 11/EE/0538). Participants have provided
Independent Data Monitoring Committee: Kaptoge S (independent informed consent.
statistician), Murphy G, Newland AC (chair), Wheatley K (previous members
Greaves M (chair), Turner M) Author details
1
Data Management Team: Bolton T, Daynes M, Halson S, Spackman S, Walker Department of Public Health and Primary Care, University of Cambridge,
M (previous members Momodu A) Strangeways Research Laboratory, Worts Causeway, Cambridge CB1 8RN, UK.
Interval Study Administration Team (ISAT): Addy J, Barrass P, Stennett L 2
NHS Blood and Transplant – Oxford Centre, Level 2, John Radcliffe Hospital,
Interval Helpdesk: Burton S, Dingwall H, Henry R (previous members Clarke V, Headley Way, Oxford OX3 9BQ, UK. 3NHS Blood and Transplant, Northway,
Potton M, Thomson C) Filton, Bristol BS34 7QH, UK. 4NHS Blood and Transplant, Longley Lane,
Haematology Review Group: Allen D, Bruce D, Choudry F, Di Angelantonio E, Sheffield S5 7JN, UK. 5Department of Haematology, University of Cambridge,
Ghevaert C, Johnston K, Kelly A, King A, Mehenny S, Miflin G, Mo A, Moore C, Cambridge Biomedical Campus, Long Road, Cambridge CB2 OPT, UK. 6NHS
Ouwehand WH (co-chair), Page L, Richardson P, Roberts DJ (co-chair), Blood and Transplant, Cambridge Biomedical Campus, Long Road,
Sambrook J, Senior P, Umrania Y, Walker M, Wong H Cambridge CB2 OPT, UK. 7NHS Blood and Transplant, Reeds Crescent,Moore et al. Trials (2016) 17:458 Page 12 of 12
Watford, Herts WD24 4QN, UK. 8NIHR Blood and Transplant Research Unit in
Donor Health and Genomics, Strangeways Research Laboratory, Worts
Causeway, Cambridge CB1 8RN, UK. 9Wellcome Trust Sanger Institute,
Wellcome Genome Campus, Hinxton, Cambridge CB10 1SA, UK. 10Radcliffe
Department of Medicine, University of Oxford, John Radcliffe Hospital,
Headley Way, Oxford OX3 9DU, UK. 11Department of Public Health and
Primary Care, The INTERVAL Trial Coordinating Centre, University of
Cambridge, Cambridge CB1 8RN, UK.
Received: 21 May 2016 Accepted: 31 August 2016
References
1. Moore C, Sambrook J, Walker M, Tolkien Z, Kaptoge S, Allen D, Mehenny S,
Mant J, Di Angelantonio E, Thompson SG, et al. The INTERVAL trial to
determine whether intervals between blood donations can be safely
and acceptably decreased to optimise blood supply: study protocol for
a randomised controlled trial. Trials. 2014;15:363.
2. NHS Blood and Transplant. Blood 2020. A strategy for the blood supply in
England and North Wales. http://www.nhsbt.nhs.uk/download/blood-2020.
pdf. Accessed 6 May 2016.
3. Williamson LM, Devine DV. Challenges in the management of the blood
supply. Lancet. 2013;381(9880):1866–75.
4. Fendrich K, Hoffmann W. More than just aging societies: the demographic
change has an impact on actual numbers of patients. J Public Health. 2007;
15(5):345–51.
5. Bonig H, Schmidt M, Hourfar K, Schuttrumpf J, Seifried E. Sufficient blood,
safe blood: can we have both? BMC Med. 2012;10:29.
6. Maruish ME. User’s manual for the SF-36v2 Health Survey. 3rd ed. Lincoln, RI:
QualityMetric Incorporated; 2011.
7. Rothwell PM. External validity of randomised controlled trials: “to whom do
the results of this trial apply?”. Lancet. 2005;365(9453):82–93.
8. Public Health England. Safe supplies: reflecting on the population. Annual
Review from the NHS Blood and Transplant/Public Health England
Epidemiology Unit. 2013. https://www.gov.uk/government/uploads/system/
uploads/attachment_data/file/448050/NHSBT_PHE_Epidemiology_Unit_
Annual_Review_2013_FINAL_-_Revised.pdf. Accessed 6 May 2016.
Submit your next manuscript to BioMed Central
and we will help you at every step:
• We accept pre-submission inquiries
• Our selector tool helps you to find the most relevant journal
• We provide round the clock customer support
• Convenient online submission
• Thorough peer review
• Inclusion in PubMed and all major indexing services
• Maximum visibility for your research
Submit your manuscript at
www.biomedcentral.com/submitYou can also read