Auckland City Rail Link - Summary Report
←
→
Page content transcription
If your browser does not render page correctly, please read the page content below
Auckland
City Rail Link
  Summary Report

      13 May 2011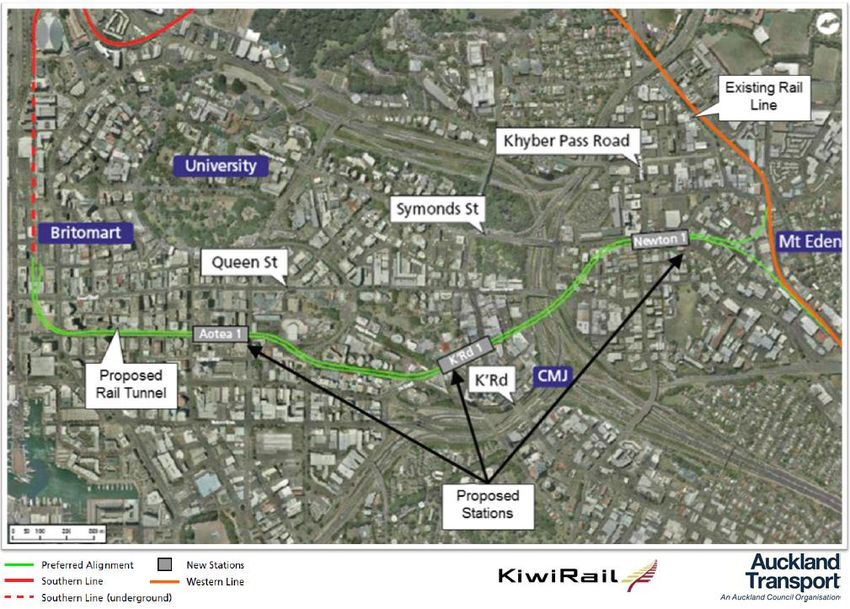
Auckland Transport and Auckland Council Advisors

This report has been prepared with international support of the following advisors :

John Bolland Consulting Ltd

Robert Cervero, Director, University of California, Berkeley, Transportation Centre,
and Director, Institute of Urban & Regional Development

CITY RAIL LINK Summary Report                                                          Page 2 of 24
Contents

   1          Executive Summary........................................................................................... 4

   2          Background ....................................................................................................... 5

   3          Auckland Transport & Auckland Council Update ............................................... 5

   4         Strategic Context ................................................................................................ 6

   5         City Rail Link – Project Description ..................................................................... 7

   6         Transport Benefits of City Rail Link ..................................................................... 8

   7         Wider Economic Benefits of City Rail Link ........................................................ 11

   8         Summary Evaluation ........................................................................................ 14

   9         CRL Project Timing .......................................................................................... 16

   10         Conclusion ....................................................................................................... 16

   11         Annexes .......................................................................................................... 16

CITY RAIL LINK Summary Report                                                                                           Page 3 of 24

1       Executive Summary
         Historically, a range of proposals have been developed for a rail tunnel through the
         Auckland city centre.

         In 2010, a preferred route for a tunnel, the City Rail Link, was identified and work
         commenced on a concept design and Business Case to support designation of the
         route. In November 2010, Auckland Transport (AT) and Auckland Council (AC) in
         partnership with KiwiRail Group (KRG) presented the case for the City Rail Link to
         the government for its consideration.

         The Minister of Transport (MoT) requested a review of the City Rail Link (or CBD
         Loop) proposal. That Review has been undertaken over the last 5 months and its
         report is expected to be released shortly.

         The government led Review has provided AT and AC with an opportunity to further
         review the assumptions, refine the costs and benefits, and identify the further work
         needed to secure funding for the City Rail Link. All of this work has been made
         available to the government led Review team and the same material used to
         prepare this report.

         The Review confirmed that the costs of constructing and operating the City Rail Link
         are accurately estimated, with a small increase in operating expenditure arising from
         new information which became available after the original Business Case was
         completed.

         There was, however, a wide disparity between the benefits assessed by the
         MoT/Treasury Review compared with those estimated as part of the AT and AC
         update. This is largely due to the lower transport benefits assessed as part of the
         government led Review.

         AT and AC consider that, taking into account the wider transport policy initiatives
         which are planned, the City Rail Link would deliver overall benefits exceeding
         overall costs, with the benefit cost ratio ranging from 1.1 to 2.3 (BCR = 1.1 to 2.3).

         While there are differences between the findings of the government led Review and
         the AT/AC update, AT and AC and their advisors are strongly of the view that the
         overall evaluation results are sufficiently robust to justify the immediate
         commencement of the designation process, particularly as the CRL is economically
         justifiable in terms of its transport related benefits alone. This process needs to
         commence as soon as possible to minimise the potential for any development to
         increase costs, delay the project, or even prevent its implementation.

         AT and AC acknowledge that, in line with all major project development
         programmes, more work needs to be done to further develop the case for funding of
         the City Rail Link. This work will take full account of central government‟s
         requirements for the development of public sector funding requests.

         In addition to progressing with this work, this report recommends that the
         Auckland Council resolve to immediately commence the process to secure
         and protect the route of the Auckland City Rail Link.

         This summary report presents AT and AC‟s key findings arising from participation in
         the government led Review of the City Rail Link project.

CITY RAIL LINK Summary Report                                                          Page 4 of 24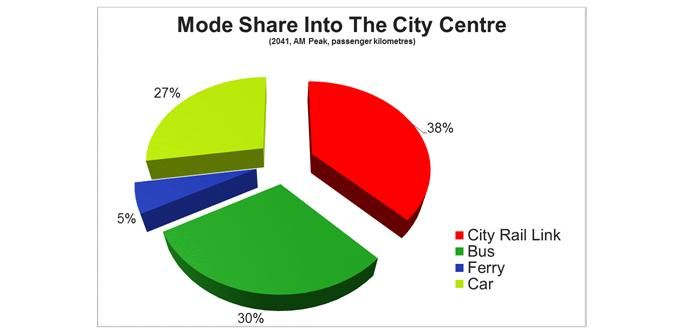
2           Background
             In 2008, the then Minister of Finance, Hon Dr Michael Cullen, wrote to the Chair of
             the New Zealand Railways Corporation stating that it “was in the long term public
             interest to secure and protect the CBD tunnel route even though construction may
             not take place for many years” and advising that it was “appropriate for ONTRACK
             to assist in the protection of the CBD tunnel route by acting to protect the route at
             the earliest appropriate opportunity.”1

             In 2009, the Auckland Regional Transport Authority (ARTA) and KRG (previously
             ONTRACK) commenced an investigation to designate a route for the City Rail Link
             (CRL) for inclusion in Auckland‟s District Plans. A preferred option for the route was
             identified in early 2010 and approved by ARTA and KiwiRail. This preferred option
             was endorsed by the Auckland Regional Council, Auckland City Council, and the
             Auckland Regional Transport Committee.

             In 2010, a consortium of AECOM, Parsons Brinckerhoff and Beca (APB&B) was
             appointed by KRG and ARTA to identify the preferred route, prepare the concept
             design for the preferred option together with the business case to support the Notice
             of Requirement (NOR), and prepare the NOR documentation. In November 2010,
             AT, AC and KRG released the findings of this work (the Business Case) and
             forwarded these findings to the Government for its consideration. The work
             undertaken by APB&B was reviewed and endorsed by PWC.

             The Minister of Transport asked the MoT and Treasury, in conjunction with the New
             Zealand Transport Agency (NZTA), to review the Business Case (the Review). The
             purpose of the Review was to formally review the Business Case and provide
             advice on the merits of the CRL as a transport and economic investment, and when
             the project might be required. The Review was also intended to assist in
             determining if, how and when to progress with the CRL. Management from AT and
             AC assisted in the analysis undertaken for the Review, supported by APB&B and
             others.

             The Review was completed in May 2011 and the report setting out its findings is
             expected to be released by the Minister of Transport shortly.

3           Auckland Transport & Auckland Council Update
             The government led Review process has provided AT and AC with an opportunity to
             further review the assumptions in the Business Case, to refine the costs and
             benefits of the CRL, and the transport measures which would be put in place to
             support its operation (AT/AC Update). It has also assisted in identifying the further
             work which will need to be undertaken to secure funding for the CRL.

             AT and AC management and advisors have contributed to the Update in their
             specific areas of expertise. The opening page lists AT and AC advisors.

             This summary report sets out the findings of the AT/AC Update. Further detailed
             information on the CRL can be found in the Business Case at
             www.aucklandtransport.govt.nz/improving-transport/current-
             projects/rail/pages/cbdraillink.aspx.

1
    Letter from Minister of Finance to Chair NZRC dated 1 May 2008.

CITY RAIL LINK Summary Report                                                              Page 5 of 24
4           Strategic Context
             Auckland is New Zealand‟s biggest city and its largest regional economy. It is home
             to more than 1.4 million people, one third of New Zealand‟s population. It
             contributes 35 per cent of New Zealand‟s gross domestic product (GDP) and
             provides 32 per cent of employment. It plays a fundamental role in ensuring the
             economic success of New Zealand as a whole and will continue to do so.

             Over the next 30 years, Auckland‟s population and its importance to New Zealand
             are projected to increase. Over that period, 75 per cent of New Zealand‟s
             population growth is expected to occur in Auckland. By 2040, 2.1 million people are
             expected to live in Auckland, an estimated 42 per cent of New Zealand‟s population.

             Auckland‟s city centre plays a pivotal role. Of the 611,000 jobs in the region, 13 per
             cent are located in the CBD. The Auckland city centre provides the location for
             many of New Zealand‟s corporate head offices and employment in many high-value
             industries. These include 22 per cent of New Zealand‟s financial and services
             employees (11,300 employees), 17 per cent of information, media and
             communication services employees (6,500 employees), and 12 per cent of the
             professional, scientific and technical services employees (16,440 employees)2.

             Auckland‟s city centre is also a centre for culture, recreation and leisure and a focus
             for international tourism, with 30 per cent of all bed nights in New Zealand spent in
             Auckland city centre accommodation3. It is also an education centre providing for
             the majority of Auckland‟s tertiary students, and contains New Zealand‟s largest
             container port.

             Auckland‟s city centre relies heavily on its accessibility and quality of life for its
             continued prosperity and future development. Currently, around 20,000 people live
             in the city centre and there are some 90,000 employees and 50,000 tertiary
             students. Land use projections indicate that the usually resident population of the
             city centre will increase by 80,000 people by 2041, and employment by 60,000.

             The ability of private transport to meet this growth will be severely limited by the
             capacity of streets in the city centre, parking constraints, and demands from buses
             and pedestrians. There are already significant constraints in the existing transport
             network, for example, within the roading network most approaches to the city centre
             are at or near capacity in peak periods. The bus network is already under pressure
             with significant constraints projected to occur in Symonds Street from 2014, Albert
             Street in 2016 to 2020, and Fanshawe Street by 2019.

             The rail system also faces capacity constraints, primarily as a result of the limited
             capacity of the Britomart terminus. Once electrification is completed and the 10
             minute peak timetable put in place, Britomart‟s practical capacity of 21 trains per
             hour in each direction will be reached. Patronage growth is expected to continue
             after electrification resulting in trains becoming progressively fuller, and placing
             stress on the Britomart station facilities. However, the ability of rail system to handle
             significant growth in patronage demand will be constrained by the limitations of
             Britomart‟s terminus configuration.

             A further increase in demand for travel will impose critical pressure on the transport
             network serving the city centre and, without further investment, will result in
             worsening congestion, unreliability and delay.

2
    Statistics NZ Business Demography dataset 2010
3
    NZ Hotel Council

CITY RAIL LINK Summary Report                                                                 Page 6 of 24
Investment in the transport network to cater for increased travel demand will be
essential if Auckland is to achieve its goal of a thriving regional economy and
becoming the world‟s most liveable city.
The Business Case considered a range of transport solutions to meet the future
growth needs of the city centre.
Three options were identified and developed as part of the analysis. These were:
On surface bus capacity improvements
Central area bus tunnel with three stations
City centre rail tunnel with three stations (CRL).
The CRL was assessed to provide the most cost effective means of meeting the
projected growth in transport demand to the city centre as it provides a dedicated
rapid transit corridor through the city centre unaffected by traffic congestion. It
unlocks latent capacity within the existing rail network that cannot currently be
exploited due to the constraints of Britomart.
The CRL also provides the greatest opportunity to address the risks associated with
Britomart as a terminus station with fixed capacity, and to improve its resilience. As
the number of trains increases and patronage rises following the introduction of new
electric trains, the risk of delay at Britomart increases with a consequential impact
on reliability across the rail network.
Investment in upgrading Auckland‟s rail system over the last 10 years has
demonstrated the willingness of Aucklanders to change their travel habits and use
rail, with patronage increasing from 2.2 million trips million per annum to 9.5 million,
a growth of 332 per cent.
5 City Rail Link – Project Description
The CRL provides for a 3.5 kilometre double track underground electrified rail line
running under the Auckland city centre from Britomart to the Western Line near the
existing Mt Eden station. Britomart would become a through station and three
intermediate stations would be provided:
Aotea – under Albert Street between Wellesley and Victoria Streets
Karangahape Road – under the intersection of Pitt Street and Karangahape Road
Newton – under Symonds Street between the intersections with Khyber
Pass/Newton Road and Mt Eden and New North Roads.
A map of the proposed CRL route and stations is attached as Annex 1.
The CRL would have the potential to provide up to 30 trains per hour with enhanced
signalling. This would provide for between 30 and 60 services per hour through the
CRL stations, compared with the maximum 21 trains per hour which will be able to
operate into Britomart after electrification.
The cost of building the CRL, including property acquisition costs, is estimated to be
in the range of $2 billion to $2.38 billion (at 2010 prices). In addition, operation of
more rail services enabled by the CRL will require additional rail network capital
investment of $120 million to $130 million, and $240 million for more electric trains
during the first 10 years following the opening of the CRL. Additional operating and
maintenance costs of $18.1 million per annum will also be incurred.
CITY RAIL LINK Summary Report Page 7 of 24
6 Transport Benefits of City Rail Link
This section describes the transport benefits which would result from
implementation of the CRL.
Rail will benefit the users of the rail system, bus users, and those who continue to
drive. Rail has the ability to move more people more efficiently than other modes
during peak traffic periods when congestion is at its highest, freeing up Auckland‟s
congested motorways and arterials for freight, commercial, and other trips that
cannot use public transport but are vital to economic development. Auckland‟s rail
network closely parallels the southern and north western motorways, maximising
the decongestion benefits.
More passengers boarding and alighting from trains at Britomart is likely to increase
the potential for delays to services as the station facilities come under increased
stress. Delays to trains at Britomart frequently result in knock-on delays across the
network. Passengers are generally intolerant of unpredictable delays to services,
so increasing reliability problems at Britomart could be expected to result in
passengers choosing other modes rather than rail or choosing not to work in the city
centre, reducing the benefits from having a large concentration of employment.
Changing Britomart station from a terminus station into a through station will also
enable significantly increased train frequencies which will:
Address the problems expected to arise following electrification when patronage
will continue to rise and trains will get progressively fuller
Provide for improvements in accessibility for both the city centre and the rail
network as a whole
Increase the effectiveness and longevity of the Northern Busway reducing the
need for suburban bus services from the south, west and east out of Britomart
and the congested Albert Street bus corridor
Enable the rail network to be extended further and more efficiently due to the
cheaper per kilometre operational cost of electric trains compared to diesels.
The additional patronage opportunities as well as the benefits and costs of any
future extensions are not included in the AT/AC Update
Expand the number of stations accessible by a single trip.
CITY RAIL LINK Summary Report Page 8 of 24Table 1 below illustrates the journey time improvements which would result from the
implementation of the CRL and illustrates the network wide impact of the project.
Table 1 : Estimated PT Journey Times to CBD Stations
Estimated PT Journey Times to CBD Stations (Minutes)
Origin Newton Karangahape Rd Aotea Britomart
(1) (1) (1)
Before After Before After Before After Before After
(2) (2)
Henderson 43 33 40 34 50 35 47 37
(2) (2)
New Lynn 30 20 40 22 45 23 34 24
(2)
Morningside 16 6 28 7 28 8 22 10
(3) (4) (4) (4) (5) (4) (4)
Grafton 14 3 13 5 23 7 14 9
(5) (4) (5) (4) (4)
Newmarket 17 6 17 7 17 8 10 10
(6) (2)
Panmure 45 27 47 25 32 23 19 19
(2) (2)
Onehunga 53 26 57 27 40 29 27 27
(6) (7) (2) (7)
Middlemore 50 34 65 35 46 36 34 34
(6) (7) (2) (7)
Manukau City 60 41 75 42 55 44 42 42
(6) (7) (2) (7)
Papakura 71 55 80 56 67 57 55 55
Notes:
(1) Rail plus walking time
(2) Average Bus journey time
(3) Walking time only
(4) Via Newtown and Eastern connection with Western line
(5) Bus plus walk
(6) Train plus bus plus walk
(7) Includes changing trains at Newmarket
Does not provide for any improvements for electrification over diesel
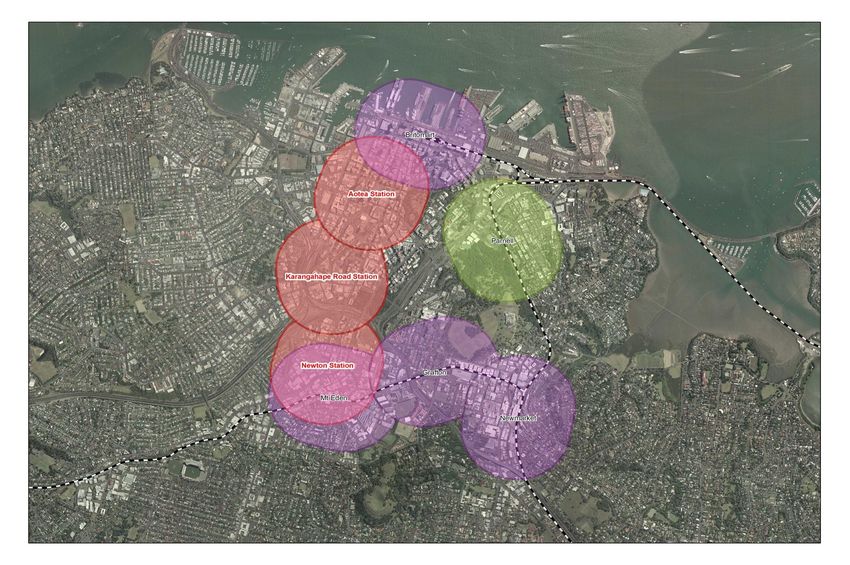
Providing three additional city centre stations also creates excellent direct access to
city centre commercial, employment, shopping, tourist and cultural activities
unaffected by road congestion. It gives commuters, shoppers and tourists a
demonstrably cost and time effective alternative to using a motor vehicle. Further, it
significantly expands the viable city centre area as journey times are reduced and
accessibility is improved. Annex 2 illustrates the significant improvement in city
centre accessibility which would result from the CRL.
Implementation of the CRL would be supported by a range of policies and external
trends including:
Improved bus rail feeder services
Wider park and ride provision
Increased city centre parking charges
Rising fuel prices.
Taken together, the transport outcomes delivered by the CRL during the congested
morning peak traffic period by 2041 are projected to be:
Between 25,000 and 31,000 people will travel to the city centre by train i.e.
at least 20,000 more people will use rail to get to the city centre than at
present.
CITY RAIL LINK Summary Report Page 9 of 24 Reduction of around 8,600 car trips in the city centre in congested peak
traffic periods.
Public transport mode share into the city centre will be around 69 per cent of
trips, up from its current level of 46 per cent. Of this, the rail mode share will
be 25 per cent, bus 39 per cent and car 31 per cent.
The Auckland rail network will attract between 23,000 and 29,000 more boardings
each morning peak period than if there were no CRL, because of the higher
frequencies across the entire network resulting from removing the constraint of the
Britomart terminus. There will also be 14,000 to 19,000 more people using rail to
get to the city centre than if the CRL is not built.
When travel distance is taken into account, rail becomes the dominant mode of
travel to the city centre in the congested morning peak traffic period. The key
economic driver of the transport benefits of the CRL for the regional transport
system is that rail is more effective than any other mode in reducing congestion.
This is because people who use rail travel longer distances than those using other
modes, including buses and cars. As a result, rail is the most effective in removing
long distance car trips from congested motorways and arterials.
Taking the travel distances by mode into account, mode shares for travel into the
city centre during the congested morning peak traffic period change dramatically.
With the CRL in place, rail accounts for 38 per cent of passenger kilometres
compared to 30 per cent for bus and 27 per cent for car.
Figure 1 below illustrates the projected mode share of passenger kilometres in
2041.
CITY RAIL LINK Summary Report Page 10 of 24Table 2 below illustrates the overall transport benefits of the Business Case, the
Review and the AT/AC Update. The table shows the Present Values over 30 years
at discount rate of 8 per cent.
Table 2 : Overall Result - Transport Benefits
Original Business Government Review AT / AC Update
Case ($M) ($M) ($M)
Additional Cumulative Additional Cumulative Additional Cumulative
230 230 220 220 548 548
Patronage Demand Impacts
Application of revised annualisation
285 515 50 270 112 660
factors
Application of capacity constraints 455 970 65 335 203 863
Application of CBD congestion
349 1,319 52 387 94 957
assumptions
Extra CBD employment – low 62 1,019
Extra CBD employment – high 249 1,206
Benefits from reduced unreliability as
173
a result of overcrowding
Total Benefits (Low to High) 1,319 387 1,192 / 1,379
The AT/AC Update suggests that the potential transport benefits of the CRL are
between $1.2 billion and $1.4 billion.
7 Economic Benefits Of City Rail Link
This section provides a summary of the transformational benefits that are likely to
arise from the implementation of the CRL and the conventional assessment of the
wider economic benefits (WEBs) as conducted in the Review.
The CRL is considered to be a transformational project as it will cause structural
change to the determinants of travel (land use, population and economic activity)
across Auckland. By contrast, conventional benefit cost analysis (including WEBS
as calculated in the Review) requires no change in these factors. Benefits that
come about from a transformational project are therefore distinct from the
conventional definition of WEBs. As the Review has proceeded on the basis that
the CRL is a conventional (i.e. non- transformational) transport project, the scope of
the assessment is limited.
Conventional WEBs are direct and subsequent flow-on benefits for an economy that
are created by new transport infrastructure. These benefits arise as the economy
as a whole adjusts and responds to the changes in transport efficiency, and are
over and above those direct effects identified for users of the transport network.
CITY RAIL LINK Summary Report Page 11 of 24The CRL performs very well in terms of conventional WEBs, highlighting a project
which will enhance the economic potential of Auckland‟s city centre in particular,
and the Auckland economy in general. This occurs by increasing the efficiency of
New Zealand‟s largest and most productive economy, increasing accessibility and
reducing transport costs for firms and consumers in the first instance, and
enhancing Auckland firms‟ competitiveness.
The WEBs for the CRL were originally calculated as part of the Business Case. A
peer review of the WEBs by Professor Robert Cervero4, commissioned by APP&B,
reinforced that “on balance … the APB&B analysis is thoughtful, well grounded,
objective, reasonably transparent, and appropriately measured in its interpretations,
assumptions, and forecasts”5.
MoT engaged Steer Davies Gleave (SDG) to assist with the Review. The Review
then recalculated the conventional WEBs, and incorporated several new categories
and improved the accuracy of the Business Case calculations. APB&B then
recalculated the agglomeration effects taking into account SDG‟s review and
concerns of the Review group. Due to data and time limitations, the WEBs were
largely calculated as a proportion of conventional direct transport benefits, agreed to
within the Review6.
4
Robert Cervero is Director, University of California, Berkeley, Transportation Centre, and Director, Institute of Urban & Regional
Development.
5 Cervero, R., 2011, „Peer Review for Auckland CBD Rail Link Urban Regeneration Benefits‟
6
Sensitivity testing was completed on a range of employment figures for job relocation benefits, but no consensus was reached as to the
base scenario.
CITY RAIL LINK Summary Report Page 12 of 24Table 3 summarises the range of WEB estimates for the CRL.
2
Table 3: Wider Economic Benefits
Original
Government
Business AT/AC Update Per cent of
Review
Case Estimate conventional
Estimate
Estimate ($m) transport
($m)
($m) benefits
Transport benefits 1,319 387 1,192 1,379 -
Agglomeration 185 128 393 455 33*
Imperfect competition - 10 30 34 2.5*
Labour supply - 19 57 66 4.8*
Productivity gains from job 3
1 3,333 147 147 591 12-43
relocation
4/
Total WEBs 185 3,333 304 627 1,146 53-82
Increase in the size of the
0-1,300
regional economy
56
Total including regional growth 627-2,446
1
These figures differ in their assumption on the number of employees who will be relocated into the CBD. APB&B
assumed 22,000 employees would relocate into the CBD. Central government has settled on 5,000, while
Auckland Council has used a range between 5,000 and 20,000.
2
A significant share of the benefits from an increase in the size of the regional economy have not been captured in
the analysis.
3
Termed ‘urban regeneration effects’ in the Business Case
4
APB&B conducted two pieces of analysis to avoid double counting.
5
By 2021, the Auckland economy would be around 71Bn. If the project generated an increase of 0.36% in the
Auckland economy (an indicative figure calculated by NZIER in the AWHC study, indicating the effect of a second
harbour crossing on the Auckland economy), this would amount to 1.3Bn in net present value terms. This is not
necessarily additive, as some of these benefits will have been captured in other categories. However, leading
economic agencies support that a component of this effect is additional to the benefits already calculated (note:
not all this effect would equate to a net benefit).
6
This was not agreed to by the Review
* Agreed on by the Review
Note – all figures Net Present Value applying 8% discount rate for 30 year period.
Conventional WEBs are expected to generate an additional 53 per cent to 82 per
cent of total conventional transport benefits or between $627 million and $1.146
billion over a 30 year appraisal period (at an 8% discount rate). When compared to
other urban rail projects and measured as a proportion of conventional transport
benefits, each category of WEB falls within previously established ranges7.
The CRL performs very well in terms of conventional WEBs. This is not surprising
given the urban spatial structure of Auckland‟s economy. The relatively high
additional effect of conventional WEBs is explained by the concentration of sectors
in the city centre that benefit from co-location, together with the anticipated
centralisation of high-value employment activity into the city centre. The latter effect
is significant because of the substantial productivity differential between the city
7
The exception to this is net job relocation benefits where only three projects have been assessed. As such, no meaningful comparison
could be made.
CITY RAIL LINK Summary Report Page 13 of 24centre and the rest of Auckland, reflecting the role of the city centre as a key driver
of growth for Auckland and New Zealand.
This assessment has not considered the transformational benefits which are likely
to arise from the implementation of the CRL. The project is intended to increase
land use intensity around the city centre, to increase net inward migration and to
increase economic activity. The assessment of conventional WEBs holds each of
these factors constant. Accordingly, the Review does not in AT and AC‟s view
provide a full assessment of the CRL‟s value.
8 Summary Evaluation
The Review confirmed that the costs of constructing and operating the CRL were
accurately estimated with around an 8 per cent increase, due mainly to operational
expenditure increases arising from new information becoming available after the
Business Case was completed.
There is a wide disparity between the results arising from the Business Case, the
Review and the AT/AC Update, largely due to the lower transport benefits assessed
by the Review.
The benefits and costs of the CRL are set out in Table 4 below comparing the
Business Case, the Review and the AT/AC Update.
Table 4 shows that the CRL has a transport related benefit to cost ratio ranging
between 1.0 and 1.1 and is a viable transport project in its own right. When WEBs
are added, the BCR increases to between 1.1 and 2.3.
CITY RAIL LINK Summary Report Page 14 of 24Table 4: Overall Benefits and Costs of the CRL
Original Business Case Government Review AT / AC Update
Benefit Category
Benefits Costs Benefit to Benefits Costs Benefit to Benefits Costs Benefit to
$m NPV $m NPV cost ratio $m NPV $m NPV cost ratio $m NPV $m NPV cost ratio
Transport benefits 1,319 387 1,192 to 1,379
Bus cost savings 43 43 43
Agglomeration benefits 185 128 393 to 455
Combined total (consistent with EEM and comparable with
1,547 1,569 1.0 558 1,699 0.3 1,628 to 1,877 1,699 1.0 to 1.1
other transport projects)
Imperfect competition 10 30 to 34
Labour supply 19 57 to 66
Productivity gains from job relocation 3,333 148 147 to 591
2
Total including wider economic benefits outside of the EEM 4,695 1,569 3.0 735 1,699 0.4 1,862 to 2,568 1,699 1.1 to 1.5
Increase in the size of the regional economy 0 to 1,300
1
Total including regional growth 1,862 to 3,868 1,699 1.1 to 2.3
1. By 2021, the Auckland economy would be around 71Bn. If the project generated an increase of 0.36% in the Auckland economy (an indicative figure calculated by NZIER in the
AWHC study, indicating the effect of a second harbour crossing on the Auckland economy), this would amount to 1.3Bn in net present value terms. This is not necessarily
additive, as some of these benefits will have been captured in other categories. However, leading economic agencies support the view that a component of this effect is
additional to the benefits already calculated (note: not all this effect would equate to a net benefit).
2. Total excludes agglomeration benefits
CITY RAIL LINK Summary Report
Page 15 of 249 CRL Project Timing
It is estimated that the CRL can be completed within 7.5 to 10 years, depending upon
the procurement method chosen. The design and consent phase is estimated to take
between 2.5 and 4 years, while the design, construction and commissioning phase is
estimated to take between 5 and 6 years.
Assuming the project proceeds by July 2011, the CRL could be constructed and
commissioned by 2019 at the earliest or, taking a more conservative approach, by
mid-2021.
10 Conclusion
The updated evaluation undertaken by AT and AC concludes that the benefit to cost
ratio of the City Rail Link ranges from 1.1 to 2.3, clearly demonstrating that benefits
outweigh costs.
While there are differences between the findings of the government led Review and
the AT/AC Update, AT and AC and their advisors are strongly of the view that the
overall evaluation results are sufficiently robust to justify the immediate
commencement of the designation process, particularly as the CRL is economically
justifiable in terms of its transport related benefits alone.
It is essential this process commences as soon as possible. Delay could result in
significant difficulties, including the potential for development to increase costs, delay
the CRL Project or even prevent its implementation.
AT and AC acknowledge that work needs to be done to further develop the case for
funding. This work will be needed to support the AT and AC‟s own requirements to
ensure value for money, and any bids for funding from central government and the
private sector. This work will take full account of central government‟s requirements
for the development of funding requests.
11 Annexes
Annex 1 City Rail Link proposed route and station location
Annex 2 City Rail Link – existing and proposed station catchments
Annex 3 City Rail Link Wider Economic Benefits, Executive Summary
CITY RAIL LINK Summary Report Page 16 of 24ANNEX 1 - City Rail Link Proposed Route and Station Location
CITY RAIL LINK Summary Report
Page 17 of 24ANNEX 2 - City Rail Link – Existing Station Catchments
CITY RAIL LINK Summary Report
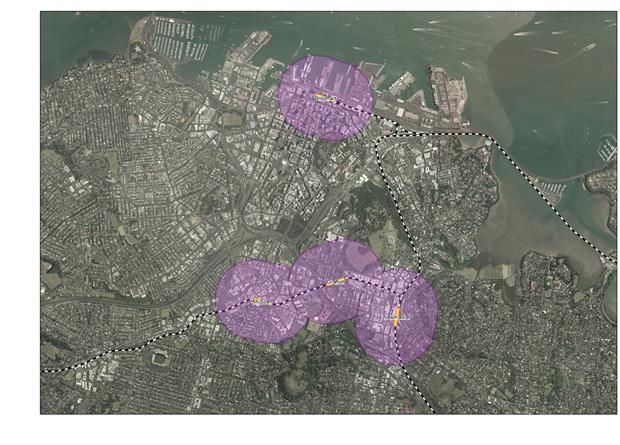
Page 18 of 24ANNEX 2 - City Centre Rail Link – Proposed Station Catchments
CITY RAIL LINK Summary Report
Page 19 of 24ANNEX 3 - Assessment of Wider Economic Benefits for CRL
(Co-authored by Auckland Council‟s Economic Development Group, Market Economics
and NZIER)
Executive Summary
Scope
The objective of this report is to consider an appropriate basis for evaluating the City Rail
Loop (CRL), which is believed to be a transformational project. It also summarises the
wider economic benefits (WEBs) as calculated under a conventional analysis. This is
supported by an upcoming background document titled „Assessment of Wider Economic
Benefits for the Auckland City Rail Loop‟, co-authored by Auckland Council‟s Economic
Development 1 Market Economics Ltd and NZIER.
Key Issues
Auckland Council officers view the CRL as a transformational project as it is likely to cause
structural change to the determinants of travel (land use, population and economic activity)
across Auckland.
The evaluation to date is based on conventional appraisal, which does not capture many of
the benefits of transformational projects. Auckland Council officers support WEBs in
principle, but demonstrate how transformational project benefits are distinct from WEBs.
As the CRL is a transformational project, its benefits cannot be captured by conventional
appraisal and therefore, a BCR does not fairly reflect the value for money of the project.
Specifically, it cannot take account of potentially large benefits arising from changes to the
urban spatial structure, land use intensification, increased inward migration and a larger
economy.
Auckland Council officers seek to ensure that the CRL evaluation is appropriate and
comprehensive, and able to provide a robust basis for future decisions – including route
protection. The assessment scope is limited, as the Review to date has proceeded on the
basis that the CRL is a conventional (ie non-transformational) transport project. The Mayor
has reiterated that the project is likely to be transformational. Auckland Council officers
need to do further work to develop the case for this.
The size of the Auckland economy and rapid growth rate mean other projects may also be
considered „transformational‟, and it is important that robust methodologies for such
projects are developed and applied on a consistent basis nationally.
1. Background
The CRL WEBs were originally calculated in the Business Case by APB&B. The
interagency working group (IAWG) recalculated the WEBs, incorporating several
new categories and improving the accuracy of the Business Case calculations. A
Business Case review by Ministry appointed, Steer Davies Gleave (SDG) noted “the
methodology employed [by APB&B] is broadly fit for purpose.” A further review of
the WEBs by Professor Robert Cervero2, after seeing the SDG comments,
reinforced that “on balance … the APB&B analysis is thoughtful, well grounded,
1 With assistance from the Research, Investigations & Monitoring Unit
2
Robert Cervero is Professor of City & Regional Planning at UC Berkley as well as Director, University of California
Transportation Centre; and Director, institute of Urban & Regional Development. Robert Cervero works in the area of
sustainable transportation policy and planning, focusing on the nexus between urban transportation and land-use
systems
CITY RAIL LINK Summary Report Page 20 of 24objective, reasonably transparent, and appropriately measured in its interpretations,
assumptions, and forecasts3”. However, SDG noted a range of errors, omissions
and questions of interpretation needed to be addressed to provide a correct
representation of the likely wider benefits of the project4.
MoT identified and calculated three additional WEBs to include with agglomeration
benefits in the analysis - labour supply, job relocation and imperfect competition
effects. APB&B recalculated agglomeration effects taking into account SDG‟s
review, and IAWG concerns. Data and time limitations meant WEBs were largely
calculated as a proportion of conventional direct transport benefits, agreed to within
the IAWG5.
Table 3 illustrates the absolute WEB estimates to date as applied to the
conventional transport benefits.
Table 1: Wider Economic Benefit as calculated to date2
APB&B Review Auckland As a proportion of
Benefit Category Business ($m) Council figures conventional transport
Case ($m) ($m) benefits (%)
1,319 387 1,192 1,379 -
Transport
185 128 393 455 33*
Agglomeration
- 10 30 34 2.5*
Imperfect competition
- 19 57 66 4.8*
Labour supply
2
1 3,333 147 147 591 12-43
Productivity gains from job relocation
3
185-3,333 304 627 1,146 53-83
Total WEBs
Increase in the size of the regional
0-1,300
economy
4,5 627 – 2,446
Total including regional growth
1
These figures differ in their assumption on the number of employees who will be relocated into the CBD. APB&B assumed
22,000 employees would relocate into the CBD. The review settled on 5,000, while Auckland Council officers have used a
range between 5,000 and 20,000.
2
Termed „urban regeneration effects‟ in the business case.
3
APB&B conducted two pieces of analysis because they considered that there would be double counting otherwise.
4
By 2021, the size of the Auckland economy would be around $71Bn (GDP). If the project generated an increase of 0.36% in
the Auckland economy (an indicative figure calculated by NZIER in the AWHC study, indicating the effect of major
infrastructure investment), this would amount to $1.3Bn in net present value terms. This is not necessarily additive, as some
of these benefits will have been captured in other categories. However, leading economic agencies support that a
component of this effect is additional to the benefits already calculated (note: not all this effect would equate to a net
benefit).
5
This was not agreed to by central government agencies.
* Agreed on by the interagency working group review.
Note – all figures are Net Present Value applying 8% discount rate for 30 year period.
3
Cervero, R, 2011, „ Peer Review for Auckland CBD Rail Link Urban Regeneration Benefits‟
4
SDG, „Auckland CBD Rail Link: Peer review of wider economic benefits assessment‟, February 2011, para 22.
5
Sensitivity testing was completed on a range of employment figures for job relocation benefits, but no consensus was
reached as to the base scenario.
CITY RAIL LINK Summary Report Page 21 of 242. Wider economic benefit calculations and comparisons
WEBs are expected to generate an additional 53% to 83% of total conventional
transport benefits ($627-$1,146 million over a 30 year appraisal period at 8%
discount rate). All WEB categories fall within previously established ranges6 (of
conventional transport benefits) of other international urban rail projects.
The CRL comprise a high proportion of WEBs, reflecting a project that will enhance
Auckland CBD‟s economic potential in particular, and the Auckland and national
economies in general. This occurs by increasing the efficiency of New Zealand‟s
largest and most productive economy. High WEBs are explained by Auckland‟s
urban spatial economic structure - a concentration of sectors in the CBD that benefit
from co-location of firms, together with the anticipated centralisation of high-value
employment activity into the CBD. The latter effect is significant due to the
substantial productivity differential between the CBD and the rest of Auckland,
reflecting the CBD‟s role as a key driver of growth for Auckland and New Zealand.
3. Transformational benefits
The core concern of Auckland Council officers throughout the CRL Business Case
development has been to consider its potential to affect the size of the regional
economy, to affect land uses, and its effect on sustaining Auckland‟s population
growth. These are the core determinants of the demand for travel.
Auckland Council officers acknowledge the particular method used to incorporate
these „regeneration benefits‟ in the first cost-benefit appraisal (CBA) could be
improved on. However, it is firmly believed that the CRL will cause major changes to
determinants of travel, and that this must be a core element of a fit-for-purpose
economic appraisal. The IAWG has imposed conventional transport appraisal
methodology upon this project that requires to entirely rule out any such
transformational effects. Auckland Council officers want central and local
government to work together to appraise potentially transformational projects
differently. This section briefly explains the essence of this issue.
i) Regional economic growth
A strong interrelationship exists between transport provision and regional
economic activity. Large improvements in transport efficiency and firm
productivity will likely generate changes in the size, nature and rate of growth
in the economy overall. Improved economic growth can be expected in such
a case because transport infrastructure is pervasive, affecting all sectors of
the economy and society, resulting in a more efficient and competitive
regional and national economy.
However, conventional transport CBA treats economic activity as exogenous
(imposed from outside the system). Although current CBA methods can take
account of marginal effects to the economy7, it cannot take account of any
structural effects to the economy that change the quantity of transport
demanded for any given cost of travel8. This is potentially a major source of
benefit that has been ruled out of consideration in the Review‟s evaluation.
6
As analysed by SDG. Net job relocation benefits is the exception where only three projects have been assessed. As
such, no meaningful comparison can be made.
7
Via inducing the quantity of transport demanded because of downward sloping demand curves.
8
That is, the entire demand schedule for travel may further to the right in the long-term if the project had have been done
than if it had not. This increases the willingness to pay for travel for any given level of travel relative to the business as
usual (BAU) scenario.
CITY RAIL LINK Summary Report Page 22 of 24ii) Employment reallocation
Although it may have fallen short of proving the likelihood, the original
Business Case work effectively demonstrated the feasibility and credibility of
projects like the CRL to cause major changes in land use intensification and
job location. These are structural changes that take time to occur, and can
substantially affect travel demand. A project that induces such changes may
cause a greater willingness to pay for travel at all levels of travel than would
have occurred in the business as usual scenario.
iii) Changes to regional migration and even national population
As highlighted in modern literature, population moves across localities in
response to: (a) amenity benefits of a locality; and (b) productive
opportunities in a locality. A change to either of these may cause a
population and employment inflow. A regional population increase can affect
the demand for travel in the option scenario entirely differently to the BAU
scenario. Again, this potentially leads to a new set of „transformational
benefits‟.
In summary, there are projects that make major changes to the determinants of
travel, and as such, there is potentially an entire class of benefits that will occur in
actuality. Depending on the project, such benefits can be substantial. Appraisal
methods need to be improved to take account of such benefits. Auckland Council
officers believe the CRL is such a project, but that more work is required to
demonstrate the likelihood of this.
4. Valuing the future appropriately
The Business Case uses an appraisal period of 30 years and a base social discount
rate of 8% with sensitivity testing at 6% and 4%, consistent with NZTA EEM
methodology. The 8% real social discount rate follows the Treasury‟s default
guidance. Auckland Council officers do not support the basis for this high discount
rate, nor an arbitrary 30-year cap on the length of the project appraisal period.
The current 8% social discount rate is a pure „social opportunity cost‟ (SOC) rate
(the social return on private investment). While the SOC rate is an important
economic concept in isolation, using a pure SOC rate for the social discount rate is
not well grounded in modern economic theory. The social discount rate should
appropriately reflect society‟s preference for trading off costs and benefits sooner
against costs and benefits later. The current discount rate is too high to achieve this
purpose and creates a bias against projects that are in the country‟s long-term
interest. The social rate of time preference (approximately 3%-4%9) is the only
appropriate social discount rate, and the effects on private capital displaced and
augmented need to be explicitly considered10. For instance, using the UK
methodology would see net present value benefits increase by some 4.5 times,
while construction costs would only increase by around 75%.
The CRL benefits will extend well beyond the 30 year appraisal cut-off date. Even at
the high 8% rate, the present value benefits are substantially greater (by 25%-
100%) at longer appraisal periods, for a wide range of benefit growth scenarios.
9
The UK uses a non-uniform discount rate starting at 3.5% for the first 30 years and 3% for years 31-60, and an appraisal
period of 60 years for transport projects.
10
This latter feature is called the „shadow price of capital‟ and is the approach recommended in leading textbooks (eg
Boardman, A, Greenberg D, Vining A, Weimer D (2006) Cost Benefit Analysis; Concepts and Practice. Pearson Prentice
Hall, New Jersey).
CITY RAIL LINK Summary Report Page 23 of 24Best practice cost-benefit analysis11 is to extend the appraisal period over the useful
life of the project or to include a residual value that achieves the same purpose.
NZTA uses the 30-year cut-off to treat all projects equally, which is acceptable
within the context of NZTA‟s own budget routine funding allocations. However, the
CRL is not competing for the same funds from, say, a rural road realignment, and is
fundamentally different to routine road projects for many reasons. Auckland Council
officers insist that an appropriate appraisal period for the CRL itself must be used.
11
Boardman, A, Greenberg D, Vining A, Weimer D (2006) Cost Benefit Analysis; Concepts and Practice. Pearson
Prentice Hall, New Jersey. Chapter 6.
CITY RAIL LINK Summary Report Page 24 of 24You can also read