KIWIRAIL REGIONAL FREIGHT HUB SECTION 92 RESPONSE - PALMERSTON NORTH ...
←
→
Page content transcription
If your browser does not render page correctly, please read the page content below

KiwiRail Regional Freight Hub Section 92 Response

Economic Development Impact February 2021
Prepared by Richard Paling

    121) PLEASE PROVIDE A QUANTITATIVE ASSESSMENT OF THE POSITIVE AND NEGATIVE
    ECONOMIC IMPACTS OF THE PROJECT ON PALMERSTON NORTH CITY AND THE MANAWATU-
    WHANGANUI REGION, INCLUDING BUT NOT LIMITED TO:

          (i)       a detailed assessment of the positive and negative impacts on Bunnythorpe and the NEIZ;

Bunnythorpe
For Bunnythorpe the main effects would be:-
     •   The availability of a major employment centre. With an estimated 1,000 or more long term jobs in the
         new Regional Freight Hub (Refer to s92 response in Attachment 8b), this provides increased
         opportunities for employment for the residents of the area adjacent to the village.
     •   There will be some increases in travel costs to existing employment and other opportunities in the main
         Palmerston North urban area as a result of the changes to the roading network required to facilitate the
         Freight Hub. Reflecting this, in 2051 it is estimated that the costs of travel (taking into account the
         value of the time spent as well as the vehicle operating costs) in the AM peak for Bunnythorpe residents
         travelling to these destinations will increase by about 15 cents or 3 per cent compared to the position if
         the Freight Hub is not constructed. 1 These effects are illustrated in Figure 1. 2

         It is important to note that the material in Figure 1 shows the changes in percentage terms, meaning a
         shorter trip will have a higher percentage increase than a longer trip with the same travel time increase.
         For example, a shorter trip from Bunnythorpe to the NEIZ will show a bigger percentage change when
         compared to a trip from Bunnythorpe to say the Longburn area to the south. Therefore, the same
         increase in travel cost will not have as much of an effect on a longer trip as the increase is a smaller
         percentage change across the longer trip.

         The percentage changes reflect the increased traffic flows, and longer travel routes immediately to the
         south of Bunnythorpe. It should be noted that these percentage increases will tend to decline as the
         overall distances and times for destinations further away from Bunnythorpe increase as described
         above.

1
  This is based on an analysis of the position derived from the traffic model for 2051 comparing the travel time
and distance differences for the fully built out ‘with RFH’ and ‘without RFH’ scenarios. As discussed in the
transport s92 response Request 117 this contains the effect on the time taken for particular trip once the RFH is
in place. The analysis in Figure 1 also includes changes in the distances travelled forecast by the model
reflecting the closure of Railway Road and the provision of a perimeter route round the RFH. The travel time
and distance changes have then been evaluated using the parameters set out in the NZTA/Waka Kotahi
Monetised Benefits and Costs Manual to determine the impact on the total travel costs.
2 The results in Figure 1 are based on the changes in travel times for the AM peak, which are similar to those set

out for the PM peak period in Table 2.1 of the Regional Freight Hub Section 92 Traffic Response February 2021.
The use of the AM peak figures reflects the costs of accessing employment and other opportunities, rather than
the return trip home.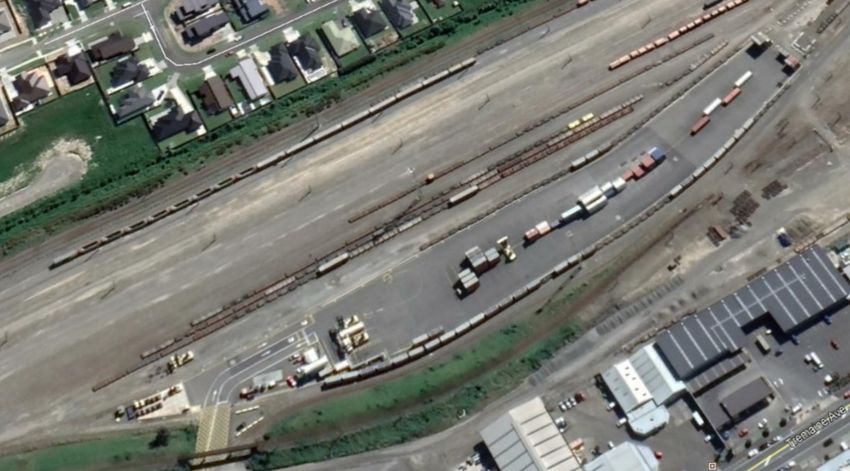
Bunnythorpe

                                                   Regional Freight Hub

                                          Figure 1
                Increases in travel time and distance related costs for light
                   vehicles from Bunnythorpe 2051 AM peak (per cent)
Source PNCC Traffic Model

    In general, there will be an increase in travel costs to all destinations to the south as a result of the
    closure of part of existing Railway Road, construction of the new perimeter road, and the increased
    volumes of traffic on the routes linking Bunnythorpe to the main urban area identified by the PNCC
    traffic modelling. For the most part these cost increases are relatively small of the order of 2.5 per cent
    or less, although as noted above larger percentage increases are forecast for many of the shorter trips
    in the vicinity of the village to the south. These larger percentage increases however would be for
    journeys which would potentially gain the benefits of the substantial increase in employment
    opportunities with the Rail Freight Hub just to the south of Bunnythorpe.
While there are increases in the costs of transport faced by the Bunnythorpe community, the positive effects of
the new employment opportunities are considered to be likely to be much larger than the relatively small
increase in transport costs.
NEIZ
For the NEIZ, the effects would include:
• Increased opportunities for interaction with the activities within the Regional Freight Hub given the large
size of the site in relation to the existing employment in the area. This would make the NEIZ a more
attractive location for activities either associated with distribution or providing other support services to
the activities located within the Regional Freight Hub. While hard to quantify, the possible
agglomeration and economic effects of this are discussed in further detail Attachment 8b to the S92
response.
• Accessibility to the other destinations within the Palmerston North area would on balance improve
slightly with a reduction of average heavy vehicle costs in the interpeak period of about 7 per cent,
again improving the attractiveness of the area to serve the city as a whole.
• The pattern of increases and decreases in accessibility (as measured in terms of travel costs) for the
NEIZ for heavy vehicles across the working day between the morning and evening peaks (when most
journeys are undertaken) are set out in Figure 2. These show savings for journeys connecting to the
main urban area to the south and west of the NEIZ, although with some increases in costs to the areas
to the east and north.
• As with Figure 1 above, it is important to note that Figure 2 shows the changes in relative percentage.
It should be noted that these percentage increases will decline as the overall distances and times for
destinations get further away from the NEIZ increase. As in the case of Bunnythorpe, a shorter trip
from NEIZ will show a bigger percentage change (as the increase in travel cost is a bigger proportion of
that trip), when compared to a longer trip with the same travel cost increase.
Regional Freight Hub
NEIZ
Figure 2
Forecast travel cost savings ($ per journey) for heavy vehicle movements from the
NEIZ to zones in the PN area 2051 Interpeak period
Source PNCC Traffic Model(ii) benefits for Regional Freight Hub users and/ or their custom ers associated w ith im proved rail freight handling facilities, including tim e and cost savings; The potential benefits to Regional Freight Hub users and their customers as well as the benefits from the RFH in terms of cost savings to a wider set of customers, and environmental and crash cost savings to the community generally are described in detail in Appendix A. While this analysis does not represent a full cost benefit appraisal of the proposal for a new Regional Freight Hub, it indicates that the capacity of the existing container handling facility would be reached by about 2030. There would therefore be quantifiable benefits to users from the provision of a higher capacity facility from that date, which would grow strongly over time increasing fivefold between 2032 and 2062 (see Appendix A Table 2). With the increased rail flow that this capacity would permit there would be a reduction in the volume of freight carried by road with accompanying environmental, crash reduction and congestion benefits, which again would grow over time. These environmental benefits would include the reduction of harmful emissions of nitrous oxides (NOx) carbon monoxide (CO), hydrocarbons and particulates (PM10) and also the reduction of greenhouse gases. In addition the new facility with its extended track layout is necessary to enable the operation of longer trains up to 1500m in length. Although the timing of the introduction of these longer trains has not yet been determined, track capacity constraints in the rail network in the later part of the century would support their introduction. It is estimated that the use of the longer trains would give rise to cost savings of approximately 10 per cent. This could be a factor supporting their introduction at a date earlier than would otherwise be required to address the capacity constraints. The benefits from these longer trains would accrue both in respect of Palmerston North traffic and also more generally for traffic on the key routes linking the upper North Island with the rest of New Zealand to the south. This would result in benefits to existing rail users and also make rail more attractive, diverting freight traffic from travelling by road with the consequent environmental, crash reduction and congestion benefits. Over a 60 year evaluation period for the project, these benefits, which do not take into account any measures by the government or other agencies to encourage the use of rail to help meet wider environmental and social objectives, are estimated to amount to about $1.3 bn in total or about $400m if discounted to the start of the project. Of these totals the benefits to Palmerston North customers would amount to about 20-25 per cent and the environmental and crash reduction benefits a similar proportion. The benefits to the Palmerston North customers would include lower cost transport connections for their movements to and from key markets. These benefits would therefore flow through into an enhanced logistics sector in the area.
(iii)    benefits associated with opportunities for local businesses to support the activities
of the regional freight hub;
The employment in the Regional Freight Hub of approximately 1000 or more additional workers
and any further expansion of logistics activities in the NEIZ would provide opportunities for other
firms to relocate to the area to serve the increased market. These could range from the provision
of specialist support services (especially for the logistics industry), to the provision of activities in
the area to service the needs of those working in the area (such as cafes, childcare, and other
personal services).
As an example of the effect that might be achieved, the breakdown of employment by industry in the existing
NEIZ/Palmerston North Airport census zone has been compared with that for the more developed Tremaine
Avenue area. This comparison is set out in Figure 3

                                60%
    Share of total employment

                                50%
                                                      NEIZ/Palmerston North
                                40%
                                                      Airport
                                30%                   Tremaine
                                20%

                                10%

                                0%

                                    Figure 3
   Breakdown of employment by industry type in the NEIZ and the Tremaine Avenue
                                   area 2020
Source : Statistics New Zealand Business Demography Database and consultants analysis.
This shows the relative importance of service type activities in the larger and more developed Tremaine
Avenue area. In total, these account for about 28 per cent of total employment in the area compared to just 4
per cent in the existing NEIZ/Palmerston North airport area, demonstrating the potential for the development
of these activities with the larger employment base on the combined Regional Freight Hub and expanded NEIZ.
(iv) benefits associated with the potential for the regional freight hub to attract new businesses to the
region
Following on from the response to (iii) above, the benefits arising from the potential for the Regional Freight Hub to attract
new businesses to the area include:
• The impacts of increased employment for those living in Palmerston North and the areas to the north in Manawatu
district, particularly in Bunnythorpe and Feilding.
• The benefits from a more integrated industrial structure with more support facilities located within or adjacent to the
area, potentially reducing the costs or increasing the attractiveness of business. These might include provision of
specialist industrial services such as equipment supply and repair and other activities providing services to the
workers in the Hub.
(v) impacts on employment, and related impacts on housing demand;
Refer to s92 response in Attachment 8b for the response to this question.
(vi) benefits for businesses located in the NEIZ associated with the efficient movement of goods between
the NEIZ and the Regional Freight Hub;
The businesses located in the NEIZ would benefit from the proximity of the Regional Freight Hub which would reduce the costs of
transport to their premises for traffic transferring to or from rail. At present the distance from the NEIZ to the existing rail freight
hub on Tremaine Avenue is about 5 kms, involving travel through busy urban roads particularly along Tremaine Avenue. For firms
located in the NEIZ especially to the north west of the zone, the travel distances would fall substantially as a result of the Regional
Freight Hub resulting in reductions in travel times and the overall costs of movement.
(vii) negative impacts of changes in the roading network and traffic flows on road network users, including
businesses located in the NEIZ;
This is covered in part above in response to question 121 (i) which identifies increases in transport costs for movements from the
NEIZ to areas to the east and north. These areas however would attract smaller flows compared to the movements between the
NEIZ/Regional Freight Hub and the city centre for which the travel costs are either similar or are reduced (See Figure 1)
The patterns of transport cost changes for all heavy vehicle trips in the 2051 interpeak period across the city and surrounds as a
whole are set out in Figure 4.Regional Freight Hub
Figure 4
Percentage changes in citywide average heavy vehicle costs with Regional Freight Hub
2051 Interpeak - trips to all areas
Source PNCC Traffic Model
This shows that in many cases there would be an increase in overall heavy vehicle transport costs, particularly in the city centre
and areas to the west. This would reflect the change of transport patterns with the relocation of the freight terminal and also
changes in travel times on the road network in the city as a result of these changed transport patterns.
The position for Kelvin Grove (another major logistics area) has also been considered. In taking the position for the period in 2051
between the morning and evening peaks, the overall changes in costs for heavy vehicles 2051 are relatively small reducing by an
average of $0.20 or less than 0.5 per cent. As Figure 5below indicates, while there are some increases in travel costs to areas to
the north including Bunnythorpe and Feilding, for much of the rest of the Palmerston North area the positive and negative effects
are small. On balance the accessibility for industries located in Kelvin Grove is broadly unchanged with the provision of the Regional
Freight Hub and the associated changes in the road network and the traffic patterns using this.Figure 5
Changes in transport costs for heavy vehicles travelling to Kelvin Grove (highlighted) in the 2051
Interpeak period ($ per trip)
Source PNCC Traffic Model
(viii) impacts associated with freeing up the existing rail yard land for alternative uses, and justification for
assessment of these impacts as "moderate/high positive";
The potential uses of the existing rail yard land are discussed in Appendix B. While there are no firm plans for the site an indicative
analysis has suggested that this could support up to 250-500 workers contributing up to $50m per year to the GDP of the city.
Given the scale of the potential improvement this is considered to provide a moderate/high positive impact
(ix) impacts of changes in land use resulting from the NoR, e.g. accelerated uptake of NEIZ land and rural
land, including opportunity costs; and
Refer to s92 response in Attachment 8b.
(x) other material positive and negative economic impacts of the project.
Refer to s92 response in Attachment 8b.122) Please provide clarity regarding areas where Technical Report K - Economics relies on the expertise
of others, for example, does the conclusion regarding the impacts of increased traffic flows on
Roberts Line being a "small negative" (section 4.4) rely on the findings of transportation experts?
The finding for the impacts on Roberts Line was based on the interviews with stakeholders in Palmerston North who identified the
difficulty of accessing sites from a busy main road, in that case Tremaine Avenue. The analysis of transport costs has been based
the Palmerston North City Council transport model with outputs provided by Stantec, and rail environmental costs have been
estimated from work developed by Emission Impossible for the Ministry of Transport.
123) Please provide additional detail regarding the potential mitigation measures referenced in relation to
access issues on Roberts Line (section 4.4).
Refer to the response to Request 116.Appendix A
Benefits to rail users and the wider community in New
Zealand from the proposed new rail freight hub
1 Introduction
The purpose of this analysis is intended to identify a range of the quantified benefits which are
expected to arise with and support making provision for an enhanced container terminal site,
and longer trains, at the new Regional Freight Hub. It is not in itself intended as a full cost-
benefit analysis of the development. In considering these estimates it is important to recognise
that a number of the potential impacts of the new Freight Hub and in particular the use of longer
trains have not been investigated in detail and the results should therefore be regarded as
indicative only
1.1 Scope of the analysis
The benefits from the proposed Regional Freight Hub include two main elements:
• Benefits from the increased capacity for handling container traffic at the hub especially
for movements of goods from the north.
• Benefits from the use of longer trains which would potentially affect almost all traffic
through the yard to and from the north.
This work is based on an analysis of the operation of the rail system serving Palmerston North
and to a lesser extent the conditions more widely on the network. This is attached at Appendix
B.
2 Benefits from increased capacity at the container yard
The estimates of the future demand for containerised traffic through a rail freight hub in Palmerston
North are based on:
• The current growth forecasts derived from the Ministry of Transport Freight Futures model for
rail traffic for manufactured and retail goods into the Manawatu-Whanganui region,
• Recent (2017) and current (2020) flows of traffic handled at the container facility in the
existing rail freight hub and forecasts of future demand based on the Ministry of Transport
growth factors for the Manawatu-Whanganui region described above
These estimates and forecasts are set out in Table 1.
Table 1
Total estimates and forecasts of demand for manufactured freight traffic by rail
into Palmerston North
(m tonnes pa)
2017 2020
(Est) Est 2022 2030 2032 2042 2052 2062
Total demand for containerised
0.28 0.26 0.28 0.30 0.31 0.33 0.34 0.35
traffic (m tonnes pa)
These show a steady growth over the period from 2020 to 2062
The review of the operations of the current container handling facility at Tremaine Avenue has
indicated that the capacity of this may be reached by about 2030 and the effects of this are illustrated
in Figure 4.0.40
0.35
0.30
M tonnes pa
0.25 Total demand
Capacity
0.20
0.15
0.10
2010 2015 2020 2025 2030 2035 2040 2045 2050 2055 2060 2065
Figure 4
Demand and capacity through the PN freight terminal (m tonnes pa)
As a result, growth in the potential demand beyond 2030 would need to be moved by road at a charge
for transport that is greater than that for rail imposing increased costs on the Palmerston North
community.
Comparing the typical costs of moving goods by road or rail 3, the transport cost savings by the use of
rail are estimated to amount to about $0.06 per tonne-km. Applying this figure to the traffic that would
be forced to divert to road if the existing Freight Yard were to remain in operation would give the
figures set out in Table 2. In addition there would be increased environmental 4 congestion and crash
benefits as traffic shifts to rail from road and these are also included below.
Table 2
Transport and environmental cost savings from increased rail container handling
capacity in Palmerston North ($m pa)
Transport cost Environmental Crash cost Congestion
Total savings
Year savings cost savings reduction benefits
2032 0.3 0.1 0.0 0.1 0.5
2042 0.9 0.2 0.1 0.2 1.4
2052 1.3 0.3 0.2 0.3 2.1
2062 1.7 0.4 0.3 0.4 2.8
In addition to these quantified benefits, the new facility is likely to provide for a more efficient and
reliable movement of containers because of the improved facilities within the new Freight Hub with
consequent further benefits to users. These benefits while real are difficult to quantify in monetary
terms, but would increase the attractiveness of the hub for existing and potential new users
3
The financial costs of moving goods by road have been derived from the Waka Kotahi "Monetarised Benefits
and Costs Manual" released in July 2020, together with information on typical vehicle payloads derived from
analysis of data from the Weigh in Motion (WIM) sites operated by Waka Kotahi. The costs of moving goods by
rail have been estimated by comparing total rail freight revenues and the volumes of freight moved as set out in
the KiwiRail Annual report
4
The environmental costs cover harmful emissions of nitrous oxides (NOx) carbon monoxide (CO), hydrocarbons
and particulates (PM10) and also the production of greenhouse gases3 Potential benefits from the use of longer more efficient trains
3.1 Introduction
As well as providing additional capacity for container handling, the proposed Regional Freight Hub
would also allow the operation of longer more efficient trains. The introduction of these has only been
considered at a conceptual level and for capacity reasons they may not be required until the latter half
of the century, unless the demand for rail travel increases faster than expected. This could occur, for
example, by the encouragement of a shift from road travel to meet broader environmental and social
objectives. However it is estimated that these could reduce operating costs by up to 10 per cent
which may encourage their early adoption.
On the assumption that these cost savings are passed on to customers by KiwiRail, this would give
rise to considerable benefits to existing rail users in Palmerston North. By reducing costs this is also
likely to result in a further transfer to rail as transporters take advantage of the reduced charges.
There would also be benefits to longer distance traffic passing through Palmerston North. However
because of the constraints facing the use of longer trains on other routes away from the NIMT
between Auckland and Palmerston North, especially for routes to Hawkes Bay and Taranaki, the
benefits per tonne / km are likely to be smaller and we have assumed that these would be half those
for traffic between Palmerston North and areas further north
3.2 Benefits to Palmerston North traffic
The benefits to the forecast levels of traffic to Palmerston North are set out in Table 3.
Table 3
Benefits from longer trains serving Palmerston North
Total reductions in travel costs for
Year Total traffic (m tonnes pa)
base level traffic ($m)
2032 0.44 2.3
2042 0.46 2.4
2052 0.49 2.6
2062 0.51 2.7
The reduction in transport costs is also likely to result in some shift from road to rail. Using the
information set out in table of the Waka Kotahi Monetary Benefits and Costs Manual (MBCM) it has
been assumed that a reduction in transport costs of 10 per cent will lead to an increase in traffic of 20
per cent.
The benefits from this would flow in part to those switching their traffic from road to rail reflecting the
lower prices, and in part to the community in general as rail with its lower environmental, safety and
congestion costs is substituted for the more costly road option. The environmental costs estimated
for rail assume the use of electric locomotives between Te Rapa and Bunnythorpe with diesel used
for the remainder of the journey. This gives an average cost of $0.003 per tonne-km for rail compared
to $0.018 per tonne-km for road. Crash cost reductions are based on the observed rate for heavy
vehicle crashes and congestion costs are based on Waka Kotahi estimates of the effects of removing
road traffic (See MBCM Table 42 with further adjustments to reflect the share and impact of heavy
vehicle traffic on congested road sections.
The benefits that result from this switch of traffic are set out in Table 4.Table 4
Benefits from traffic switching to rail because of reduced costs
Transport Environ-
Base Generated Crash cost Congestion
cost mental Total
Year traffic traffic (m reduction benefits
benefits benefits ($m)
(m tkms) tonne-kms) ($m) ($m)
($m) ($m )
2032 218 44 0.2 0.6 0.4 0.6 1.8
2042 232 46 0.2 0.6 0.4 0.7 2.0
2052 243 49 0.3 0.7 0.4 0.7 2.1
2062 254 51 0.3 0.7 0.5 0.7 2.1
3.3 Benefits to other longer distance traffic
The traffic passing through Palmerston North (rather than starting or terminating there), which could
potentially be affected by the use of longer trains is set out in Table 5. This focuses on the movement
of manufactured and retail goods which represents most of the longer distance flows and which
because of the typical means of transport is most likely to benefit from the introduction of longer
trains.
Table 5
Longer distance rail movements through Palmerston North north and
southbound (1)
Tonnes (m) Tonne-kms (m)
2032 1.217 1,151
2042 1.324 1251
2052 1.413 1336
2062 1.508 1426
Note (1) All traffic between the upper North Island, Northland, Auckland, Waikato and Bay of Plenty
and areas to the south excluding Manawatu-Whanganui
For this traffic it has been assumed that the cost reduction of 10 per cent with longer trains would only
apply to parts of the journeys and a reduction of half this, 5 per cent has been taken to be appropriate.
The benefits to the forecast rail traffic flows are set out in Table 6
Table 6
Benefits to base longer distance traffic flows with reduced costs
Base traffic flows (m tonne- Total reductions in travel costs for base level
kms) traffic) ($m)
2032 1151 6.1
2042 1251 6.6
2052 1336 7.1
2062 1426 7.6
As in the case of the Palmerston North traffic it has been assumed that the reduction in transport
costs will lead to an increase in traffic with a switch from road with resulting environmental benefits.
The total benefits that would result from the generated longer distance traffic are set out in Table 7.Table 7
Impacts of reduced costs on longer distance traffic - generated traffic
Environ-
Crash cost Congestion
Increase in Transport mental
reduction benefits
traffic (m cost benefits benefits Total
($m) ($m)
tonne-kms) ($m) ($m) ($m)
2032 115.1 0.3 1.6 1.1 1.6 4.6
2042 125.1 0.3 1.7 1.2 1.8 4.9
2052 133.6 0.4 1.8 1.2 1.9 5.3
2062 142.6 0.4 1.9 1.3 2.0 5.6
4 Total benefits
The total benefits that could potentially result from the construction of the Regional Freight Hub are
set out in Table 8
Table 8
Quantified benefits with the new Regional Freight Hub ($m pa)
Benefit type 2032 2042 2052 2062
Benefits to PN users
Increased container handling capacity 0.3 0.9 1.3 1.7
Reduced train costs
Existing traffic 2.3 2.4 2.6 2.7
Generated traffic 0.2 0.2 0.3 0.3
Total benefits to PN users 2.8 3.5 4.1 4.7
Benefits to longer distance traffic
Reduced train costs
Existing traffic 6.1 6.6 7.0 7.5
Generated traffic 0.3 0.3 0.4 0.4
Total benefits to longer distance users 6.3 6.8 7.3 7.8
Environmental benefits
Increased container handling capacity 0.1 0.2 0.3 0.4
Longer trains - PN traffic 0.6 0.6 0.7 0.7
Longer trains - other traffic 1.6 1.7 1.8 1.9
Total environmental benefits 2.2 2.5 2.7 3.0
Crash reduction benefits
Increased container handling capacity 0.0 0.1 0.2 0.3
Longer trains - PN traffic 0.4 0.4 0.4 0.5
Longer trains - other traffic 1.1 1.2 1.2 1.3
Total crash reduction benefits 1.5 1.7 1.9 2.0
Congestion benefits
Increased container handling capacity 0.1 0.2 0.3 0.4
Longer trains - PN traffic 0.6 0.7 0.7 0.7
Longer trains - other traffic 1.6 1.8 1.9 2.0
Total congestion benefits 2.3 2.6 2.9 3.2
Total benefits 15.1 17.2 18.9 20.6The benefits to Palmerston North users from improved container terminal capacity and the introduction of longer trains would contribute to overall reduced costs in the transport and distribution sector. This would help to reaffirm the role of the city as the major distribution centre in Central New Zealand. These would be supplemented by more widespread benefits to users across the country and wider environmental benefits, for example, from the reduction of the emission of greenhouse gases, and reductions in crash and congestion costs. These quantified benefits assume that that there is no action by the Government or other agencies to encourage the use of rail rather than road to support wider environmental and social objectives. To the extent that such action is taken, the benefits of the new Regional Freight Hub, both to the Palmerston North community and to New Zealand as a whole would be greater. As a final step an assessment has been made of the total benefits that might be generated over the lifetime of the Regional Freight Hub assumed to be 60 years. Without discounting these, the benefits would amount to in excess of $1 bn. If discounted at a rate of 4 per cent (which is the standard value for transport projects) over the life of the project the benefits would have a present value of about $400m. As indicated above, these figures exclude the effects of any measures to divert from traffic from road to rail which would increase these benefits further.
Appendix B
Palmerston North: longer trains and a better Container Terminal
site

Introduction
On the basis of the most recent data, Palmerston North handled nearly 12,000 trains in 2019-20.
Nearly 11,100 were freight trains and shunts (local feeder trains). The remainder were passenger and
work 5 trains.
Table 1: Trains at PN 2019-20
    Train type                                        Number of trains
    Freight and shunts                                11092
    Passenger                                           659
    Work trains                                         202
    Total                                             11953

As Palmerston North is at a major junction, it serves trains to and from north, south, west, and east:
Auckland, Hamilton, and Tauranga; Karioi (pulp mill); Longburn, Wellington and the South Island;
Whanganui, Hawera, and New Plymouth; Napier Hastings and Pahiatua. About 22% of trains pass
through Palmerston North, mainly Auckland-Wellington trains, but including some from Longburn to
Taranaki, and Whanganui to Wellington. These trains can also pick up or drop off traffic in Palmerston
North. The reminder either originated or terminated at Palmerston North. Even if they did that, much
of the freight they carried is likely to have been moved further on different trains.
Table 2 shows the relative importance of these routes in term of train (and shunt) numbers. This
counts through trains as separate trains north and south of Palmerston North.
Table 2 Distribution of PN freight trains and shunts
    Route                            Percentage (in both
                                     directions)
    NIMT North (incl Karioi)                          32.7
    Whanganui/Taranaki                                19.6
    Hawkes Bay and Pahiatua                           16.0
    NIMT South (incl Longburn)                        31.7
    Total                                            100.0

As demonstrated in Table 3, most freight at Palmerston North is through freight.
Table 3 Traffic at Palmerston North (tonnes) 2019-2020
                                                Million tonnes                           %
    Through                                          1.598                             73.3
    Into PN (containers)                             0.209                              9.6
    Into PN (wagons)                                 0.099                              4.5
    From PN (containers)                             0.050                              2.3
    From PN (wagons)                                 0.224                             10.3
    Total                                            2.180                            100.0

The 2019-2020 figures were affected by Covid-19, especially in the last quarter.

5
  A work train is a train that is used to assist repair or maintenance work on the line, ie an internal,
non-commercial movement, usually at off peak times and not part of the load that determines the
size of the yard.
Nearly three quarters of the total traffic that involves Palmerston North is through traffic, such as Auckland to the South Island. About 14% is inwards traffic for Palmerston North, most in containers, and 13% outwards traffic from Palmerston North, mostly logs in wagons. The volume of through freight has implications for the 1500m train proposal, and the container traffic is largely focussed on the Container Terminal (“CT”) site. Container Terminal site There are basically two ways of interfacing between trains and customers at Palmerston north, private sidings and the container terminal. Major users such as Mainfreight and Toll have their own siding and unload wagons for their customers on their site. Even so, containers for them are handled at the CT site. Logs are similar to the major users, with a dedicated loading area. For all other customers the only way to receive freight that has been hauled by rail to Palmerston North (and vice versa) is through the CT site. It is the only “common user” terminal between Wellington and Whanganui or Napier. Therefore, all people who want to use rail, for casual or consistent traffic, need to use either a major forwarder, or use the CT site. The staff at the existing CT site at Tremaine Avenue report that this traffic has been increasing in recent years. The CT site at Tremaine Avenue is a long narrow wedge of land in a corner of the existing rail facility. It is about 400m long and 50m wide at its widest. Its area is 1.5 hectares. In the centre of the site is a paved grid for short term placement of containers, and outside that on either side is an area for manoeuvring the large top-lift hoists that are used to move the containers. Outside that again are two tracks, one on each side, where the rail wagons are placed for loading and unloading. The track on the west of the site can hold 21 wagons, about 355m, and that on the east 15 wagons, 255m, a total of 610m. As a result, the site cannot take a maximum length train from the north (900m). These trains need to have other freight on them (or be put through the terminal in two parts, with consequent delays. The site includes a number of points for refrigerated containers to plug in, and also a space for on-wagon generators. Figure 1 : Palmerston North CT site Source: Google Earth Partly because it is small, and partly because of the timing of trains at Palmerston North, the site does not function as a “through” terminal with main line trains arriving, handled, and departing at the terminal. Rather the rakes of wagons are transferred to and from the main yard by shunt locomotive, which can add delay. Container traffic handled at Palmerston North includes beverages, food, frozen produce, fruit, potatoes, flour, household removals, manufactured goods, packaging, dairy products, and meat. This is a typical cross section of the freight that makes a city work. The CT site has another function, of exchanging containers between trains on one route with those on another. Instead of sorting wagons by shunting, the containers themselves are moved. Traffic between Hawkes Bay and Auckland, for example, can be transferred from the Hawkes Bay train to the train on the NIMT. About 25% of the container lifts at the CT site are between trains,
The demand on the CT site is measured in “lifts”. A single container is typically placed from the train
to the container grid, and then taken from that to load on to a truck for distribution in Palmerston
North. This container counts as 2 lifts. The process is repeated for containers coming into the site by
truck. Some containers may have more than two lifts per direction, as they are positioned for cleaning
or other activities.
Table 4: Throughput of the CT site at Palmerston North
 Calendar Year                   Lifts
 2011                             69726
 2012                             76936
 2013                             80438
 2014                             78018
 2015                             94476
 2016                            101473
 2017                            102075
 2018                             99568
 2019                             94617
 2020                             95008

The average growth rate over this time period was 3.5% pa, and the throughput has grown since
2011 by 36%. The flatter growth in recent years is attributed to disruptions caused by paving work,
and Covid-19 in 2020. The data is likely to underrepresent the containers stored at the terminal in
early years. However, this function has ceased, so the data is a reasonable representation of the
current activities for all years.
The site at Tremaine Avenue has adequate capacity at present. It has been lengthened about 6 years
ago. However, the site has no further available land to expand. To be useful, an extension is required
to make the yard longer rather than wider. There is no further length available at the current site.
There is spare width available in the yard but that is not useful in capacity terms – the CT site is not a
storage site but a container exchange site direct truck/train or train/train with only short on-ground
time. However, greater width would make the terminal more efficient, in terms of less restrictive
manoeuvring room for fork hoists. It would also enable trucks to be loaded where the container is,
rather than have the fork hoists travel with the container to the south end of the site, as at present.
Local management consider that the site could accommodate 10% growth over current 2020 flows
(peak) but not 20%. 15% is taken for the purposes of this report. The Ministry of Transport has a
demand model which can be analysed in a number of different ways. For the purposes of the CT, a
useful proxy in the model is manufactured and retail products, to or from the Manawatu/Whanganui
region, excluding the traffic with both origin and destination within the region. On this basis, as
measured by the model, growth from 2017-18 to 2052-53 is 29%. From 2019-2020 to 2052-53 the
rate is 24%. In fact, on the model’s predictions, the growth will be in excess of 15% at or shortly after
the new Regional Freight Hub is built.
If KiwiRail’s ambition of having a 20% share of overall net tonne km by 2030 is realised, the CT site
would be at capacity even earlier. Most of the growth to achieve the goal has to come from the
manufacturing and consumer goods sector, as bulk products and major primary exports are flat, and
in the medium term forestry is likely to trend down. That means that the demands on the CT site will
be even greater.
Even now truck queues form at certain times waiting for containers (which may still be on a train in the
yard). Delivery times from yard to CT can be several hours, but the longest time is typically in the
early morning so does not have a lot of impact on the customer. The CT site works 24/6 and a shift on
Sunday which does not service trucks (ie confined to train–train, train-grid, or gridtrain).
The primary benefit of a Regional Freight Hub will be increased length and increased capacity.
Throughput speed might be enhanced by use of portal cranes (though forklift operation is very fast
already). A longer site would also allow longer working length and longer trains (or longer CT
portions) so customers could get access to their containers faster. Also with the current practice for
assembling trains, CT wagons may be located at a number of points in the train (as a result of
different sources in Auckland, ie not all the traffic comes from the CT site there - some comes from
freight forwarders’ sidings and the trains are not further sorted). With a longer terminal, the practices
could change. For example, a whole train could be berthed and the CT portions picked out quickly
before the train departs.
By the time throughput increases to 1.15 times the current levels, customers will experience delays
without the new Regional Freight Hub, or may even be unable to be accommodated at the existing
Site. Taking the manufacturing and retail goods movements in the model as a proxy for the demand
on the CT site, by the time the new Regional Freight Hub is opened, the old one would be at or nearly
at capacity. That is, by the early 2030s growth would be at 15% over current levels. By 2052-53
demand would be about 24% above current levels. If the demand, above the capacity of the existing
Freight Yard was all the growth beyond 15%, this means about 45,000 tonnes and 21 million net
tonne km (excluding container tare) pa would have to be hauled by road, and this will continue to
grow in the following years. The growth rate for the years 2042-43 to 2053-52 is 0.4% pa in the
model. Using this rate, by the 2080s, there could be a further 45,000t and 23m ntkm not able to be
handled at the CT site.
The model keeps rail’s market share on the Auckland-Palmerston North route, for manufactured
goods constant for all years at 12.3%. If that increased to KiwiRail’s ambition of 20%, then the growth
would be 60% higher.
We have has estimated the cost of road haulage to the customer is at 16.5c/ ntkm, and the cost of rail
10.5 c/ntkm, making rail 6 cents cheaper 6. In 2052-53 the 21 million ntkm unable to be serviced by
road would cost the shippers, and ultimately the Palmerston North customers, $1.3m pa, even without
the market share increase. By the 2080s this would have risen to $2.7m pa. The values would rise
further in direct proportion to any market share increase.
1500m trains
The current maximum train length on NIMT trains north of Palmerston North is 900m. 1500m trains
would be an increase of two thirds, ie 1.67 times. 7 In principle, for a given tonnage there could be
40% fewer trains running if the larger trains can be run. Alternatively this would free up line capacity
for 67% higher tonnage.
Not all trains are likely to be able to use the 1500m length. It is impracticable to fill each train to the
maximum every day of the year, as demand fluctuates. Nevertheless in 2019-2020, the maximum
train length at Palmerston North was 895 m, and 13 trains in each direction were over 800m long.
Lines west and east of Palmerston North are steeply graded. Traffic on those lines is largely
import/export commodities and bulk, and these traffics have a higher density (t/m) than domestic
trains. Longer trains might be too heavy for realistic locomotive power, and downhill braking
limitations on the steep sections may limit length for a longer time than on the NIMT. As well, a
number of crossing loops are short and the volume of traffic may not warrant extending them.
South of Palmerston North there is less demand (lower tonnage) than north, as Palmerston North is a
distribution hub for traffic ex Auckland. The new ferries will have rail capacity slightly over 800m, ie
less than the current 900m maximum, so the usefulness of longer trains would be limited south of
Palmerston North, although it may be theoretically possible to run them to Wellington.
The primary demand for longer trains will be the “domestic” traffic southbound into (and through)
Palmerston North (including the traffic that ultimately moves west, east, and south). There are four
prime trains on this route at present, all southbound (the traffic is largely southbound) of a total of 12
through the Palmerston North-Hamilton section on a typical weekday. Most of these travel at night
and lead to a busy network in the central north island.

6
  This is discussed above in Appendix A
7
  While there is one track at the existing yard is already over 1500m long, it does not allow the use of trains that are 1500m in
length.
At present longer trains would be limited by the braking restrictions down long grades on the North
Island Main Trunk line, but there are technologies available that can overcome this, even now, and
very likely to be adopted during the life of the new hub (where it is economic to do so, and the
southbound traffic to PN is likely to give sufficient benefits).
Assuming that the current trains could be built up to 1500m, then the current capacity of 4 trains
(3600m) could be carried in 3 trains (4500m) with additional capacity for increased ferry traffic or other
growth.
Using the southbound total ntkm demand (all commodities) into Palmerston North, the traffic will grow
32% by 2052-53, according to the model.
While the cost to KiwiRail of running longer trains should be less than for shorter ones, there will be
offsetting costs such as crossing loop lengthening, and other operational issues to be ironed out. It is
assumed that the operating cost savings would be in the order of 10%. This is likely to be passed on
to customers, a direct benefit to Palmerston North of the longer trains. As shown above, such a
change will result in yet more traffic on to rail, as much as 20%. Base growth of 32% plus another
20% is nearly 60%, a truly dramatic increase.
Some of this traffic, if the train length stays at 900m, could be accommodated by more short trains.
The average length of the prime trains in the peak September-December quarter of 2019-20 was
520m, with a maximum of 832m.
Table 5: Prime trains: September to December 2019
 Train Number          Departs               Arrives PN        Average length        Maximum length
                       Auckland                                (m)                   (m)
 229                   12:35                 00:04             592                   803
 221                   18:20                 04:48             392                   791
 215                   20:15                 06:29             560                   832
 217                   21:45                 08:07             548                   679
 4 Trains                                                      520

At 2053/53, with 32% growth there will need to be another train, assuming the current utilisation
remains. Every 10 years after that the demand will grow about 5%, so by the 2080s, the total growth
over 2019-20 would be 53%, and two extra trains would be needed. It is possible to fit in an extra train
at the times the market wants, in theory, but trains do not always run to time, and an extra one could
congest the central NIMT line and make the trains less reliable. An extra two at the key times is very
likely to do so. Beyond the 2080's the likelihood of further extra trains will grow as traffic grows.
If KiwiRail’s market share improves from about 12% to 20%, then the longer trains will be required
earlier.
It is likely that by the 2080's longer trains are likely to be needed to carry all the traffic. The longer
trains will make space on the network for growth (some of it engendered by the cost savings of longer
trains). More customers will be able to take advantage of rail, and as well generate environmental
benefits.
In the 2060s, southbound peak-time traffic will have reached nearly 1300 m ntkm (compared with the
model’s 2019-20 estimate of 900. If growth beyond that is impeded by short trains, then about 130
million ntkm could be lost to road, at a cost to customers across the country of about $8m per year.
Appendix C
Potential use of the vacated existing rail freight hub land
The scale of the site to be vacated.
As outlined in the drawing below, the area vacated with the shift of the rail facility to Bunnythorpe is
estimated to be about 20 ha, excluding the land currently occupied by Toll, Mainfreight and Halls.
Figure 1
Dimensions of the existing rail facility
Of the site available, the developable area is approximately 50 per cent of the total 8, although may be
higher for the existing Freight Yard because of the good connections just beyond the site boundary
which might reduce the need for roads within the site. Applying a 50 per cent factor would give a total
developable area of about 10 ha.
Types of activities likely to be attracted
It is likely that given the proximity to the central business district as well as the many of the industrial
activities located along Tremaine Avenue, the site would be suitable for a range of light industry and
commercial activities either supporting local activities and workers in the CBD and its immediate
surrounds or activities serving a wider regional catchment. This would probably be similar in nature to
the development immediately to the south of the existing hub in the area bordering Tremaine Avenue
to the north. While in principle the site would be attractive for residential development, the probable
levels of contamination on the site which has been used for railway activities for a number of years
and the fact that the site is bordered to the north by a busy rail line and to the south by the
commercial activities on Tremaine Avenue would probably limit the attractiveness of the site for
housing and other sensitive land-uses.
8
" Warkworth Draft Structure Plan - Review of dwelling and employment yields" Market Economics
2019Typical potential employment densities
Work undertaken by Market Economics as part of the Warkworth Draft Structure Plan also suggests
an employment density of about 37 jobs per hectare of developable land for light industry 9. BERL in
their work for UNISA 10 suggest a range of 27-50 which is broadly consistent. This would give total
employment in the area of about 250 - 500 workers, which is more than currently employed in the
area.
Relationship to general employment growth in the city
Employment in Palmerston North City has historically been growing by about 1000 jobs pa 11 so the
proposed growth from the vacated rail site would fit fairly well within this growth. At present
employment in Palmerston North City is about 52,000 12 so the employment identified for the site
would represent an increase of between about 0.5 and 1 per cent.
Typical GDP per worker and the total GDP of the site
Based on the Statistics NZ estimates for regional GDP and the regional workforce, the GDP per
worker in the Manawatu-Whanganui region in 2018 amounted to about $90,000. Applying this figure
would give a total GDP for the workforce on the vacated rail hub of about $25-45m. This can be
compared with an estimate of about $4.5 - 5bn for the city as a whole and would represent an
increase of about 0.5-1 per cent of the city total, in line with the increase in employment.
New employment and relocation
It is not certain as to the extent to which the employment would represent activities relocated from:
• elsewhere in the City,
• from the rest of the Manawatu-Whanganui region or
• from elsewhere in New Zealand
Alternatively the employment growth may reflect completely new activity taking advantage of the
opportunities of the site with its close proximity to the urban core of Palmerston North. However
even if the activities were relocated from elsewhere the fact that they are relocating to the new site
would imply that there are benefits in doing so and so contribute to the overall impact of the
redevelopment.
9
Ibid.
10
"Upper North Island Industrial Land Demand" BERL Economics 2015
11
Business Demography Database, Statistics NZ.
12
IbidYou can also read