SENIOR HOUSING MARKET INSIGHT - Q2 2021

Page created by Ralph Nichols
 
CONTINUE READING
SENIOR HOUSING MARKET INSIGHT - Q2 2021
S E N I OR HO USING
                      Q2 2021
M A R KE T IN SIGHT
SENIOR HOUSING MARKET INSIGHT - Q2 2021
CBRE SENIOR HOUSING
SENIOR HOUSING INVESTMENT SALES &
INVESTMENT BANKING                                                       IN THIS REPO RT

LISA WIDMIER
Executive Vice President
                              ASHAY SHAH
                              Transaction/
                                                                  03               04                06
Senior Housing                Underwriting Manager
                                                                Introduction    Demographic        Population
Investment Sales & Banking    Senior Housing                                      Demand            Growth
Member FINRA/SIPC             ashay.shah@cbre.com
CA Lic. 01258647              T +1 619 417 7295
lisa.widmier@cbre.com
T +1 858 729 9890
M +1 858 952 4743

                                                                  07               08                09
                                                               Senior Housing     Investment      Capitalization
                                                                   Supply           Returns          Rates
ALLISON FORD                  ALLIE SURGES
Financial Analyst             Client Services Coordinator
Senior Housing                Senior Housing
alli.ford@cbre.com            allie.surges@cbre.com
T +1 858 546 2632             T +1 858 546 2679

SENIOR HOUSING LAND PRACTICE
                                                                  12               13                14
                                                                 Pricing Per     Transaction       Transaction
                                                                  Unit/Bed         Activity      Activity by Buyer
                                                                                                        Type

MATT MARSCHALL               ADAM PETERSON
Senior Vice President
Lic. 01035488
matt.marschall@cbre.com
T +1 858 404 7202
                             First Vice President
                             Lic. 01815802
                             adam.peterson@cbre.com
                             T +1 310 550 2592
                                                                  15               16                17
                                                               Senior Housing    Occupancy         Occupancy
SENIOR HOUSING DEBT & STRUCTURED FINANCE
                                                                Construction     Rates & Rent       Stack Up
                                                                   Activity        Growth

SCOTT W PETERSON
Executive Vice President
Lic. 01383970
                             BILL CHILES
                             Executive Vice President
                             Lic. 01092364
                                                                  18               19                21
scott.peterson@cbre.com      bill.chiles@cbre.com                   REIT           Markets         Top Senior
T +1 858 546 4607            T +1 858 646 4735                  Performance      with Highest       Housing
                                                                                  & Lowest         Owners &
SENIOR HOUSING               SENIOR HOUSING                                      Occupancies       Operators
VALUATION                    PROPERTY TAX
ADVISORY SERVICES            CONSULTING

                                                                  22               24                25
                                                                About CBRE      CBRE Valuation        CBRE
                                                               Senior Housing      Services        Property Tax
JAMES GRABER                 MIKE WING                                                              Consulting
Managing Director, Senior    Director, Property Tax Services
Housing & Healthcare         TDLR Lic. 3680                                                          Service
Lic. 1380726                 michael.wing@cbre.com
james.graber@cbre.com        T +1 214 425 3747
T +1 212 715 5725
SENIOR HOUSING MARKET INSIGHT - Q2 2021
3         Introduction

 Dear Colleagues,

 Welcome to CBRE Senior Housing’s Senior Housing & Care
 Market Insight (SHMI) Q2 2021 industry report. Our Team
 has diligently collected data from various industry and
 economic sources relating to industry performance statistics,
 supply and demand, buyer and seller activity and transaction
 statistics.

 2020 was a challenging year across all sectors and around
 the world due to the COVID-19 pandemic including the
 senior housing sector. Now that approximately 90% of all
 congregate care senior housing residents and the majority
 of staff are vaccinated, the senior housing sector is starting
 to see green shoots of resilience spring up. The sector seems
 to have reached the cyclical pandemic occupancy bottom.
 In fact, for many providers, March and April 2021 move-ins
 exceeded pre-pandemic monthly move-in levels.

 The outlook for the senior housing sector is robust:

      • Increasing demand for senior housing as the 85+
        population is forecasted to grow 177% to 18.5 million
        by 2050
      • Increasing demand for need-based care
      • Increasing generational undersupply as there are just
        over 2 million institutional units/beds in the top 140
        Metro Areas, with skilled nursing beds accounting for
        46% of this supply.

 Growing demographic demand and constrained new
 supply creates a catalyst for robust sector performance
 and significant value-creation opportunity for investors.
 As the world and the sector move beyond this COVID-19
 storm towards blue skies, increasing operating margins
 accompanied by downward pressure on capitalization rates
 may soon indicate it will be time to harvest profits from core
 assets again.

 On Behalf of CBRE Senior Housing,

 Lisa Widmier
 lisa.widmier@cbre.com
 www.cbre.com/nationalseniorhousing.

3 |   CBRE Q2 2021 SHMI
SENIOR HOUSING MARKET INSIGHT - Q2 2021
4               Senior Housing Demand is Driven by
                               Demographic Demand

                        The baby boomers (post-World War II babies) began                      years to approximately 20.4 years. Additionally, it is
                        turning 65 in 2011 and by 2030, the remainder will                     estimated that about one out of every four 65-year-
                        also reach age 65 and account for approximately                        olds will live to be 90 years old, with one of every 10
                        21% of the total United States population. By 2050,                    expected to live past 95 years of age.2
                        the 65-plus age group is estimated to exceed 85.6
                        million, a more than 50% increase over its estimated                   Driving this increased life expectancy, and
                        2020 population (56.1 million). The same figure for                    consequentially average population age, is the
                        85-plus group is even higher. By 2050, the 85-plus                     advancement in public health strategy and medical
                        age group is estimated to exceed 18.5 million, a                       treatment. Life expectancy in the United States has
                        177% increase over its estimated 2020 population (6.7                  increased by approximately 30 years over the past
                        million). Additionally, by 2035 the 65-plus age group is               century, primarily due to the reduction of acute illness
                        estimated to be larger than the population under age                   threats. However, an unforeseen consequence of longer
                        18. By 2035, there will be 78.0 million people 65 years                life expectancy has been the increased prevalence of
                        and older compared to 76.7 million under the age                       heart disease, cancer and other chronic diseases as the
                        of 18. The projected growth in the senior population                   leading causes of death. As Americans age during the
                        will present many challenges to policy makers and                      next several decades, the elderly population will require
                        programs by having a significant impact on families,                   a larger number of formally trained, professional
                        businesses, healthcare providers and, most notably, on                 caregivers as a direct effect of these chronic diseases,
                        the demand for senior housing.1                                        which often affect independence and mobility.3

                        One of the primary drivers in trends for the aging                     Moreover, the problems facing the United States aging
                        population is mortality rates. Survivorship rates have                 population can be witnessed as a global phenomenon.
                        shown consistent improvement for many decades. In                      Fifty countries had a higher proportion of people aged
                        the United States in 1972, the average life expectancy                 65-plus than the United States in 2010. This number
                        of a 65-year-old was 15.2 years. By 2017, the most                     is expected to increase to approximately 98 countries
                        recent available data, this metric increased by 5.2                    by 2050.1

                                                     NUMBER OF PEOPLE AGE 65 & OVER AND 85 & OVER
                         100                                                                                                                                94.7
                          90                                                                                                     85.7
                                                                                                      80.8
                          80                                               73.1
Population (millions)

                          70
                                                    56.1
                          60
                          50      40.3
                          40
                          30                                                                                                             18.6                      19.0
                          20                                                                                  14.4
                                         5.5               6.7                      9.1
                          10
                           0
                                    2010A            2020F                   2030F                      2040F                      2050F                        2060F

                                                    Population 65 +                                               Population 85 +
    Source: U.S. Census Bureau; 2017 National Population Projects: Summary Table 3: Projections of the Population by Sex and Age for the United States: 2017 to 2060.
    Released March 2018 historical data per census data.
    Note: “A” indicates actuals based on 2010 Census and “F” indicates forecasted population estimates released March 2018

(1) U.S. Census Bureau. (2) Social Security Administration, Retirement & Survivors Benefits: Life Expectancy Calculator, 2019. (3) Center for Disease Control
and Prevention. The State of Aging and Health in America Report.

4 |                       CBRE Q2 2021 SHMI
SENIOR HOUSING MARKET INSIGHT - Q2 2021
5            Senior Housing Demand is Driven by
              Demographic Demand (CONT’D)
                                                                                             U.S. POPULATION ESTIMATES AGE 75-PLUS
                                                 60                                                                                                                                                            14.0%
                 75-Plus Population (millions)

                                                 50                                                                                                                                                            12.0%

                                                                                                                                                                                                                          % of Total Population
                                                                                                                                                                                                               10.0%
                                                 40
                                                                                                                                                                                                               8.0%
                                                 30
                                                                                                                                                                                                               6.0%
                                                 20
                                                                                                                                                                                                               4.0%
                                                 10                                                                                                                                                            2.0%

                                                  0                                                                                                                                                            0.0%

                                                                                      Population 75+                                                   % of Total Population

                     Source: U.S. Census Bureau; release date: March, 2018 and U.S. Census Bureau, Statistical Abstract of the United States: 2012.
                     Note: “A” indicates actuals based on Census data and “F” indicates forecasted population estimates released March 2018.

      A Multi-Trillion Dollar Industry
      Annual United States healthcare services expenditures totaled almost $3.5 trillion in 2017. Healthcare is one of
      the largest line items in Federal and State Government spending. Healthcare spending is estimated to grow at an
      average of 5.5% per year from 2018 through 2027. Furthermore, over the same period, healthcare spending
      is estimated to grow 0.8% faster than GDP per year. As a result, the healthcare portion of GDP is expected to
      rise from 17.9% in 2017 to 19.4% by 2027.4
                                                                                     NATIONAL HEALTH EXPENDITURES (BILLIONS)

                                                                                                                                                                                                    $5,345

                                                                                                                                                                                                               $5,651

                                                                                                                                                                                                                                            $5,963
                                                                                                                                                                                         $5,049
                $7,000
                                                                                                                                                                              $4,767
                                                                                                                                                                   $4,502
                                                                                                                                                        $4,255
                                                                                                                                            $4,031

                $6,000
                                                                                                                                 $3,823
                                                                                                                      $3,649
                                                                                                           $3,487
                                                                                                $3,347
                                                                                    $3,200
                                                                          $3,025

                $5,000
                                                                $2,875
                                                      $2,791

                $4,000
                $3,000
                $2,000
                $1,000
                                                 $0

       Source: Centers for Medicare & Medicaid Services, actuals published as of 2/2019. The projections incorporate estimates of GDP and spending as of May 2017.

                                                                                    NATIONAL HEALTH EXPENDITURES PER CAPITA
                                                                                                                                                                                                                $16,309

                                                                                                                                                                                                                                                  $17,102
                                                                                                                                                                                                     $15,527
                                                                                                                                                                                          $14,764
                                                                                                                                                                               $14,035
                                                                                                                                                                    $13,344
                                                                                                                                                         $12,702
                                                                                                                                             $12,119

               $20,000
                                                                                                                                  $11,576
                                                                                                                       $11,174
                                                                                                            $10,743
                                                                                                 $10,380
                                                                                     $9,996
                                                                           $9,517
                                                                 $9,113
                                                       $8,909

               $15,000

               $10,000

                 $5,000

                                                 $0

      Source: Centers for Medicare & Medicaid Services, actuals published as of 2/2019. The projections incorporate estimates of GDP and spending as of May 2017.

      (4) Centers for Medicare & Medicaid Services, National Health Expenditure Projections 2018 – 2027 https://www.cms.gov/research-statistics-data-and-systems/
      statistics-trends-and-reports/nationalhealthexpenddata/downloads/forecastsummary.pdf.

5 |    CBRE Q2 2021 SHMI
SENIOR HOUSING MARKET INSIGHT - Q2 2021
6             2021 Census Data - Population Growth

 Population Change Shapes the Future of Cities
 Once a year, the U.S. Census Bureau publishes metro                                          move to these major metro areas. Population is a key
 population estimates for the prior year (as of July 1). These                                demand driver. Generally, the greater the population growth,
 estimates are separate from the decennial census.                                            the greater the chances that the adult children would want
                                                                                              their parents to move near to where they live. Past population
 The latest statistics released in Q2 2021 by the U.S.                                        growth trends do not precisely predict the future, but they
 Census Bureau provide salient insights into where growth                                     certainly point to patterns which are likely to occur over the
 is occurring and where it is not – an important framework                                    near term.
 for understanding the future of cities. They represent largely
 long-term trends, rather than short-term COVID-related                                       As the U.S. Census Bureau releases more data based on
 migration.                                                                                   the 2021 Census, we will receive a better projection for the
                                                                                              population growth in the senior population (65+, 75+, and
 The new metro population data also helps us understand                                       85+).
 the future of senior housing demand as more adult children

 Top 20 Metros for Total Population and Population Growth

          Total Population, 2020                                          Total Growth, 2020                                   Population Growth Rate, 2020
   Rank          MSA                      Millions            Rank          MSA                        No. Gain               Rank          MSA                      Percent
   1             New York                    19.1             1             Dallas/Ft. Worth            119,700               1             Austin                       2.8
   2             Los Angeles                 13.1             2             Phoenix                     106,000               2             Raleigh                      2.1
   3             Chicago                      9.4             3             Houston                      91,100               3             Phoenix                      2.0
   4             Dallas/Ft. Worth             7.7             4             Austin                       67,200               4             Las Vegas                    1.8
   5             Houston                      7.2             5             Atlanta                      60,500               5             Jacksonville                 1.8
   6             Washington                   6.3             6             Charlotte                    44,200               6             Charlotte                    1.7
   7             Miami                        6.2              7            Tampa                        43,800               7             Dallas/Ft. Worth             1.6
   8             Philadelphia                 6.1              8            Seattle                      40,800               8             Nashville                    1.6
   9             Atlanta                      6.1              9            San Antonio                  40,600               9             San Antonio                  1.5
   10            Phoenix                      5.1              10           Las Vegas                    40,100               10            Orlando                      1.3
   11            Boston                       4.9              11           Inland Empire                35,500               11            Houston                      1.3
   12            San Francisco                4.7              12           Orlando                      31,100               12            Tampa                        1.3
   13            Inland Empire                4.7              13           Raleigh                      28,000               13            Atlanta                      1.3
   14            Detroit                     4.30              14           Washington                   27,800               14            Oklahoma City                1.1
   15            Seattle                     4.02              15           Minneapolis                  27,200               15            Seattle                      1.0
   16            Minneapolis                 3.66              16           Nashville                    26,400               16            Atlanta                      1.0
   17            San Diego                   3.33              17           Raleigh                      26,100               17            Denver                       0.9
   18            Tampa                       3.24              18           Jacksonville                 17,800               18            Indianapolis                 0.9
   19            Denver                      2.99              19           Miami/So. Florida            17,700               19            Inland Empire                0.8
   20            St. Louis                   2.81             20            Indianapolis                 17,600               20            Salt Lake City               0.8

Source: CBRE Research, U.S. Census Bureau, Q2 2021. Note that the Inland Empire is a separate MSA and not included in Los Angeles. When combined, the metro population is
17.8 million. Similarly, San Jose is a unique MSA and not included in San Francisco MSA. When combined, the population is 6.7 million. Including San Jose, San Francisco would
rank sixth largest after Houston. Salt Lake City MSA does not include adjoining MSAs of Provo and Ogden. If they were included, the population would total 2.6 million and Salt
Lake City would rank 25th largest. Raleigh MSA does not include adjoining Durham MSA. Combined they had 2.1 million population in 2020.

6 |     CBRE Q2 2021 SHMI
SENIOR HOUSING MARKET INSIGHT - Q2 2021
7              Senior Housing Supply
                Total Supply

           NUMBER OF COMMUNITIES BY MAJORITY TYPE
                                                               Majority MC,
      Majority AL,                                             6%
      33%

                                                               Majority NC,
                                                               42%
      Majority IL,
      11%
                                                               CCRCs,
                                                               8%

                  NUMBER OF UNITS BY SEGMENT TYPE

        Majority                                               Majority IL,
        NC,                                                    23%
        46%

                                                               Majority AL,
                                                               23%

                                                               Majority MC,
                                                               8%

      Source: NIC MAP Data & Analysis Service; Q1 2021 Supply Report, All Markets.

Community Location in the top 100 NIC MAP Metro Markets
Although the 85+ plus population is predicted to increase by more than 11.8 million over the next 30 years, there are merely
2.0 million institutional quality units/beds in the major metro areas, of which nearly 46% are skilled nursing beds. The past and
certainly the current rate of new supply additions cannot keep up with this forecasted growth in demand.

                                                                                                      LOCATION MIX (UNITS/BEDS)
                                                Total No. of             Total No. of
 Region                                        Communities               Units/Beds
                                                                                           West,
 Northeast                                             3,320                    483,901    19.2%                                  Northeast,
                                                                                                                                  24.6%
 Southeast                                             3,706                    466,420
 North Central                                         3,303                    407,837    South
                                                                                           Central,
 South Central                                         2,244                    263,584    13.2%

 West                                                  3,436                    389,598
                                                                                           North                                  Southeast,
 Top 100 Metro Market                                                                      Central,                               22.8%
 Totals                                              16,009                    2,011,340   20.2%
Note:
Northeast – CT, DE, ME, MA, NH, NJ, NY, PA, RI, VT
Southeast – AL, DC, FL, GA, KY, MD, NC, SC, TN, VA, WV
North Central – IA, IL, IN, MI, MN, NE, ND, OH, SD, WI
South Central – AR, KS, LA, OK, TX, MO, MS
West – AK, AZ, CA, CO, HI, ID, MT, NM, NV, OR, UT, WA, WY

Source: NIC MAP Data & Analysis Service; Q1 2021 Supply Report, All Markets.

7 |    CBRE Q2 2021 SHMI
SENIOR HOUSING MARKET INSIGHT - Q2 2021
8             Senior Housing Investment Returns
                 Exceed Other Asset Classes
 The Property Index Performance Data provided by the National Council of Real Estate Investment Fiduciaries (NCREIF) indicates that
 reporting senior housing properties have generally outperformed the broader National Property Index (NPI) since at least 2003.

 The senior housing total return for Q1 2021 was 0.52%, which includes a 0.60% income return and a -0.08% capital appreciation
 return. Over the past four quarters, senior housing returned 0.73% (3.00% income and -2.22% appreciation). By comparison,
 the four quarters ending 2019 (Pre-COVID-19) returned 7.83% (4.41% income and 3.32% appreciation.) The five-year total
 return of 8.20% is 196 basis points higher than the NPI return (all asset classes) of 6.24% and 235 basis points higher than the
 multifamily total return of 5.85%.

 Over a five-year period, senior housing returns have outperformed the NPI and multifamily in total returns and income returns. The
 senior housing sector’s stronger performance may reflect the fact that senior housing has experienced continuous demand growth,
 despite the effects of COVID-19 significant fluctuations
 in the general economy. The following charts compare                              CUMULATIVE NCREIF TOTAL RETURNS
 the returns achieved by the senior housing component,                        NPI VS. MULTI-FAMILY VS. SENIOR HOUSING
 the multifamily component, and the overall index. Items
 shown for each quarter represent that particular quarter’s           4,900    Over the last ten years, Seniors Housing
                                                                               returns have consistently outperformed
 return, while periods showing a single year or multiple              4,400
                                                                               other types of real estate.
 years represent the compounded annual index returns                  3,900
                                                                      3,400
 achieved for that period. All returns are before fees.               2,900
                                                                               Index
                                                                                       2,400
                               Total Returns                                           1,900
                                                                                       1,400
                            Total NPI          Total       Total Stabilized
                                            Multi-Family   Senior Housing                900

Q1 2021                       1.81%             1.72%           0.52%
Q4 2020                       1.32%             1.04%           0.46%
                                                                                                All Properties NPI     Multi-Family    Senior Living Stabilized
Q3 2020                       0.89%             0.63%           0.47%
Q2 2020                      -0.88%            -0.57%          -0.72%           Chart Source: NCREIF Query Tool. 1Q 2006 = 1,000.
One Year Return              3.16%             2.84%            0.73%
Three Year Return            5.30%             4.88%            5.51%
Five Year Return             6.24%             5.85%            8.20%                          CUMULATIVE NCREIF APPRECIATION RETURNS
Ten Year Return              9.19%             8.97%           11.06%                           NPI VS. MULTI-FAMILY VS. SENIOR HOUSING
Fifteen Year Return          6.88%             6.56%           9.86%                   2,100
                                                                                       1,900
                       Capital (Appreciation) Returns                                  1,700
                                                                               Index

                                                                                       1,500
                            Total NPI          Total        Total Stabilized
                                            Multi-Family   Seniors Housing             1,300

Q1 2021                       0.83%             0.91%          -0.08%                  1,100

Q4 2020                       0.36%             0.25%          -0.26%                   900

Q3 2020                      -0.07%            -0.19%          -0.33%
Q2 2020                      -1.83%            -1.48%          -1.56%
One Year Return              -0.73%            -0.52%          -2.22%                           All Properties NPI     Multi-Family   Senior Living Stabilized
Three Year Return            1.10%             1.14%           1.47%
Five Year Return             1.89%             1.98%           3.80%            Chart Source: NCREIF Query Tool. 1Q 2006 = 1,000.
Ten Year Return              4.25%             4.54%           5.76%
Fifteen Year Return          1.82%             2.08%           4.29%
                                                                                                CUMULATIVE NCREIF INCOME RETURNS
                                  Income Returns                                               NPI VS. MULTI-FAMILY VS. SENIOR HOUSING
                            Total NPI          Total        Total Stabilized           2,400
                                                                                       2,300
                                            Multi-Family   Seniors Housing             2,200
                                                                                       2,100
Q1 2021                      0.98%             0.81%            0.60%                  2,000
                                                                                       1,900
                                                                                       1,800
Q4 2020                      0.95%             0.78%            0.72%
                                                                               Index

                                                                                       1,700
                                                                                       1,600
Q3 2020                      0.96%             0.82%            0.80%                  1,500
                                                                                       1,400
Q2 2020                      0.95%             0.91%            0.85%                  1,300
                                                                                       1,200
One Year Return              3.90%             3.36%            3.00%                  1,100
                                                                                       1,000
                                                                                         900
Three Year Return            4.16%             3.70%            4.00%
Five Year Return             4.28%             3.82%            4.29%
Ten Year Return              4.79%             4.30%            5.09%
Fifteen Year Return          4.98%             4.42%            5.41%                           All Properties NPI    Multi-Family    Senior Living Stabilized
Source: NCREIF. Quarterly returns are not annualized.                          Chart Source: NCREIF Query Tool. 1Q 2006 = 1,000.

8 |     CBRE Q2 2021 SHMI
SENIOR HOUSING MARKET INSIGHT - Q2 2021
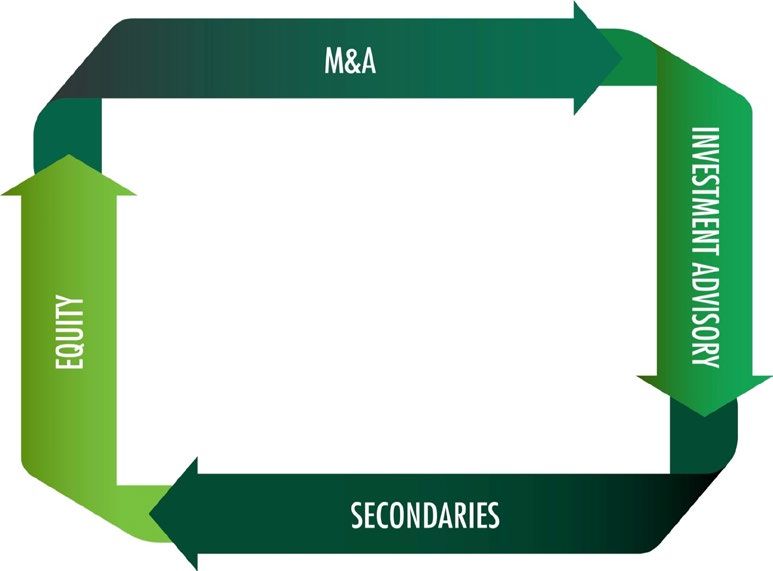
9       Capitalization Rates
  Summary of Capitalization Rates Fall 2020 Survey
  The table below summarizes the results of CBRE’s U.S. Senior Housing & Care Cap Rate Survey for the second
  half of 2020. The survey revealed that senior housing capitalization rates have increased since the survey for
  the first half of 2020. The spread changes range from -24 to 84 basis points for Class A properties and from
  -22 to 94 basis points for Class B and C properties, depending on the respective level of care and core versus
  non-core locations.

  Spreads by investment class also changed from the first half of 2020 and now show more fluctuation between
  Classes B to C and A to C. The change from the first half of 2020 for the spread from Class A to Class B properties
  increased for most property types, except for core NC properties and non-core Active Adult. The spreads between
  core and non-core assets were largest for independent living and assisted living communities, which indicates
  that location remains a key element in determining the capitalization rate. When survey respondents were asked
  about the biggest opportunities for investment in the current environment most respondents reported that the
  most attractive investment opportunities are in assisted living followed by independent living. The increase in cap
  rates for core Class A assets was smallest for independent living and CCRCs indicating their stronger resilience
  during the pandemic relative to that of assisted living and memory care segments.

                                          Class A                                 Class B                              Class C
                            Low     High Average Change               Low     High Average Change          Low    High Average Change
                            (%)     (%)    (%)    (bps)               (%)     (%)    (%)    (bps)          (%)    (%)    (%)    (bps)
                   Active   4.00% 8.00%       5.20%         84        4.00% 9.00%       6.20%    94       5.00% 10.00% 7.20%             88
                   Adult
                   IL       4.00%    8.00%    5.60%          8        5.00%    9.00%    6.50%    28        5.00% 10.00%     7.50%        21
            Core   AL       4.00%    9.00%    6.30%         38        5.00%   10.00%    7.30%    65        6.00% 11.00%     8.40%        15
                   MC       5.00%   10.00%    7.20%         36        5.00%   10.00%    8.00%    40        6.00% 11.00%     8.90%        32
                   NC       9.00%   14.00%   11.20%         8         9.00%   14.00%   11.90%    -8       11.00% 16.00%     13.70%       34
                   CCRC/    5.00% 10.00% 7.20%              7         6.00% 11.00% 8.30%         32       7.00% 12.00% 9.30%             19
                   LPC

                   Active   4.00% 8.00%       5.80%         83        5.00% 9.00%       6.70%    75       5.00% 10.00% 7.50%             55
                   Adult
                   IL       5.00%    9.00%    6.30%         -11       5.00%   10.00%    7.20%     18       6.00% 11.00%      8.10%       -1
           Non-    AL       5.00%   10.00%    6.90%          26       5.00%   10.00%    7.60%     39       6.00% 11.00%     8.60%        27
           Core    MC       5.00%   10.00%    7.50%          28       5.00%   10.00%    8.10%     38       6.00% 11.00%     9.10%        38
                   NC       9.00%   14.00%   11.50%         -24       9.00%   16.00%   12.20%    -22      11.00% 16.00%     13.70%        9
                   CCRC/    6.00% 11.00% 8.00%              37        6.00% 11.00% 8.70%         51       7.00% 12.00% 9.60%             23
                   LPC
                               Investment Class Spreads (bps)                            Location Spreads (Core Vs. Non-Core in bps)

                            A-B Change B-C Change A-C Change                                A    Change      B     Change      C     Change

                   Active                                                      Active
                            93       10      99       -6        193     3                   57     -1       52       -19      34       -33
                   Adult                                                       Adult
                   IL        98      19      100       -7       198     13     IL           76    -19       69        -9      60       -22
                   AL       100      27      111      -51       211    -23     AL           62    -12       34       -26      24        12
            Core
                   MC       74       4        95       -8       170     -3     MC           30     -8       17        -2      17         6
                   NC       79      -16      172      42        251    26      NC           36    -32       26       -15      7        -25
                   CCRC/                                                       CCRC/
                            108      25      103      -12       211    12                   80    30        42        19      23         4
                   LPC                                                         LPC

                   Active   88       -7      81       -20       169    -28
                   Adult
                   IL       92       29       90      -19       182    10
           Non-    AL       71       13      101      -12       172     1
           Core    MC       61       10      96        0        157    10
                   NC       70        1      153      32        223    33
                   CCRC/                                                                         Source: CBRE Senior Housing & Care Investor Survey, H2 2020.
                            69       14      84       -28       154    -14
                   LPC                                                                           Change from H1 2020 Survey.

9 |   CBRE Q2 2021 SHMI
10             Historical Capitalization Rates Trends

        CBRE has published the Seniors Housing & Care                       Historical data from the survey indicates overall
        Investor Survey since the beginning of 2014 and                     compression in capitalization rates. However, the
        included the following capitalization rate trends                   COVID-19 pandemic has reversed this trend, with
        as consolidated from the historical trends for each                 rates for nearly all care levels increasing. Skilled
        care level.                                                         nursing is the only care level that maintained flat
                                                                            capitalization rates through this period.

            Source: CBRE Seniors Housing & Care Investor Survey, H2 2020.

10 |   CBRE Q2 2021 SHMI
11                  Senior Housing Capitalization Rate Comparison

        Seniors - Yield Opportunity
        Senior housing continues to provide a yield premium over conventional multifamily. The following
        capitalization rates for each asset class are based on the actual transactions completed Q1 2021.

                CAP RATE COMPARISONS - CONVENTIONAL MULTI-FAMILY VS. SENIOR HOUSING & NURSING CARE

             US Senior Housing                                                                                                                       7.0%

                         US Office                                                                                                            6.6%

                         US Retail                                                                                                            6.6%

                    US Industrial                                                                                                      5.9%

                US Multi-Family                                                                                           5.1%

       Source: Real Capital Analytics TrendTracker Report, Q1 2021. Note: U.S. Senior housing cap rates exclude nursing care transactions.

        Historical Multi-family and Senior Housing & Nursing Care Cap Rates
        Senior housing acquisitions provide an income yield advantage over multifamily value-add acquisitions,
        trading at higher capitalization rates.

                CAP RATE COMPARISONS - CONVENTIONAL MULTI-FAMILY VS. SENIOR HOUSING & NURSING CARE

               8.00%

               7.50%

               7.00%

               6.50%

               6.00%

               5.50%

               5.00%

                                                                  US Seniors Housing               US Multi-Family

           Source: Real Capital Analytics TrendTracker Report, Q1 2021. Note: Actual transactions based cap rates.

11 |   CBRE Q2 2021 SHMI
12                                Pricing Per Unit/Bed

 Per Unit Pricing 2008 through Q1 2021

 Based upon transactional data collected by NIC/RCA, pricing per unit is up from prior lows for 2020.

                         SENIOR HOUSING PRICE PER UNIT TREND                                                          NURSING CARE PRICE PER UNIT TREND

        250,000                                                                                 120,000

        200,000                                                                                 100,000

                                                                                                      80,000
        150,000
                                                                                                      60,000
        100,000
                                                                                                      40,000
              50,000                                                                                  20,000

                     -                                                                                           -
                                  2018              2019         2020          2021 YTD                                    2018              2019      2020          2021 YTD
                           Q1                 Q2             Q3                  Q4                                   Q1                Q2          Q3                 Q4

 Source: NIC-RCA Sales Transactions Trend.

 Historical Value Per Unit Pricing
                         SENIOR HOUSING (IL/AL) PRICE PER UNIT                                                       INDEPENDENT LIVING (IL) PRICE PER UNIT
              $275                                                                                         $275

              $225                                                                                         $225
                                                                                              Thousands
  Thousands

              $175                                                                                         $175

              $125                                                                                         $125

               $75                                                                                          $75
                         2010 2011 2012 2013 2014 2015 2016 2017 2018 2019 2020                                       2010 2011 2012 2013 2014 2015 2016 2017 2018 2019 2020

                          Median IL/AL price per unit      Average IL/AL price per unit                                 Median IL price per unit    Average IL price per unit

                           ASSISTED LIVING (AL) PRICE PER UNIT                                                          NURSING CARE (NC) PRICE PER UNIT
              $275                                                                                        $105
                                                                                                           $95
              $225                                                                                         $85
  Thousands

                                                                                              Thousands

                                                                                                           $75
              $175
                                                                                                           $65
                                                                                                           $55
              $125
                                                                                                           $45
               $75                                                                                         $35
                         2010 2011 2012 2013 2014 2015 2016 2017 2018 2019 2020                                      2010 2011 2012 2013 2014 2015 2016 2017 2018 2019 2020

                           Median AL price per unit        Average AL price per unit                                  Median NC price per bed       Average NC price per bed

   Source: The Seniors Housing Acquisition & Investment Report, Twenty-Sixth Edition, 2021.

12 |            CBRE Q2 2021 SHMI
13                                  Transaction Activity

                                             Senior Housing Transaction Volume Trends
                                             Although transaction volume for 2020 declined significantly due to COVID-19 compared to prior years, the
                                             volume still was greater than the entire years of 2008 and 2009, and the annual volume for 2020 has surpassed
                                             the 2010 volume. Q1 2021 transaction volume fell short of the same period of 2020, but was slightly higher
                                             than 2019 Q1 volume. Q4 2020 and Q3 2020 volume grew from the Q2 2020 volume making Q2 2020 the
                                             slowest quarter for senior housing transactions in over a decade. Nursing Care Q1 2021 transaction volume
                                             was the lowest volume reported in the last four years.

                                                                             SENIOR HOUSING TRANSACTION VOLUME TREND

                                                 14

                                                 12
               Dollar Volume (in Billions)

                                                 10

                                                  8

                                                  6

                                                  4

                                                  2

                                                 -
                                                              2018                       2019                  2020                      2021 YTD

                                                                     Q1                   Q2                  Q3                    Q4

                              Source: NIC-RCA Sales Transactions Trend Q1 2021.

                                                                                  NURSING CARE TRANSACTION VOLUME TREND

                                             6

                                             5
Dollar Volume (in Billions)

                                             4

                                             3

                                             2

                                             1

                                             -
                                                             2018                        2019                   2020                      2021 YTD

                                                                    Q1                    Q2                  Q3                      Q4

     Source: NIC-RCA Sales Transactions Trend Q1 2021.

13 |                                                 CBRE Q2 2021 SHMI
14                          Transaction Activity by
                             Buyer & Seller Type

       U.S. Based Senior Housing & Care Transaction Activity by Buyer Type
         Cross-Border (Internationally Based)                                              Private Equity
         A buyer is defined as “cross-border” if the buyer or                              “Private equity,” as an investor type, refers to companies
         major capital partner is not headquartered in the country                         whose control is in private hands and whose business
         where the property is located. An increasing number                               is primarily geared toward operating, developing, or
         of firms have subsidiaries accessing capital in multiple                          investing in commercial real estate. This includes private
         countries. A firm may have two headquarters locations                             equity joint ventures, commingled funds, and high net
         for the purposes of the pie chart analysis. For example,                          worth family offices.
         Deutsch Bank (DB Real Estate) is assumed to be based in
         Germany for deals outside of the United States while their                        Public Listed/REITs
         acquisitions within the United States are assumed to be                           Companies and or funds traded on open public markets
         made via its domestic headquartered subsidiary, RREEF.                            whose business is primarily geared toward investing in
                                                                                           and or operating or developing commercial real estate.
         Institutional                                                                     These include REITs, REOCs, and publicly-listed funds.
         “Institutional” refers to an investor, such as a bank,
         insurance company, retirement fund, hedge fund, or                                User/Other
         mutual fund, that is financially sophisticated and makes                          Users of commercial property for specific purposes;
         large investments, often held in very large portfolios of                         business users, government, educational or religious
         investments.                                                                      institutions that own real estate for their own use.

           SENIOR HOUSING TRANSACTION ACTIVITY BY BUYER TYPE — U.S. BASED SENIOR HOUSING & CARE PROPERTIES

                  100%            1.6%                        1.6%                         1.8%                 0.6%                  1.7%

                   80%            34.7%                      42.3%                         45.5%                                     47.1%
                                                                                                               61.0%
        Buyer %

                   60%
                                  25.8%
                   40%                                       31.0%                         22.0%                                     26.2%
                                                                                                               15.4%
                   20%            31.6%                                                                                               4.4%
                                                6.2%         21.0%            4.1%         28.1%     2.6%      20.8%       2.2%
                                                                                                                                     20.6%
                    0%
                                  2017                        2018                         2019                 2020                2021 YTD

                           Cross-Border                 Institutional                  REIT/Listed            Private             User/Other

       Source: Real Capital Analytics, April 30, 2021. Note: 2021 YTD through Q1.

           SENIOR HOUSING TRANSACTION ACTIVITY BY SELLER TYPE — U.S. BASED SENIOR HOUSING & CARE PROPERTIES

                  100.0%            3.0%                         2.8%                        4.5%                 4.0%                  1.3%

                   80.0%                                        41.3%                                                                  36.6%
                                   46.9%                                                                         44.4%
       Seller %

                                                                                            51.7%
                   60.0%

                   40.0%                                                                                                               40.4%
                                                                42.0%                       26.4%
                                   42.8%                                                                         43.1%
                   20.0%
                           0.7%                     1.2%        12.7%               1.4%    16.0%      3.6%                  0.9%      20.8%
                                    6.6%                                                                          4.9%
                    0.0%
                                    2017                         2018                        2019                 2020                2021 YTD
                         Cross-Border                   Institutional                  REIT/Listed             Private             User/Other
       Source: Real Capital Analytics, April 30, 2021. Note: 2021 YTD through Q1.

14 |       CBRE Q2 2021 SHMI
15                                                Senior Housing Construction Activity
 COVID-19 continues to take a toll on the construction activity in the senior housing space. The new construction
 starts declined further during Q1 2021, making it the fourth consecutive quarter of muted new construction activity.
 Under-construction units as a percentage of current inventory were at the lowest levels in the last five years across
 all segments. Significant dip in occupancy, pullback from construction financing lenders, and the skyrocketing
 material costs were amount the major reasons impacting the construction activity.

                                                                          NEW CONSTRUCTION STARTED BY QUARTER

                                            6000
          Number of Units Started

                                            5000
                                            4000
                                            3000
                                            2000
                                            1000
                                               0

                                                     Independent Living          Assisted Living    Memory Care     Nursing Care

               Source: NIC MAP Construction Starts Trends (Q1 2021).

                                                                          ANNUAL INVENTORY GROWTH BY SEGMENT

                                           12.0%
       Inventory Growth (%)

                                           10.0%
                                            8.0%
                                            6.0%
                                            4.0%
                                            2.0%
                                            0.0%
                                           -2.0%

                                                     Independent Living           Assisted Living     Memory Care      Nursing Care

          Source: NIC MAP® Data Service, Q1 2021. All Markets.

                                                                  UNDER CONSTRUCTION UNITS VS CURRENT INVENTORY
          Construction as % of Inventory

                                           16.0%
                                           14.0%
                                           12.0%
                                           10.0%
                                            8.0%
                                            6.0%
                                            4.0%
                                            2.0%
                                            0.0%

                                                    Independent Living          Assisted Living     Memory Care     Nursing Care

       Source: NIC MAP® Data Service, Q1 2021. All Markets.

15 |                  CBRE Q2 2021 SHMI
16                               Occupancy Rates & Average
                                      Monthly Rent Growth

     As this graph of the historical occupancy rates for stabilized communities shows, Q1 2021 Senior Housing occupancy
     rates for all segments experienced a decline due to the continuing impact of COVID-19 and now stands at its
     lowest level in over five years. It is important to note that although the occupancies have suffered significantly due
     to COVID-19, most communities are reporting nearly 100% vaccination among their residents, and the operators
     are reporting a tick up in occupancy in Q1 2021.
                                                                   STABILIZED OCCUPANCY BY SEGMENT
                            95.0%
 Stabilized Occupancy (%)

                            90.0%

                            85.0%

                            80.0%

                            75.0%

                            70.0%

                                                     Independent Living        Assisted Living    Memory Care        Nursing Care

                                                                   ANNUAL RENT GROWTH BY SEGMENT
                            4.0%
                            3.5%
                            3.0%
 Rent Growth

                            2.5%
                            2.0%
                            1.5%
                            1.0%
                            0.5%
                            0.0%

                                      Independent Living                  Assisted Living             Memory Care                   Nursing Care

                                                 AVERAGE MONTHLY RENT BY SEGMENT (DAILY FOR NURSING CARE)

                            8,000                                                                                                                  350
                            7,000                                                                                                                  340
 Average Monthly Rent

                            6,000
                                                                                                                                                         Average Daily Rate
                                                                                                                                                   330
                            5,000
                                                                                                                                                   320
                            4,000
                                                                                                                                                   310
                            3,000
                                                                                                                                                   300
                            2,000
                            1,000                                                                                                                  290

                               -                                                                                                                   280

                                                    Independent Living        Assisted Living    Memory Care        Nursing Care

     Source: NIC MAP® Data Service, Q1 2021. All Markets.

16 |                          CBRE Q2 2021 SHMI
17               How Does Occupancy Stack Up With
                  Other Property Types?

   While senior housing occupancy suffered throughout 2020 and continues to suffer in 2021 due to COVID-19,
   hotel occupancy has suffered the most. Q1 2021 senior housing occupancy is the lowest in over 5 years, the
   hotel occupancy have seen an increase in Q1 2021, indicating increased business activity.

   It is interesting to compare occupancy across sectors. The chart below portrays the largest decline in hotel
   occupancy. This is because hotel occupancy is determined on a day-by-day on a guest-by-guest basis. Office
   and retail occupancy statistics are based upon “leased” occupancy rather than “physical” occupancy. While an
   office building or retail center may be reporting that it is 85% leased, the physical occupancy may be significantly
   less than the leased occupancy. It is uncertain how long tenants will continue to pay their lease or how long the
   landlords will be able to forbear rent and to keep leases intact.

                  COMPARISON OF OCCUPANCY SENIOR HOUSING VS. OTHER COMMERCIAL PROPERTY TYPE

                                 95.0%

                                 85.0%

                                 75.0%

                                 65.0%

                                 55.0%

                                 45.0%

                                 35.0%

                                 25.0%
                                                                                                                           1Q20 2Q20 3Q20 4Q20 1Q20
                                           2010 2011 2012 2013 2014 2015 2016 2017 2018 2019
                                                                                                                            20   20   20   20   21
          Office Occupancy                82.4% 82.4% 82.8% 83.0% 83.1% 83.5% 83.8% 83.6% 83.4% 83.2% 83.1% 87.0% 86.0% 85.0% 84.0%
          Retail Occupancy                89.1% 89.1% 89.3% 89.6% 89.8% 90.0% 90.1% 90.0% 89.8% 89.8% 89.9% 93.6% 93.4% 93.4% 93.5%
          Multi-family Occupancy          92.9% 93.8% 95.3% 95.6% 95.6% 95.7% 95.8% 95.4% 95.2% 95.4% 95.3% 95.4% 95.6% 95.5% 95.3%
          Hotel Occupancy (rigth axes) 63.9% 66.5% 67.1% 67.9% 70.3% 67.3% 71.1% 71.1% 73.1% 66.1% 41.0% 29.0% 41.0% 39.0% 51.0%
          Seniors Housing Occupancy 87.4% 88.0% 88.9% 89.5% 89.8% 90.0% 89.4% 88.9% 88.0% 88.9% 87.6% 84.9% 82.3% 80.9% 78.9%

         Sources: Seniors Housing source is NIC MAP® Data Service; Retail, Office and Multi-family source is Mortgage Bankers Association Quarterly Data Book;
         HotelNewsNow Newswire May 2019 US Hotel Performance Data. 2021 data is CBRE research reports.

17 |   CBRE Q2 2021 SHMI
18                   REIT Performance
 Prices for all publicly traded REITs across asset classes plummeted in March 2020 due to COVID-19 driven volatility; however,
 as evidenced by the Change Since 2/14/2020 column in the chart below, Healthcare REITs have rebounded stronger than
 multifamily, hotel and office REITs, while data centers, malls, and self-storage have performed better. Some of the operators
 for major healthcare REITs are reporting a rebound in traffic and an uptick in occupancy, projecting the prepandemic level
 occupancies by year end.

                                                            REIT Pricing as of May 24, 2021

                                                              Discount/                                       Change                                         Change
                                                                                        1-Day                                           YTD
                          REIT                               Premium to                                        Since                                        Since YTD
                                                                                       Change                                         Change
                                                                NAV                                         2/14/20201                                         Low

  SNL U.S. REIT Equity                                      12.3%                  1.1%                   (1.6%)                  15.8%                  20.4%

  Data Centers(2)                                           24.0%                  0.0%                   23.2%                   23.2%                  18.4%

  Healthcare                                                22.8%                  1.5%                   (11.2%)                 7.6%                   12.9%

  Hotel                                                     (4.5%)                 1.2%                   (12.2%)                 14.4%                  20.5%

  Industrial                                                21.6%                  1.0%                   17.0%                   15.6%                  21.8%

  Malls                                                     2.1%                   2.0%                   (10.1%)                 45.3%                  48.8%

  Multifamily                                               12.2%                  1.5%                   (12.4%)                 25.1%                  29.7%

  Office                                                    (11.1%)                1.9%                   (17.8%)                 13.5%                  19.8%

  Self-Storage                                              23.4%                  0.7%                   22.5%                   22.8%                  31.1%

  Shopping Centers                                          6.0%                   0.9%                   (1.5%)                  38.1%                  43.2%

 Sources: CBRE Research, S&P Global Market Intelligence, Bloomberg. (1) Immediately prior to market volatility driven by COVID-19. (2) Index derived using S&P Global Market
 Intelligence data and includes the following REITs: COR, CONE, DLR, EQIX and QTS. Numbers as of the close of May 24th trading.

18 |    CBRE Q2 2021 SHMI
19                   Markets with Highest Occupancies

 Top Ten Markets with Highest Occupancy as of Q1 2021

                              %                          %                       %                    %                       %
               IL                             AL                     MC                     NC                  CCRC*
                             Occ.                       Occ.                    Occ.                 Occ.                    Occ.

                                                                Las Vegas,                                   Greensboro,
 1      Lancaster, PA 93.7% Vallejo, CA                 92.0%                   91.2% Madera, CA     87.7%                   94.3%
                                                                NV                                           NC

                                                                                      San
        Springfield,                                            Kansas City,                                 Des Moines,
 2                          92.8% Jackson, MS           89.7%                   88.7% Francisco,     86.9%                   93.3%
        MA                                                      MO                                           IA
                                                                                      CA

 3      Utica, NY           92.7% Saginaw, MI           87.7% Portland, ME      88.1% Utica, NY      86.4% Austin, TX        92.3%

        Syracuse,                                                                                            San Jose,
 4                          90.5% Reading, PA           87.3% Albany, NY        87.4% Albany, NY     85.6%                   91.7%
        NY                                                                                                   CA

 5      Portland, ME        90.4% Honolulu, HI          87.2% Tulsa, OK         85.2% Portland, ME   83.7% Boston, MA        91.5%

                                                                                                           San
        Spokane,                        Spokane,                Virginia
 6                          90.3%                       86.9%                   84.7% Fresno, CA     83.5% Francisco,        91.4%
        WA                              WA                      Beach, VA
                                                                                                           CA

        Asheville,                      Sebastian,              Charleston,             Lexington,           Jacksonville,
 7                          90.0%                       86.7%                   82.9%                83.2%                   91.2%
        NC                              FL                      SC                      KY                   FL

        New Haven,                                              San                     Grand
 8                          88.0% Portland, ME          86.6%                   82.9%                82.1% Chicago, IL       91.1%
        CT                                                      Francisco, CA           Rapids, MI

        Oklahoma                                                                        Charleston,       Grand
 9                          87.1% York, PA              86.4% Raleigh, NC       81.6%               81.7%                    90.9%
        City, OK                                                                        SC                Rapids, MI

        The                                                     Birmingham,       Greenville,                Charlotte,
 10                  86.7% Racine, WI                   86.2%               81.4%                    81.6%                   90.7%
        Villages, FL                                            AL                SC                         NC

 Source: NIC MAP® Data Service, Q1 2021. All Markets.
 *Occupancies for Entry-fee CCRCs only.

19 |    CBRE Q2 2021 SHMI
20                  Markets with Lowest Occupancies

 10 Markets with Lowest Occupancy as of Q1 2021

                               %                         %                     %                      %                      %
                IL                             AL                    MC                    NC                  CCRC*
                              Occ.                      Occ.                  Occ.                   Occ.                   Occ.

         Bridgeport,                                                                                        Oklahoma
  1                          58.6% Trenton, NJ          62.9% Columbia, SC    54.6% Houston, TX      57%                    73.2%
         CT                                                                                                 City, OK

                                        Charleston,
  2      Akron, OH           60.1%                      63.1% San Jose, CA    54.9% Tulsa, OK        60%    Tampa, FL       76.1%
                                        SC

         Knoxville,
  3                          61.0% Austin, TX           63.8% Lansing, MI     57.5% Merced, CA       60%    Houston, TX     76.3%
         TN

                                        The Villages,                                 San Antonio,
  4      Louisville, KY      63.0%                      66.2% Melbourne, FL 60.5%                    62%    Hartford, CT    78.3%
                                        FL                                            TX

         Columbia,                      Fort Myers,
  5                          64.0%                      66.9% Boise, ID       60.9% Dallas, TX       62%    St. Louis, MO   80.6%
         SC                             FL

         Charleston,                    Santa Rosa,             Columbus,             St. Louis,
  6                          64.8%                      67.0%                 61.1%                  63%    Miami, FL       81.2%
         SC                             CA                      OH                    MO

         Cleveland,                     Cincinnati,             Cincinnati,                                 Kansas City,
  7                          67.9%                      67.3%                 61.3% McAllen, TX      63%                    82.0%
         OH                             OH                      OH                                          MO

         Greenville,                    Baton                                         Little Rock,          Indianapolis,
  8                          67.9%                      68.6% Stockton, CA    61.4%                  65%                    82.7%
         SC                             Rouge, LA                                     AR                    IN

                                        Port St.                Richmond,                                   Youngstown,
  9      Ogden, UT 69.4%                                68.9%                 61.7% Provo, UT        65%                83.3%
                                        Lucie, FL               VA                                          OH

         Fort Myers,                    Rochester,                                    Janesville,
  10                        69.7%                       69.4% Louisville, KY 64.9%                   65%    Dallas, TX      83.4%
         FL                             NY                                            WI

 Source: NIC MAP® Data Service, Q1 2021. All Markets.
 *Occupancies for Entry-fee CCRCs only.

20 |    CBRE Q2 2021 SHMI
21             Top Ten Senior Housing Owners & Operators

          Top Ten Senior Housing Owners

           RANK                       COMPANY                              OWNERSHIP                   UNITS/BEDS   PROPERTIES

               1       Welltower                                            Public -> WELL               68,689        701

               2       Ventas, Inc.                                         Public -> VTR                58,425        665

               3       Brookdale Senior Living                              Public -> BKD                31,130        348
                       Healthpeak Properties (formerly
               4                                                            Public -> PEAK               30,401        218
                       known as HCP Inc.)
               5       Boston Capital                                       Private                      29,193        404
                       Diversified Healthcare Trust
               6       (formerly Senior Housing                             Public -> DHC                27,253        247
                       Properties Trust)
               7       Colony Capital, Inc.                                 Public -> CLNY               18,764        208
                       Harrison Street Real Estate
               8                                                            Private                      16,419        114
                       Capital
               9       National Health Investors                            Public -> NHI                12,852        148

              10       Senior Lifestyle                                     Private                      12,475        133

          Top Ten Senior Housing Operators

           RANK                       COMPANY                              OWNERSHIP                   UNITS/BEDS   PROPERTIES

               1       Brookdale Senior Living                              Public -> BKD                62,562        728

               2       LCS                                                  Private                      40,001        134

               3       Holiday Retirement                                   Private                      31,684        261

               4       Five Star Senior Living, Inc.                        Public -> FVE                27,398        242

               5       Sunrise Senior Living                                Private                      24,641        268

               6       Erickson Living                                      Private                      23,441         19

               7       Atria Senior Living, Inc.                            Private                      21,722        178

               8       Senior Lifestyle                                     Private                      19,027        190

               9       Capital Senior Living Corporation                    Public -> CSU                11,878        124

              10       Enlivant                                             Private                      10,798        229

          Source: “ASHA 50 Report” ASHA: American Seniors Housing Association, (as of June 1, 2020).

21 |   CBRE Q2 2021 SHMI
22                  About CBRE Senior Housing -
                     Our National Presence

  CBRE has assembled a fully
  integrated team with the                                 WA

  experience, expertise, and                                                MT           ND
                                                                                                                                                                              ME

  successful track record                             OR                                            MN                                                              VT
                                                                                                                                                                         NH
  necessary to structure and                                     ID
                                                                                         SD
                                                                                                                WI                                            NY
                                                                                                                                                                         MA

  execute a transaction to                                                   WY                                                MI                                        CT RI

  meet the client’s objectives.                             NV
                                                                                         NE
                                                                                                     IA                                                  PA
                                                                                                                                                                   NI
                                                                                                                                         OH               MD       DE
                                                                                                                     IL   IN
                                                                       UT
                                                                                 CO                                                            WV
                                                                                              KS                                                         VA
                                                                                                          MO
                                                     CA                                                                             KY

                                                                                                                                                         NC
                                                                                                                               TN

  45 States
                                                                  AR                           OK
                                                                                 NM                       AR                                    SC

                                                                                                                           AL             GA
                                                                                                                     MS

  1,000+ Communities                                                                     TX               LA

  127,100+ Units/Beds                                                                                                                               FL

         CBRE Senior Housing Offices: San Diego,   States where CBRE Team Members have         CBRE Senior Housing & Care Valuation & Advisory
         Houston, Boston, and Washington D.C.      conducted business                          Services Offices

          INVESTMENT SALES                                  COMPLETED IN                                       DEBT TRANSACTIONS
       TRANSACTIONS SINCE 2014                               2019 & 2020                                           SINCE 2014

                 $7.4B+                                     $3.1B+                                                   $8.3B+
       From 2014 to Q1 2021 principals              CBRE Senior Housing closed                               From 2014 to Q1 2021
       of the CBRE Senior Housing team             over $3.1 billion in investment                         CBRE Senior Housing has
       completed more than $7.4 billion             sales and debt transactions                           completed over $8.3 billion
          in senior housing investment               across the U.S. in 2019 &                            in debt transaction volume.
        sales, investment banking, and                         2020.
         leasing transactions spanning
              across multiple states.

22 |   CBRE Q2 2021 SHMI
23                Services offered by
                   CBRE Senior Housing

 CBRE Senior Housing is an industry leader in investment sales,
 debt originations, and investment banking within the senior
 housing sector. CBRE Senior Housing has transacted more
 than $15.7 billion across the nation since 2014 and over
 $25.1 billion in transaction volume since 2005.

 CBRE Senior Housing offers a depth of expertise rarely found
 in the senior housing sector. The breadth of our experience
 as developers, institutional investors, appraisers, and owner/
 operators has given us the ability to understand a transaction
 from all sides.

 CBRE Senior Housing focuses exclusively on senior housing.
 We provide a wide variety of services, including:

       •   Investment property sales
       •   Development land
       •   Structured debt
       •   Investment banking/Capital raise
       •   Valuation
       •   Property tax services
       •   General consulting

 We provide investment opportunities to the marketplace across
 a broad spectrum of senior housing property types including:

       • Age-restricted multifamily (55+)
       • Active Adult
       • Independent living
       • Assisted living
       • Alzheimer’s/memory care
       • Skilled nursing and continuum of care
       • Continuing care retirement communities
         (rental and entry fee)
       • Post acute/Sub acute care

 For more information about CBRE Senior Housing, please
 visit our website at www.cbre.com/nationalseniorhousing.

23 |       CBRE Q2 2021 SHMI
24                        24            CBRE Valuation Services

                           Industry-Leading Reports & Analyses
                           We empower clients to make informed business decisions by
                           providing accurate and reliable insights backed by the most
                           comprehensive data and professional experience.

                           Trusted, Independent Advisors
                           We serve as independent advisors, offering a consultative
                           approach and flexible solutions that are customizable to meet
                           specific client requirements.

                           Premier Platform & Global Scale
                           We cover virtually all property types and geographies, from
                           large, multi-market portfolios to special-use assets, and
                           can accommodate compressed deadlines and multi-year
                           engagements.

                                   800                      90              70K
                              U.S. Professionals       U.S. Offices         U.S. Yearly
                                                                           Assignments

                           Services:
                           Valuation & Advisory Services:

                              •   Appraisals
                              •   Alternative Valuations (Evaluations)
                              •   Valuation Portfolio Services
                              •   Valuations for Financial/Tax Reporting
                              •   Property and Transaction Tax Services
                              •   Right of Way/Eminent Domain
                              •   Litigation Support/Testimony

                           Assessment & Consulting:

                              • Property Condition Assessments (PCAs)
                              • Environmental Site Assessments (ESAs)
                              • Seismic/Zoning/Fannie/Freddie Reports

24 |   CBRE Q2 2021 SHMI
25             CBRE Property Tax
                Consulting Service

  Property taxes are one of the largest expenditures that
  effect a property’s bottom line; and they will likely
  continue to increase. Owners and investors of senior
  housing properties should be considering how best to
  address the growing challenge of increasing property tax
  assessments to their profitability. In most states, lien dates
  for assessment is January 1st, and adjustments for any
  possible COVID-19 related losses or interruptions were
  rejected by the tax assessor due to the onset of COVID in
  early March 2020; after the assessment date.

  Although the three approaches to value are used by most
  assessors; in many states; such as Texas and Georgia, the
  taxpayer is entitled to an equal and uniform assessment.
  By appealing an assessment and providing evidence
  showing that a property is not assessed in an equal and
  uniform manner to its competitive set, the assessor must
  consider the information even if the cost or income support
  a higher value. CBRE’s knowledge of the local market, as
  well as long standing relationships with the assessors has
  resulted in large savings in equal and uniform appeals.

  At CBRE, we achieve property and transaction tax savings
  and refunds for our clients by providing expert tax strategies
  while executing property and transaction tax appeals and
  abatements. We use our extensive scale and reach, state-
  of-the art technology and proven innovation processes to
  deliver quantifiable, results-driven property tax services.

  It is important to have a professional property tax
  consultant review your properties assessment and financial
  performance on an annual basis. Any loss of income or
  decline of occupancy due to COVID -19 during the 2020
  operating year should be reviewed in detail to determine
  if a property tax appeal is warranted in 2021.

  Typical Timeline for Tax Appeal Process (actual timeline
  varies depending on which county the property is located
  in):

       • January 1st- Assessment date
       • May 1st- Notices of Appraised Value are mailed
       • May 31st- Last day to file an appeal ( or 30 from
         Notice of Appraised Value)
       • May through July- Appraisal Review Board hearings

  CBRE’s tax experts can also assist the buyers during the
  transaction process by evaluating the likely impact of
  a sale transaction on the future property tax expenses,
  thereby minimizing any surprises that deviate from the
  underwritten expenses.

25 |   CBRE Q2 2021 SHMI
CBRE SENIOR HOUSING
 REPRESENTATIVE INVESTMENT PROPERTY
 TRANSACTIONS – 2015 FORWARD
 Today’s complex and constant changing market environments require special solutions. CBRE SH Team
 Members consistently achieve the highest sale price/best debt terms in the industry for their Clients.

 RECENT PORTFOLIO SALES TRANSACTIONS
               Sunwest Portfolio                      Vintage Portfolio                       The Maestro Portfolio
               $1.29 billion                          $1.29 billion                           $921,000,000
               National Portfolio                     Northern and Southern CA (21)           Alberta and Quebec, Canada
               11,096 IL/AL/MC units/beds             and Western WA (1)                      8,206 IL/AL/MC units/beds
               Client was The Blackstone Group        3,054 IL/AL/MC units                    Client was Maestro Funds
                                                      Client was Vintage Senior Living
                                                      and their private investors

               The Fountains Portfolio                Brightview I                           Programmatic Equity Raise
               $640.0 million                         $498,500,000                           $300,000,000
               National Portfolio                     National Portfolio                     National Portfolio
               (11 states)                            (5 States)                             Client was LCS
               3,637 IL/AL/MC and Entry Fee           1,584 IL/AL/MC units/beds
               CCRC units/beds                        Client was Affiliate of Prudential
               Client was Fountains Senior Living
                                                      Real Estate Investors
               Holdings, LLC
               Sunwest Managed Portfolio              Brightview II                          The Garden Empire Portfolio
               $364,250,000                           $363,500,000                           $307,500,000
               National Portfolio                     National Portfolio (3 States)          NJ and NY
               (11 states)                            1,117 IL/AL/MC units/beds              933 IL/AL/MC units/beds
                3,054 IL/AL/MC and Cottages           Client was an Affiliate of The         Client was an Affiliate of The
               Client was Sunwest                     Shelter Group                          Carlyle Group

               CCRC Portfolio                         Mid-Atlantic Portfolio                 MorningStar 4 Pack
               $186,500,000                           $186.2 million                         Confidential
               Dallas, TX                             Greater Baltimore, Maryland            CO, IA, NM and OR
               1,104 units                            (5) and Greater Washington,            415 IL/AL/MC units
               Client was LCS                         D.C. (2)                               Client was Confluent
                                                      526 AL/MC units
                                                      Client was an affiliate of Harrison
                                                      Street

               Five Allegro Communities               The Village 2 Pack                     Kronos FL 2 Pack
               $172,500,000                           $76,000,000                            $65,000,000
               FL and KY                              Dallas and Houston, TX                 Jacksonville & Stuart, FL
               705 IL/AL/MC/NC units/beds             224 IL/AL/MC units                     263 units
               Client was Almanac Realty              Client was HSRE/Bridgewood             Client was Kronos

 RECENT SINGLE ASSET SALES TRANSACTIONS
               MorningStar at RidgeGate               Parker Senior Living                   Renaissance on Peachtree
               $137,700,000                           $85,000,000                            $78,600,000
               Denver, CO                             Parker, CO                             Atlanta, GA
               224 IL/AL/MC units                     191 IL/AL/MC units/beds                229 IL/AL units/beds
               Client was AEW                         Client was Faestel Properties          Client was The Carlyle Group
                                                                                             and Formation Development

               Class A IL/AL Community                Watermark at Logan Square              Sunrise of Severna
               $77,000,000                            $72,500,000                            $72,000,000
               Scottsdale, AZ                         Philadelphia, PA                       Severna Park, MD
               216 IL/AL units/beds                   463 IL/AL/MC/SNF units                 156 IL/AL/MC units
               Client was Affiliate of Prudential     Client was Watermark Retirement        Client was Sunrise Senior Living
               Real Estate

26 |   CBRE Q2 2021 SHMI
RECENT SINGLE ASSET SALES TRANSACTIONS                     (CONT’D)

              The Village at Arboretum         The Village of Tanglewood        Meadowbrook
              $72,000,000                      $66,850,000                      $60,000,000
              Austin, TX                       Houston, TX                      Agoura Hills, CA
              172 IL units                     188 IL units                     156 IL/AL/MC units
              Client was BayNorth/             Client was BayNorth/Bridgewood   Client is Confidential
              Bridgewood JV                    JV

              Woodhaven                         MorningStar of Littleton        The MorningStar Portfolio
              $57,000,000                       $45,500,000                     $45,000,000
              Conroe, TX                        Littleton, CO                   Colorado Springs, CO
              157 IL/AL/MC units                85 AL/MC units                  112 AL/MC units
              Client was Padua Realty           Client was PREI/MSL JV          Client was Confluent
                                                                                Development/MorningStar
                                                                                Senior Living

              St. Andrew’s Village             Kennewick Campus                 Heritage Oaks
              $42,500,000                      $40,500,000                      $33,500,000
              Aurora, CO                       Kennewick, WA                    Englewood, FL
              (Greater Denver)                 138 IL/AL/MC units               118 AL/MC units
              246 CCRC units/beds              Client was Bourne Financial      Client was NAPCO Companies
              Client was RSF Partners

              The Solana Horsham               Cappella of Grand Junction
              $31,500,000                      Confidential
              Greater Philadelphia, PA         Grand Junction, CO
              76 AL/MC units                   66 AL/MC units
              Client was CSH/Formation-Shel-   Client was Confluent
              bourne Partners JV               Senior Living

27 |   CBRE Q2 2021 SHMI
28              CBRE Advantage
       CBRE Cap, the investment banking business of CBRE, provides independent M&A advisory, acts as a global
       placement agent, actively trades real estate LP secondary interests, and advises institutions on real estate
       investments. Lisa Widmier has been integrated into this practice to provide specialized investment banking
       services to clients in the senior housing industry.

                                              Portfolio   Public         Valuation/Fairness
                                               Sales      M&A                Opinions

                                     Recapitalizations                                    Financing

                                     Comingled                                            Buyside
                                     Fund Raising                                         Advisory

                                                           INV ESTMENT
                                                             BA NKING
                                     Joint Ventures                               Restructuring

                                                Direct                        Portfolio
                                              Secondary     Trading            Sales

               The CBRE platform uniquely combines the critical components for a successful outcome.

                          Highly Experienced Investment Banking Team
                          CBRE offers an experienced senior investment banking team with expertise in all forms of
                          capital raising and advisory. Our knowledge base provides the background to structure
                          an opportunity properly and react to change.

                          World Leading Asset Level Expertise
                          CBRE is a leader in real estate, senior housing, and local market knowledge. This
                          allows us to leverage expertise encompassing all aspects of real estate and to evaluate,
                          underwrite, and position assets and industry fundamentals to optimize outcomes.

                          Global Capital Distribution
                          CBRE has the market presence to access providers of real estate capital in all of the major
                          markets around the world. This capability is enhanced by constant investor dialogue,
                          global infrastructure, and a strong product pipeline, which enables us to utilize live
                          market intelligence to align investment capital targeted investment opportunities.

28 |   CBRE Q2 2021 SHMI
Today’s complex and constantly changing market environments require
                special solutions. The professionals at CBRE have the experience,
              knowledge, connections and track record to provide you with the best
                solutions in the marketplace and the ability and determination to
                                     execute those solutions.

                              CBRE SENIOR HOUSING
                    INVESTMENT BROKERAGE                              CONSULTING SERVICES
                       STRUCTURED DEBT                            VALUATION ADVISORY SERVICES
                     INVESTMENT BANKING                                ASSET MANAGEMENT

                   4301 LA JOLLA VILLAGE DR., SUITE 3000, LA JOLLA, CA 92122
             PLEASE VISIT OUR WEBSITE AT CBRE.COM/NATIONALSENIORHOUSING

© 2021 CBRE, Inc. All rights reserved. This information has been obtained from sources believed
reliable, but has not been verified for accuracy or completeness. You should conduct a careful,
independent investigation of the property and verify all information. Any reliance on this information
is solely at your own risk. CBRE and the CBRE logo are service marks of CBRE, Inc. All other marks
displayed on this document are the property of their respective owners, and the use of such logos
does not imply any affiliation with or endorsement of CBRE. Photos herein are the property of their
respective owners. Use of these images without the express written consent of the owner is prohibited.
You can also read