An Assessment of the American Housing and Economic Mobility Act of 2021
←
→
Page content transcription
If your browser does not render page correctly, please read the page content below
ANALYSIS
  APRIL 2021
                                             An Assessment of the American Housing and
                                             Economic Mobility Act of 2021
  Prepared by

  Mark Zandi
                                             INTRODUCTION
  Mark.Zandi@moodys.com
  Chief Economist                            The nation is struggling with an affordable housing crisis. There is not enough housing for sale
                                             or rent in communities across the country. This means families must pay more for their housing,
                                             renters have less to get by on at the end of the month, homeownership is out of reach for too
  Contact Us                                 many, and those of modest means are forced to live farther from decent jobs. This has significant
                                             economic and social repercussions. The American Housing and Economic Mobility Act of 2021
  Email
                                             would help address this mounting housing crisis.
  help@economy.com

  U.S./Canada
  +1.866.275.3266

  EMEA
  +44.20.7772.5454 (London)
  +420.224.222.929 (Prague)

  Asia/Pacific
  +852.3551.3077

  All Others
  +1.610.235.5299

  Web
  www.economy.com
  www.moodysanalytics.com

MOODY’S ANALYTICS        An Assessment of the American Housing and Economic Mobility Act of 2021                                         1
An Assessment of the American Housing and
Economic Mobility Act of 2021
BY MARK ZANDI
T
he nation is struggling with an affordable housing crisis.1 There is not enough housing for sale or rent in
communities across the country. This means families must pay more for their housing, renters have less to
get by on at the end of the month, homeownership is out of reach for too many, and those of modest means
are forced to live farther from decent jobs. This has significant economic and social repercussions. The American
Housing and Economic Mobility Act of 2021 would help address this mounting housing crisis.2
Affordable housing crisis sale that is unoccupied has fallen sharply those that become obsolete, and second and
Homebuilding collapsed during the hous- since the housing crash and is now as low as vacation homes. Trend demand abstracts
ing crash over a decade ago and has been it has been in more than 30 years (see Chart from the near-term temporary ups and
slow to recover. Construction of high-end 1). The shortfall in affordable housing is close downs in demand.
homes and apartments recovered first, and to an estimated 1.8 million homes, equal to Even these figures understate the severity
there is now an oversupply in some urban more than a year of new construction at its of the problem. The lion’s share of the under-
areas across the country. However, the con- current pace. supply is concentrated in the lower end of the
struction of affordable housing—homes rea- And this housing shortage continues to market, particularly in areas that offer signifi-
sonably priced for lower-income households get worse. The current annual supply of new cant economic opportunity, driving up house
to rent or own—has only recently begun to housing units is still running an estimated prices and rents for low- and moderate-in-
increase and continues to lag demand. 100,000 below the trend for new-housing come families precisely where they want to
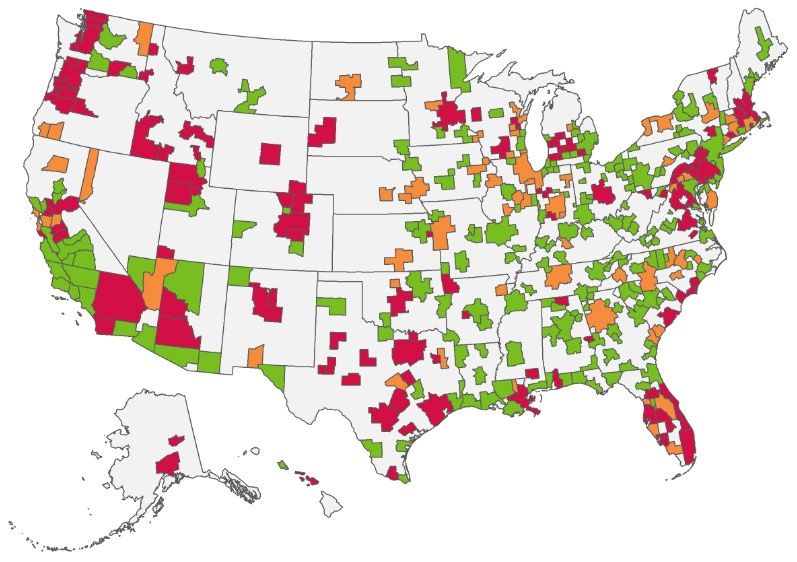
The worsening affordable housing short- demand. Total supply equals new single- and live (see Chart 2).3 Prices for homes sold in
age is clear in the low number of vacant multifamily units and manufactured homes, the bottom quartile are up nearly 8% per
housing units, which continues to decline. and trend housing demand equals household annum over the past decade, almost double
The percent of the housing stock for rent and formations, new homes needed to replace that for homes in the top quartile. And rents
Chart 1: Plunging Vacancy Rate Chart 2: Shortages Across the Country
Vacancy rate for homes for sale and rent, 4-qtr MA, %
5.0
Current housing supply 1,700,000
4.5 Single-family 1,200,000
Multifamily 400,000
4.0 Manufactured 100,000
Adequately supplied
3.5 Undersupplied
3.0 Severely
Trend housing demand 1,800,000
Household 1,200,000 undersupplied
2.5 Obsolescence 400,000
Second homes 200,000
2.0
65 70 75 80 85 90 95 00 05 10 15 20
Sources: Census Bureau, Moody’s Analytics Sources: Census Bureau, Moody’s Analytics
March 2021 1 March 2021 2
MOODY’S ANALYTICS An Assessment of the American Housing and Economic Mobility Act of 2021 2decade ago, builders While prices of many building materials
Chart 3: Increased Congestion
put up only 600,000 have risen in recent years, the rise in soft-
Hrs of traffic delay per person, 2005=100
homes per year. New wood lumber prices has been especially
140
construction today dramatic, up close to 10% per annum since
135 DC
Dallas is approaching 1.7 the housing bust and nearly double over
130
Atlanta million units. Yet the past year alone.7 The higher material
125 Chicago much of the increase costs reflect a range of factors, most recent
120 San Francisco
Seattle in homebuilding has being the disruption of global supply chains
115
Phoenix been at the high during the pandemic and the Trump admin-
110
end of the housing istration’s imposition of higher tariffs and
105
market. Demand greater trade restrictions on most major U.S.
100
by higher-income trading partners.
95
05 06 07 08 09 10 11 12 13 14 15 16 17
households recov- Homebuilders have also struggled in
Sources: Texas A&M, Moody’s Analytics
ered more quickly recent years to develop and maintain a con-
from the recession, sistent labor force, reflecting the difficulty
and the higher house that many of the trades face in attracting
March 2021 3
for those families who rent because they prices and rents builders could charge these high school graduates into careers requiring
cannot afford to own, rather than by choice, households have been a strong incentive to specialized skills. Prior to the financial crisis,
have increased nearly 4% per annum over the build more. this labor gap was largely being filled by
past decade—a trend that has continued even Construction of affordable housing— immigrants. But, just as housing demand
during the pandemic. homes that low- and moderate-income began to warrant ramping up housing supply
The rising rents leave more and more households can afford to rent or buy—has again, the Trump administration all but shut
renters with little to live on. Today, one in been much slower to bounce back. The story down this source of labor through restrictive
four renters pays over half of their monthly is one of demand and profit margins. Low- immigration policies. Labor cost pressures
income toward rent, leaving barely enough and moderate-income households were have eased a bit during the pandemic, but
to cover food, clothing and healthcare, much slower to recover from the recession, this appears temporary and will almost sure-
much less save for emergencies or build only hitting their economic stride again in ly worsen again if there is a large federally
wealth. The typical renter saves less than the year or two before the pandemic. And the financed infrastructure effort.8
$500 a year, not enough to cover run-of- profit margins that builders could get from As the cost of materials and labor has
the-mill financial emergencies let alone building affordable housing have been too gone up, builders’ access to financing has
save for a down payment on a home. And low to incent the investment, with pricing gone down. Bank acquisition development
the rise in house prices is putting the too low to adequately clear the high fixed and construction lending is an especially
economic opportunity of homeownership costs of building. important source of financing for smaller
out of reach for more and more families, The economics of building affordable builders who often do not have ready access
particularly those of color. Today the housing have improved more recently, with to other forms of financing.9 Yet banks have
homeownership rate for Hispanics is 48% skyrocketing house prices and rents final- been pulling back on these loans since the fi-
and for Blacks it is 42%, a level not seen ly creating a wide enough profit margin nancial crisis and show little signs of expand-
in decades.4 to justify more investment. But the fact ing them again. The retreat has been stron-
The housing shortfall is not just depress- that the economics of building affordable gest for smaller banks that cater to smaller
ing savings and increasing the wealth gap. housing are still precarious and appear to builders. This constrains supply at the lower
It is also forcing those at the bottom of the require pricing that is not affordable for end of the housing market, where smaller
economic ladder to live farther away from many homebuyers and renters, especially builders often focus.
those at the top and, more importantly, far- as mortgage rates normalize on the other The most significant impediment to build-
ther from economic opportunity. The most side of the pandemic, indicates the prob- ing more affordable housing is the availability
desirable cities are becoming affordable lem remains acute.5 and cost of land. There simply is not enough
only to the wealthy, while many of those of Meanwhile, the constraints on building buildable land to meet the demand in many
more modest means are forced into longer affordable housing units, including building areas, and the costs associated with securing
commutes, creating more traffic, more envi- materials and labor, lending, and land, re- and developing the land that is available too
ronmental strain, and greater social division main significant. These are key inputs into often push builders’ total costs above what
(see Chart 3). building a home, and they have all been they could get from the sale of an affordable
in short supply since the financial crisis, property. The cost of land has soared to an
Homebuilding constraints driving up their cost and reducing builders’ estimated 55% of the total price of the medi-
Homebuilders have steadily increased profit margins and thus their incentive an-priced home nationwide, and upwards of
production of new housing since the housing to put up more homes, particularly low- 70% in high-opportunity areas such as Seat-
crash. During the worst of the downturn a er-priced housing with lower margins.6 tle and San Francisco (see Chart 4).10
MOODY’S ANALYTICS An Assessment of the American Housing and Economic Mobility Act of 2021 3Housing and economic impact
Chart 4: Land Costs Soar Current combined
Land share of house price, %
funding is several The Moody’s Analytics model of the U.S.
hundred million economy is simulated to determine the im-
80
75 2012 2020 dollars a year based pact of the expansion of the HTF and CMF in
70 on a fee charged the American Housing and Economic Mobili-
65 on loans purchased ty Act on housing and the economy.
60
55 by Fannie Mae and The simulation is based on several as-
50 Freddie Mac. The sumptions, including that the legislation be-
45
40 HTF provides funds comes law later this year and takes effect in
35 to state housing 2022. It also assumes there are no other fiscal
30 authorities for the policy changes other than what are in current
25
20 development of af- law and that monetary policy is endoge-
U.S. Atlanta Baltimore Chicago Pittsburgh Seattle San Fran. fordable rental units. nously determined—the model is used to
Sources: CoreLogic, Engineering News Record, Moody’s Analytics Housing authorities determine how the Federal Reserve manages
March 2021 4
have flexibility in al- short-term interest rates and its quantitative
locating these funds, easing program.
American Housing and Economic since each has different objectives and goals Another important assumption is that it
Mobility Act based on the needs of the local population. will cost close to $200,000 to produce a typ-
The American Housing and Econom- The CMF provides funds to Community ical affordable housing unit in 2022. This is
ic Mobility Act provides just over $500 Development Financial Institutions and consistent with the cost to produce a unit in
billion in federal support over the next other nonprofit developers for increasing a Low-Income Housing Tax Credit project. We
decade to alleviate the shortage of af- the supply of affordable housing. CDFIs are expect that cost to increase more than 3%
fordable housing units (see Table 1). This mission-driven financial institutions that per annum in the next several years, given the
is done through funds to incent localities provide financing for development in un- strengthening economy and ongoing global
to ease regulations and other building re- derserved communities. The HTF and CMF supply chain problems, and to moderate
strictions and provide down payment as- have the flexibility necessary to significantly closer to 2% growth by the second half of the
sistance to lower-income first-time home- increase the supply of affordable housing in 2020s, consistent with overall price inflation.
buyers living in low-income communities. real estate markets encumbered by a range Given the magnitude of the increase in
Most significantly, the funds are to be of complex and costly problems. funding for the HTF and CMF, Moody’s An-
used to scale up the Housing Trust Fund The American Housing and Economic Mo- alytics assumes it will take several years to
and Capital Magnet Fund. The plan is paid bility Act is designed to be deficit neutral on a get these programs up to full speed. Each will
for by scaling back estate tax exemptions dynamic basis over the 10-year budget hori- need some time to expand its infrastructure
and other reforms.11 zon. The costs of these affordable housing ini- for evaluating uses of the increased funds and
The HTF and CMF were established by tiatives are paid for by reforms to the estate disbursing them effectively. The American
the 2008 Housing and Economic Recovery tax, most importantly by rolling back estate Housing and Economic Mobility Act does
Act, but funding began only a few years ago. tax exemptions to their 2009 levels. not change current law with regard to how
Table 1: Economic Impact of American Housing and Economic Mobility Act of 2021
Annual spending, $ bil Additional affordable housing units
Housing Trust Fund Capital Magnet Total Housing Trust Fund Capital Magnet Total Additional jobs
2022 34.5 0.4 42.2 171,969 13,957 222,351 300,301
2023 40.0 0.9 41.0 193,953 30,548 224,986 303,860
2024 43.0 1.7 44.8 203,415 56,294 260,181 351,394
2025 44.5 3.0 47.6 205,778 97,108 303,348 409,695
2026 46.0 3.1 49.2 208,135 98,185 306,773 414,319
2027 47.0 3.1 50.2 208,286 96,166 304,895 411,783
2028 47.5 3.2 50.8 206,172 97,226 303,832 410,348
2029 47.5 3.2 50.8 202,129 95,320 297,875 402,302
2030 47.5 3.2 50.8 198,166 93,451 292,034 394,414
2031 47.5 3.2 50.8 194,280 91,618 286,308 386,680
2022-2031 445.0 25.0 478.2 1,992,282 769,873 2,802,582
Note: Total includes the HTF, CMF, and various other smaller programs in the legislation.
Source: Moody’s Analytics
MOODY’S ANALYTICS An Assessment of the American Housing and Economic Mobility Act of 2021 4the HTF and CMF operate. Under current the legislation, rents are expected to increase holds to move closer to their employment
law, at least 70% of CMF funds must be used by approximately 4% per annum. With the or potential jobs. The housing shortage and
to support affordable housing projects, and legislation, rent growth will be near 3% per erosion in affordability are constraining the
no more than 10% of an affordable housing annum. A decade from now, affordable rents ability of low-income households to take the
project’s costs can come from the CMF. These will be approximately 10% lower than they record number of open job positions that are
and other rules under current law slow the are today, or about $100 per month in to- currently available in places where housing
disbursement of funds and are key to why it day’s dollars. is simply too expensive. Affordability is also
takes several years to ramp up the production More housing construction will increase forcing low-income workers to live farther
of affordable housing. the economy’s growth rate and the number away from their work, requiring long and
Under the legislation, our model shows of jobs as activity increases. In 2022, the costly commutes and reducing productivity.
that affordable housing construction in- increased housing construction will lift em-
creases by close to 225,000 units in 2022, ployment by 250,000 jobs and by as much as Conclusions
increasing to over 300,000 units annually by 400,000 jobs at the peak of the impact in the More than a decade after the housing
mid-decade. Over the 10-year budget horizon mid-2020s. crash and financial crisis, the nation is still
through 2031, affordable housing production There is very little impact on the econ- suffering a housing crisis. A decade ago, the
increases by 280,000 units per annum on omy and jobs from the scaling back of the problem was egregious mortgage lending and
average. This would more than fill the current estate tax exemptions and other reforms. The overbuilding. Today, it is a mounting lack of
shortfall in annual affordable housing con- wealthy households that will pay more in es- affordable housing. Low-income and minority
struction and would at worst quell the afford- tate taxes have substantial financial resources households are struggling to make their rent
able housing crisis by the end of the decade. and will not significantly change their spend- and mortgage payments, suffering through
The crisis should come to an end even sooner ing and saving behavior. Moreover, since the increasingly long commutes, and unable to
if market forces continue to support more increased tax revenues pay for the expansion take better jobs because they cannot afford
construction, which is likely if the American of the HTF and CMF and other programs, it housing near the available work. The Amer-
Housing and Economic Mobility Act eases ensures that the American Housing and Eco- ican Housing and Economic Mobility Act
regulatory restrictions on affordable home- nomic Mobility Act is deficit neutral, with no would help to address these problems. It is
building as anticipated. resulting impact on interest rates. fiscally responsible legislation that empowers
Since the legislation significantly increases This simulation likely understates the programs that are already in place and shown
housing supply, it will have the added benefit economic benefit of the legislation, because to be effective in meeting the challenges of
of improving housing affordability, particu- it does not consider that the measure will providing affordable housing to low-income
larly for affordable rental homes. Without facilitate the ability of low-income house- households and underserved communities.
MOODY’S ANALYTICS An Assessment of the American Housing and Economic Mobility Act of 2021 5Endnotes 1 This white paper relies heavily on “Overcoming the Nation’s Daunting Housing Supply Shortage,” Parrott and Zandi, Urban Institute and Moody’s Analytics white paper, March 2021. 2 Massachusetts Senator Elizabeth Warren initially introduced the American Housing and Economic Mobility Act in September 2018. Moody’s Analytics evaluated the economic impact of this legislation in “Addressing the Affordable Housing Crisis,” Mark Zandi, Moody’s Analytics white paper, September 2018. The currently proposed legislation, the American Housing and Economic Mobility Act of 2021, makes only small chang- es to the 2018 legislation. Our economic analysis of the 2021 legislation shows somewhat lower new housing production than in the analysis we did of the 2018 legislation due to the significant increase in housing construction costs over the past several years. However, the estimated employment impacts of the 2021 legislation are meaningfully less than those estimated in 2018 because of different assumptions concerning the mix of new single- and multifamily homes that will be constructed due to the legislation. We now expect the construction of substantially more multifamily units, which results in just over one full-time equivalent job, and fewer single-family homes, which supports closer to three full-time equivalents. The change in our estimated employment impacts is not due to a change in the legislation, but a change in the assump- tions underpinning our analysis. 3 See “Housing Constraints and Spatial Misallocation,” Hsieh and Moretti, American Economic Journal: Macroeconomics, 2019. 4 These homeownership rates are for 2019 from the Census Bureau’s Housing Vacancy Survey. The HVS for 2020 has significant measurement problems due to the pandemic. 5 In an economy operating at full employment and with inflation at the Federal Reserve’s 2% target, fixed mortgage rates will be near 5.5%. 6 The National Association of Home Builders’ 2019 Construction Cost Survey provides a good breakdown of the costs involved in building a typical single-family home. 7 This is for the producer price index for softwood lumber from the Bureau of Labor Statistics. Random Lengths data indicate that softwood lumber prices are up even more, from $350 per thousand board feet in April 2020 to $1,040 in March 2021. The National Association of Home Builders estimates this has added $24,000 to the price of a typical home. 8 This is based on the employment cost index for construction workers from the Bureau of Labor Statistics. 9 This includes one- to four-family residential construction loans and land development loans from the FDIC. 10 We estimate land values and the land share of house price across metropolitan areas based on data from the FHFA, CoreLogic, and the Engineering News Record. The FHFA land value methodology and estimates are available from “The Price of Residential Land for Counties, ZIP codes, and Census Tracts in the United States,” Larson, Shui, Davis and Oliner, FHFA working paper, November 2020. 11 To be more precise, the American Housing and Economic Mobility Act of 2021 is deficit neutral over the 10-year budget horizon on a dynamic basis, which accounts for the benefit of the plan on the economy and thus on the government’s finances. MOODY’S ANALYTICS An Assessment of the American Housing and Economic Mobility Act of 2021 6
About the Author
Mark Zandi is chief economist of Moody’s Analytics, where he directs economic research. Moody’s Analytics, a subsidiary of Moody’s Corp., is a leading provider of eco-
nomic research, data and analytical tools. Dr. Zandi is a cofounder of Economy.com, which Moody’s purchased in 2005.
Dr. Zandi is on the board of directors of MGIC, the nation’s largest private mortgage insurance company, and is the lead director of Reinvestment Fund, one of the nation’s
largest community development financial institutions, which makes investments in underserved communities.
He is a trusted adviser to policymakers and an influential source of economic analysis for businesses, journalists and the public. Dr. Zandi frequently testifies before
Congress and conducts regular briefings on the economy for corporate boards, trade associations, and policymakers at all levels. He is often quoted in national and global
publications and interviewed by major news media outlets, and is a frequent guest on CNBC, NPR, Meet the Press, CNN, and various other national networks and news
programs.
Dr. Zandi is the author of Paying the Price: Ending the Great Recession and Beginning a New American Century, which provides an assessment of the monetary and fiscal poli-
cy response to the Great Recession. His other book, Financial Shock: A 360º Look at the Subprime Mortgage Implosion, and How to Avoid the Next Financial Crisis, is described
by the New York Times as the “clearest guide” to the financial crisis.
Dr. Zandi earned his BS from the Wharton School at the University of Pennsylvania and his PhD at the University of Pennsylvania.

MOODY’S ANALYTICS            An Assessment of the American Housing and Economic Mobility Act of 2021                                                                   7
About Moody’s Analytics
Moody’s Analytics provides financial intelligence and analytical tools supporting our clients’ growth, efficiency
and risk management objectives. The combination of our unparalleled expertise in risk, expansive information
resources, and innovative application of technology helps today’s business leaders confidently navigate an
evolving marketplace. We are recognized for our industry-leading solutions, comprising research, data, software
and professional services, assembled to deliver a seamless customer experience. Thousands of organizations
worldwide have made us their trusted partner because of our uncompromising commitment to quality, client
service, and integrity.

Concise and timely economic research by Moody’s Analytics supports firms and policymakers in strategic planning, product
and sales forecasting, credit risk and sensitivity management, and investment research. Our economic research publications
provide in-depth analysis of the global economy, including the U.S. and all of its state and metropolitan areas, all European
countries and their subnational areas, Asia, and the Americas. We track and forecast economic growth and cover specialized
topics such as labor markets, housing, consumer spending and credit, output and income, mortgage activity, demographics,
central bank behavior, and prices. We also provide real-time monitoring of macroeconomic indicators and analysis on timely
topics such as monetary policy and sovereign risk. Our clients include multinational corporations, governments at all levels,
central banks, financial regulators, retailers, mutual funds, financial institutions, utilities, residential and commercial real
estate firms, insurance companies, and professional investors.

Moody’s Analytics added the economic forecasting firm Economy.com to its portfolio in 2005. This unit is based in West Chester
PA, a suburb of Philadelphia, with offices in London, Prague and Sydney. More information is available at www.economy.com.

Moody’s Analytics is a subsidiary of Moody’s Corporation (NYSE: MCO). Further information is available at
www.moodysanalytics.com.

DISCLAIMER: Moody’s Analytics, a unit of Moody’s Corporation, provides economic analysis, credit risk data and insight,
as well as risk management solutions. Research authored by Moody’s Analytics does not reflect the opinions of Moody’s
Investors Service, the credit rating agency. To avoid confusion, please use the full company name “Moody’s Analytics”, when
citing views from Moody’s Analytics.

                                          About Moody’s Corporation
Moody’s Analytics is a subsidiary of Moody’s Corporation (NYSE: MCO). MCO reported revenue of $4.8 billion in 2019,
employs more than 11,000 people worldwide and maintains a presence in more than 40 countries. Further information
about Moody’s Analytics is available at www.moodysanalytics.com.
© 2021 Moody’s Corporation, Moody’s Investors Service, Inc., Moody’s Analytics, Inc. and/or their licensors and affiliates (collectively, “MOODY’S”). All rights reserved. CREDIT RATINGS ISSUED BY MOODY’S CREDIT RATINGS AFFILIATES ARE THEIR CURRENT OPINIONS OF THE RELATIVE FUTURE CREDIT RISK OF ENTITIES, CREDIT COMMITMENTS, OR DEBT OR DEBT-LIKE SECURITIES, AND MATERIALS, PRODUCTS, SERVICES AND INFORMATION PUBLISHED BY MOODY’S (COLLECTIVELY, “PUBLICATIONS”) MAY INCLUDE SUCH CURRENT OPINIONS. MOODY’S DEFINES CREDIT RISK AS THE RISK THAT AN ENTITY MAY NOT MEET ITS CONTRACTUAL FINANCIAL OBLIGATIONS AS THEY COME DUE AND ANY ESTIMATED FINAN- CIAL LOSS IN THE EVENT OF DEFAULT OR IMPAIRMENT. SEE APPLICABLE MOODY’S RATING SYMBOLS AND DEFINITIONS PUBLICATION FOR INFORMATION ON THE TYPES OF CONTRACTUAL FINANCIAL OBLIGATIONS ADDRESSED BY MOODY’S CREDIT RATINGS. CREDIT RATINGS DO NOT ADDRESS ANY OTHER RISK, INCLUDING BUT NOT LIMITED TO: LIQUIDITY RISK, MARKET VALUE RISK, OR PRICE VOLATILITY. CREDIT RATINGS, NON-CREDIT ASSESSMENTS (“ASSESSMENTS”), AND OTHER OPINIONS INCLUDED IN MOODY’S PUBLICATIONS ARE NOT STATE- MENTS OF CURRENT OR HISTORICAL FACT. MOODY’S PUBLICATIONS MAY ALSO INCLUDE QUANTITATIVE MODEL-BASED ESTIMATES OF CREDIT RISK AND RELATED OPINIONS OR COMMENTARY PUBLISHED BY MOODY’S ANALYTICS, INC. AND/OR ITS AFFILIATES. MOODY’S CREDIT RATINGS, ASSESSMENTS, OTHER OPINIONS AND PUBLICATIONS DO NOT CONSTITUTE OR PROVIDE INVESTMENT OR FINANCIAL ADVICE, AND MOODY’S CREDIT RATINGS, ASSESSMENTS, OTHER OPINIONS AND PUBLICATIONS ARE NOT AND DO NOT PROVIDE REC- OMMENDATIONS TO PURCHASE, SELL, OR HOLD PARTICULAR SECURITIES. MOODY’S CREDIT RATINGS, ASSESSMENTS, OTHER OPINIONS AND PUBLICATIONS DO NOT COMMENT ON THE SUITABILITY OF AN INVESTMENT FOR ANY PARTICULAR INVESTOR. MOODY’S ISSUES ITS CREDIT RATINGS, ASSESSMENTS AND OTHER OPINIONS AND PUBLISHES ITS PUBLICATIONS WITH THE EXPECTATION AND UNDERSTAND- ING THAT EACH INVESTOR WILL, WITH DUE CARE, MAKE ITS OWN STUDY AND EVALUATION OF EACH SECURITY THAT IS UNDER CONSID- ERATION FOR PURCHASE, HOLDING, OR SALE. MOODY’S CREDIT RATINGS, ASSESSMENTS, OTHER OPINIONS, AND PUBLICATIONS ARE NOT INTENDED FOR USE BY RETAIL INVESTORS AND IT WOULD BE RECKLESS AND INAPPROPRIATE FOR RETAIL INVESTORS TO USE MOODY’S CREDIT RATINGS, ASSESSMENTS, OTHER OPINIONS OR PUBLICATIONS WHEN MAKING AN INVESTMENT DECISION. IF IN DOUBT YOU SHOULD CONTACT YOUR FINANCIAL OR OTHER PROFES- SIONAL ADVISER. ALL INFORMATION CONTAINED HEREIN IS PROTECTED BY LAW, INCLUDING BUT NOT LIMITED TO, COPYRIGHT LAW, AND NONE OF SUCH IN- FORMATION MAY BE COPIED OR OTHERWISE REPRODUCED, REPACKAGED, FURTHER TRANSMITTED, TRANSFERRED, DISSEMINATED, REDISTRIB- UTED OR RESOLD, OR STORED FOR SUBSEQUENT USE FOR ANY SUCH PURPOSE, IN WHOLE OR IN PART, IN ANY FORM OR MANNER OR BY ANY MEANS WHATSOEVER, BY ANY PERSON WITHOUT MOODY’S PRIOR WRITTEN CONSENT. MOODY’S CREDIT RATINGS, ASSESSMENTS, OTHER OPINIONS AND PUBLICATIONS ARE NOT INTENDED FOR USE BY ANY PERSON AS A BENCH- MARK AS THAT TERM IS DEFINED FOR REGULATORY PURPOSES AND MUST NOT BE USED IN ANY WAY THAT COULD RESULT IN THEM BEING CONSIDERED A BENCHMARK. All information contained herein is obtained by MOODY’S from sources believed by it to be accurate and reliable. Because of the possibility of human or mechanical error as well as other factors, however, all information contained herein is provided “AS IS” without warranty of any kind. MOODY’S adopts all necessary measures so that the information it uses in assigning a credit rating is of sufficient quality and from sources MOODY’S considers to be reliable including, when appropriate, independent third-party sources. However, MOODY’S is not an auditor and cannot in every instance indepen- dently verify or validate information received in the rating process or in preparing its Publications. To the extent permitted by law, MOODY’S and its directors, officers, employees, agents, representatives, licensors and suppliers disclaim liability to any person or entity for any indirect, special, consequential, or incidental losses or damages whatsoever arising from or in connection with the information contained herein or the use of or inability to use any such information, even if MOODY’S or any of its directors, officers, employees, agents, representatives, licensors or suppliers is advised in advance of the possibility of such losses or damages, including but not limited to: (a) any loss of present or prospective profits or (b) any loss or damage arising where the relevant financial instrument is not the subject of a particular credit rating assigned by MOODY’S. To the extent permitted by law, MOODY’S and its directors, officers, employees, agents, representatives, licensors and suppliers disclaim liability for any direct or compensatory losses or damages caused to any person or entity, including but not limited to by any negligence (but excluding fraud, will- ful misconduct or any other type of liability that, for the avoidance of doubt, by law cannot be excluded) on the part of, or any contingency within or beyond the control of, MOODY’S or any of its directors, officers, employees, agents, representatives, licensors or suppliers, arising from or in connection with the information contained herein or the use of or inability to use any such information. NO WARRANTY, EXPRESS OR IMPLIED, AS TO THE ACCURACY, TIMELINESS, COMPLETENESS, MERCHANTABILITY OR FITNESS FOR ANY PARTICULAR PURPOSE OF ANY CREDIT RATING, ASSESSMENT, OTHER OPINION OR INFORMATION IS GIVEN OR MADE BY MOODY’S IN ANY FORM OR MAN- NER WHATSOEVER. Moody’s Investors Service, Inc., a wholly-owned credit rating agency subsidiary of Moody’s Corporation (“MCO”), hereby discloses that most issuers of debt securities (including corporate and municipal bonds, debentures, notes and commercial paper) and preferred stock rated by Moody’s Investors Ser- vice, Inc. have, prior to assignment of any credit rating, agreed to pay to Moody’s Investors Service, Inc. for credit ratings opinions and services rendered by it fees ranging from $1,000 to approximately $5,000,000. MCO and Moody’s Investors Service also maintain policies and procedures to address the independence of Moody’s Investors Service credit ratings and credit rating processes. Information regarding certain affiliations that may exist between directors of MCO and rated entities, and between entities who hold credit ratings from Moody’s Investors Service and have also publicly reported to the SEC an ownership interest in MCO of more than 5%, is posted annually at www.moodys.com under the heading “Investor Relations — Corporate Governance — Director and Shareholder Affiliation Policy.” Additional terms for Australia only: Any publication into Australia of this document is pursuant to the Australian Financial Services License of MOODY’S affiliate, Moody’s Investors Service Pty Limited ABN 61 003 399 657AFSL 336969 and/or Moody’s Analytics Australia Pty Ltd ABN 94 105 136 972 AFSL 383569 (as applicable). This document is intended to be provided only to “wholesale clients” within the meaning of section 761G of the Corpora- tions Act 2001. By continuing to access this document from within Australia, you represent to MOODY’S that you are, or are accessing the document as a representative of, a “wholesale client” and that neither you nor the entity you represent will directly or indirectly disseminate this document or its contents to “retail clients” within the meaning of section 761G of the Corporations Act 2001. MOODY’S credit rating is an opinion as to the creditwor- thiness of a debt obligation of the issuer, not on the equity securities of the issuer or any form of security that is available to retail investors. Additional terms for Japan only: Moody’s Japan K.K. (“MJKK”) is a wholly-owned credit rating agency subsidiary of Moody’s Group Japan G.K., which is wholly-owned by Moody’s Overseas Holdings Inc., a wholly-owned subsidiary of MCO. Moody’s SF Japan K.K. (“MSFJ”) is a wholly-owned credit rating agency subsidiary of MJKK. MSFJ is not a Nationally Recognized Statistical Rating Organization (“NRSRO”). Therefore, credit ratings assigned by MSFJ are Non-NRSRO Credit Ratings. Non-NRSRO Credit Ratings are assigned by an entity that is not a NRSRO and, consequently, the rated obligation will not qualify for certain types of treatment under U.S. laws. MJKK and MSFJ are credit rating agencies registered with the Japan Financial Services Agency and their registration numbers are FSA Commissioner (Ratings) No. 2 and 3 respectively. MJKK or MSFJ (as applicable) hereby disclose that most issuers of debt securities (including corporate and municipal bonds, debentures, notes and com- mercial paper) and preferred stock rated by MJKK or MSFJ (as applicable) have, prior to assignment of any credit rating, agreed to pay to MJKK or MSFJ (as applicable) for credit ratings opinions and services rendered by it fees ranging from JPY125,000 to approximately JPY550,000,000. MJKK and MSFJ also maintain policies and procedures to address Japanese regulatory requirements.
You can also read