CLINICAL OUTCOMES ASSESSMENT
←
→
Page content transcription
If your browser does not render page correctly, please read the page content below
VALUE IN HEALTH 15 (2012) 158 –166

                                              Available online at www.sciencedirect.com

                                          journal homepage: www.elsevier.com/locate/jval

CLINICAL OUTCOMES ASSESSMENT
Modeling the Effects of H1N1 Influenza Vaccine Distribution in the
United States
Richard C. Larson, PhD1,2,*, Anna Teytelman3
1
Engineering Systems Division (ESD), Massachusetts Institute of Technology, Cambridge, MA, USA; 2Center for Engineering Systems Fundamentals (CESF),
Massachusetts Institute of Technology, Cambridge, MA, USA; 3Operations Research Center (ORC), Massachusetts Institute of Technology, Cambridge, MA, USA

A B S T R A C T

Objective: We analyzed the effects of the timing of vaccine distribu-            the administration of vaccine. Results: Southern states experienced
tion in 11 US states during the 2009 H1N1 influenza pandemic. Meth-              peak infection several weeks before northern states, and most of the
ods: By using reported data on the fraction of patients presenting with          vaccine was delivered well after the peak of the southern flu wave. Our
flu-related symptoms, we developed a transformation that allowed es-             models suggest that the vaccine had minimal ameliorative impact in
timation of the state-specific temporal flu wave curve, representing the         the southern states and measurable positive impact in the northern
number of new infections during each week. We also utilized data                 states. Vaccine delivery after peak also results in a smaller fraction of
describing the weekly numbers of vaccine doses delivered and admin-              the population’s seeking the vaccine. Conclusions: Our analysis sug-
istered. By using a simple difference equations model of flu progres-            gests that current Centers for Disease Control and Prevention policy of
sion, we developed two influenza wave curves: first, an “observable”             allocating flu vaccine over time in direct proportion to states’ popula-
curve that included the beneficial effects of vaccinations, and second,          tions may not be best in terms of averting nationally the maximum
an unobservable curve that depicted how the flu would have pro-                  possible number of infections.
gressed with no vaccine administered. We fit the observable curve to             Keywords: H1N1, influenza, pandemic reaction, vaccine availability,
match the estimated epidemic curve and early exponential growth as-              vaccine distribution.
sociated with R0, the reproductive number. By comparing the number               Copyright © 2012, International Society for Pharmacoeconomics and
of infections in each scenario, we estimated the infections averted by           Outcomes Research (ISPOR). Published by Elsevier Inc.

                                                                                 some states were able to vaccinate a significant portion of their
Introduction                                                                     population prior to the major flu wave’s hitting, while others did
The novel H1N1 influenza virus surfaced in San Diego in early                    not receive vaccines until the major flu wave had already passed
April 2009 and very soon thereafter in Mexico and was announced                  and interest in vaccinations had waned. Vaccine distribution
as a pandemic by the World Health Organization in June 2009 [1,2].               within individual states was significantly more complicated be-
By early fall, most of the world was experiencing the wave of the                cause states had relative freedom in utilizing the vaccines shipped
H1N1 pandemic [3]. The US Centers for Disease Control and Pre-                   from the CDC. We refer the reader to Hopkins [6] for an in-depth
vention (CDC) took the threat of a pandemic seriously, and by the                analysis of the different approaches taken by states and the chal-
middle of April 2009, researchers began to develop vaccines                      lenges faced during the H1N1 pandemic.
matched to the new virus [1]. The vaccine production process for a                   In this article, we present analysis of specific states’ epidemic
novel flu strain requires at least 6 months for virus identification,            curves and the relative effectiveness of vaccine programs. The
vaccine invention, and then mass production using a long-stand-                  essential analytical issue we faced was estimating the epidemic
ing egg-based technology. The inherent delays resulted in the first              flu curve in the absence of vaccine when the information we had was
vaccines’ being shipped in early October 2009 [4]. The vaccine had               limited and was available only for the presence of vaccine. For
varying ameliorative effects in different regions of the United                  most states, readily available information includes only the per-
States. Partly because of early school openings in the southeast [5],            centage of all hospitalizations and outpatient visits that were
the major wave of the outbreak hit the southeastern states earlier               caused by influenza-like illness (ILI) [7]. The results of our analysis
than the northern ones. Nonetheless, vaccines as produced were                   in this article suggest the importance of administering vaccination
delivered to states strictly on a per capita basis [4], with each state          as early as possible, even if the numbers of vaccines administered
receiving vaccine in direct proportion to its population. As a result,           are small. Early administration not only serves to decrease the

   Conflicts of interest: The authors have no conflicts of interest to report.
   * Address correspondence to: Richard C. Larson, Center for Engineering Systems Fundamentals (CESF), Massachusetts Institute of Tech-
nology, 77 Massachusetts Avenue, Building E40-233, Cambridge, MA 02139, USA.
   E-mail: rclarson@mit.edu.
1098-3015/$36.00 – see front matter Copyright © 2012, International Society for Pharmacoeconomics and Outcomes Research (ISPOR).
Published by Elsevier Inc.
doi:10.1016/j.jval.2011.07.014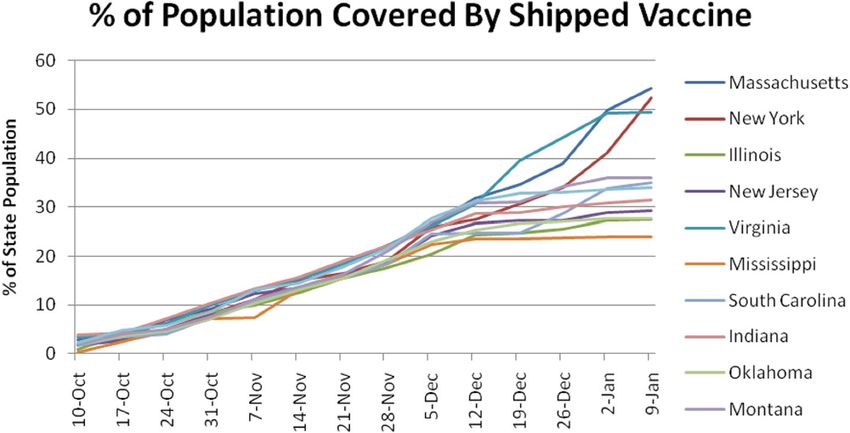
VALUE IN HEALTH 15 (2012) 158 –166 159
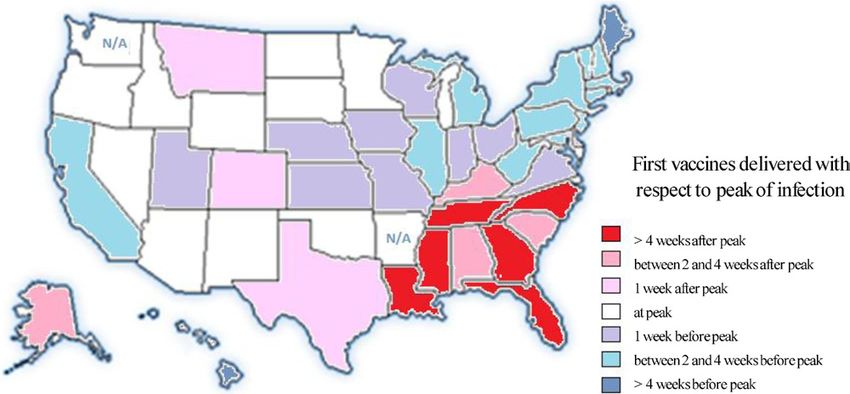
Fig. 1 – Timing of shipment of first vaccine with respect to the peak of the infection in selected states. N/A, not available.
peak of the epidemic curve but also encourages higher participa- infection rate [17,18]. The CDC later reestimated the range of ac-
tion rates from the population. tual US infections to be between 43 million and 88 million [19],
The problem of vaccine allocation has been analyzed in the representing only 14% to 29% of the population.
context of distribution of vaccine to various demographic A study in Ontario, Canada, estimated R0 there to be about 1.31
groups in a population. The public policy consensus has been to [20]. The authors attributed the lower-than-predicted estimates to
first vaccinate high-risk groups, including pregnant women, heightened public awareness and better adherence to hygienic
health-care workers, and those at risk of complications from behavior that reduces virus transmission. In our modeling of US
influenza [8,9]. Some authors, however, claim that in the event outbreak progression, we also encountered relatively low values
that large stockpiles of vaccine are available, the vaccines for R0 but note that these values agree with findings in Ontario and
should be distributed to the “drivers” of infection, such as the relatively low infection rates reported in the United States.
schoolchildren and other high-activity individuals [10]. Chowell In a recent article, Sander et al. [15] used an agent-based model
et al. [11] have approached the problem of measuring vaccine to depict the spread of H1N1 in Ontario. They asserted that the
effectiveness by modeling a possible outbreak similar to H1N1 immunization program in the province was a “cost-effective”
based on Mexican demographics. They concluded that as much means to prevent H1N1 cases. Ontario’s program started admin-
as a 37% reduction in the number of hospitalizations could have istering vaccines 2 weeks before the peak of infections in Ontario.
been achieved with an “adaptive” vaccination strategy based on Because most of the states were hit by the outbreak earlier, half of
demographics and information obtained during the outbreak. the states started administering vaccine after the peak had al-
The authors suggested that as the outbreak progresses, vac- ready passed [21]. Not only were vaccines delivered late, but the
cines should be allocated to different age groups in proportion demand for vaccines also declined significantly by the time vac-
to the then-reported influenza-like symptoms and hospitaliza- cines became available [22]. Eventually, in the United States, as
tions from within those age groups. many as 70 million doses were left unadministered [23]. Surveys
While these articles analyze the effectiveness of vaccination showed that low participation rates were partially a result of con-
programs on such parameters as the transmissibility of the flu and cerns for the safety of vaccines and the relative innocuousness of
the demographics of the population, we chose to consider another the H1N1 virus [22,24]. Moreover, by December 2009, when vac-
issue, the timing of the vaccines administered. The timing of vaccine cines became widely available to everyone, the proportion of peo-
distribution has been explored by some authors in the context of ple in the population who were concerned about the dangers of
both general influenza models [12,13] and specific outbreaks H1N1 had dropped significantly from between 51% and 59% to
[14,15]. We, in turn, analyzed the effect of vaccine distribution about 40% [24].
timing on the spread of the 2009 –2010 H1N1 virus in different US For each state, Figure 1 displays in color codes the timing of
states. The large size of the country allowed us to compare the shipment of first vaccine with respect to the peak of the infection
spread of the same strain of influenza as it infected different com- in that state [4]. Six southeastern states received their first vac-
munities at different times. cines more than 4 weeks after the peak of their respective H1N1
Specifically, for each of several states, we examined two timing outbreaks. The infection then spread northwest, with the north-
relationships, the time of onset and growth of the flu wave and the eastern states having the most time to prepare and vaccinate their
timing of vaccinations. For each state, we applied simple temporal populations. Maine and isolated Hawaii had more than 4 weeks of
models to estimate the number of flu infections averted by the vaccine dispensation prior to the peak outbreak in their states.
administration of vaccine. This article is a natural follow-up to the Finkelstein et al. [21]
The rapid and massive spread of H1N1 in Mexico City in the article as we demonstrate the potential loss of vaccine effectiveness
spring of 2009 motivated numerous articles estimating the param- with late shipments. We evaluate the effect of the timing of vaccina-
eters of the epidemic and characterizing the effects of H1N1. The tion programs in 11 states and suggest some lessons learned in the
most important parameter in epidemiology, the reproductive event of future pandemics and immunization efforts.
number R0, is defined as the average number of new infections
caused by a “typical” infectious individual in a fully susceptible
population. Early estimates in Mexico estimated R0 to range be-
Methods
tween 1.4 and 1.6 [16], implying a potentially dangerous progres-
sion for other countries. This, in turn, led to predicted estimates of To estimate the number of infections averted from the various
1.3 to 1.8 for R0 for the United States and an estimated 60% national vaccine programs, we first used available data to estimate the ep-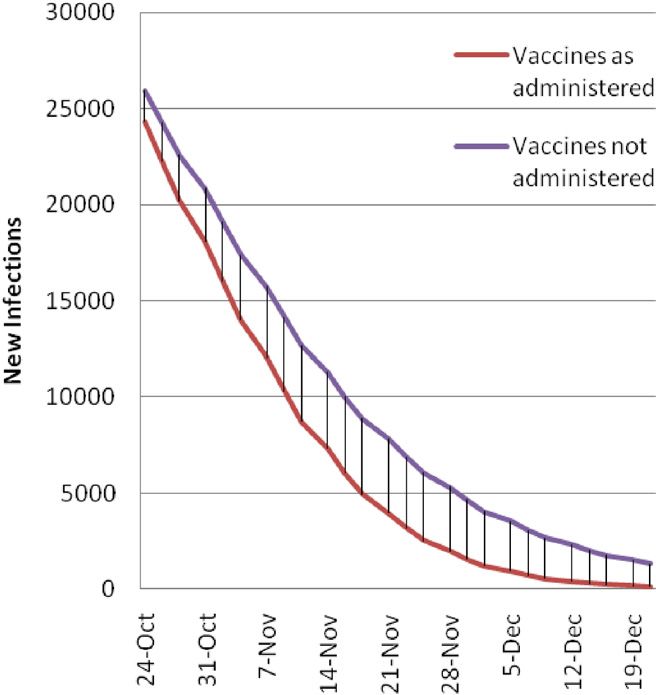
160                                                 VALUE IN HEALTH 15 (2012) 158 –166

idemic curve during the period in the fall of 2009 when H1N1 was          resented by t ⫽ 1, 2, 3, . . ., tmax. In our calculations, we let a single
most prevalent. Once we had obtained an estimated epidemic                generation of the flu be equal to 10/3 ⫽ 2.33 days. Assuming just
curve, we used it in conjunction with reported vaccine adminis-           one number for the duration of the flu is a simplification. While
tration data to fit the observed epidemic curve to the one gener-         actual generation of the flu varies with different viruses as well
ated by a mathematical model based on difference equations. We            as on an individual level, we made this simplification to keep
used a discrete-time version of the standard Kermack–McKend-              our discrete-time epidemic curve model tractable. The value we
rick model to estimate infection spread within each state [25–27].        chose is consistent with the analysis of H1N1 in Mexico done in
In the model calibration process, we estimated the relevant pa-           May 2009 [17,20].
rameters such as R0 within each state. We estimated the R0 for               We let
each state individually, because different states have different de-
mographic, geographic, and cultural attributes. Moreover, states          C(t) ⫽ the number of nonflu hospital patients in generation t.
experienced the H1N1 outbreak at different times and imple-                   Invoking our assumption of a constant number of such pa-
mented their vaccination programs in different ways [6], so the
                                                                          tients over time, we expressed
extent of the infection varied markedly.
    We then estimated a different, nonobservable flu wave curve,          C(t) ⫽ C0t ⫽ 1, 2, 3, . . ., tmax.
one assuming no available vaccine. This multistep process pro-
vided a data-informed, model-supported basis for estimating the               Next we considered the unobservable number of flu patients
positive effects, if any, of the vaccine as administered in each of       seeking hospital medical advice: N(t) ⫽ the number of patients
the states.                                                               with H1N1 who visit a hospital in generation t, for t ⫽ 1, 2, 3, . . .,
    Before describing the methodology in full, it is worth noting some    tmax. What we observed in reported data was F(t), the fraction of all
common drawbacks to using a discrete-time model that implies ho-          hospital visits that were attributable to H1N1,
mogeneous mixing in the population. Each state’s population is seg-
                                                                                     N(t)
mented into groups of varying susceptibility, infectivity, and activity   F(t) ⫽               .
levels, each of which may strongly influence the progression of the                N(t) ⫹ C0
epidemic [28,29]. While all models are imperfect, each region we in-      Solving for N(t), we calculated
vestigated was large enough that homogeneous mixing provided a
reasonable estimate for modeling the epidemic curve. This method-         F(t)[N(t) ⫹ C0] ⫽ N(t),
ology was used throughout the H1N1 outbreak [18,30]. In addition,
                                                                          or
while epidemics occur in continuous time, our use of a discrete-time
model both simplified calculation and allowed us to incorporate the       F(t)C0 ⫽ N(t)[1 ⫺ F(t)],
fact that during the 2009 –2010 H1N1 pandemic, vaccines were
shipped on a weekly basis and vaccine stocks were increased at dis-                       C0F共t兲
                                                                          or N共t兲 ⫽                      .
crete time intervals.                                                                  关1⫺F共t兲兴
                                                                              Invoking the assumption that the total number of H1N1
Epidemic curve estimation                                                 cases is proportional to the number of H1N1-related hospital
                                                                          visits, we deduced that the shape of the epidemic curve was
We first estimated the true epidemic curve within the different
                                                                          proportional to N(t). Because we had access to F(t) only, the
states, in which the flu curve includes the effects of vaccinations.
                                                                          value of C0, the total number of non-H1N1 hospital visits per
Because this virus was so prevalent in the US population, it was
                                                                          generation, was unknown. While we did not know that quan-
impossible to record an accurate epidemic curve in each state.
                                                                          tity, we could approximate the value of C0 because we knew
There was no direct way to know the total number of people in-
                                                                          the total number of H1N1 visits during our time period. Specif-
fected because 1) many such individuals did not present them-
                                                                          ically, we let I be the total number of H1N1 visits in a US state.
selves to medical authorities and 2) for those who did visit a phy-
                                                                          Then,
sician, confirming tests for H1N1 were not routinely ordered.
Instead, we used the data released by the states’ health depart-
ments that included the weekly percentage of all hospitalizations         tmax                    tmax
                                                                                                             C0F(t)
and outpatient visits resulting from ILI (%ILI) over the 2009 –2010       兺 [N(t) ⫹ C ]⫽ 兺 1 ⫺ F(t) ⫹ C ⫽ I.
                                                                          t⫽1
                                                                                          0
                                                                                                   t⫽1
                                                                                                                        0
flu seasons [7]. From that, we estimated the number of H1N1 in-
fections for each week. We assumed that the total number of cases         Consequently, we calculated
was directly proportional to the total number of H1N1 hospitaliza-
tions and outpatient visits. While the %ILI curve provided a good                             I
                                                                          C0 ⫽                                      .
indication of the spread of infection, we did not use it as the epi-                                         F(t)
demic curve because the total number of hospitalizations and out-                tmax ⫹   兺   tmax
                                                                                              t⫽1
                                                                                                     1 ⫺ F(t)
patient visits associated with all medical conditions changes
throughout the year. Each point on the %ILI temporal curve repre-             We approximated I by using information from the CDC regard-
sents the percentage of the total number of hospitalizations and          ing the total number of infections in the United States.
outpatient visits that are specific to H1N1. Because the flu wave             This transformation gave us a closer estimate of the actual
first grows and then declines, this total number is not uniform           epidemic curve than did the %ILI curve by itself. We were still
throughout the observation period. We expect a higher number              faced with the fact, however, that people presented to doctors and
of total hospitalizations and outpatient visits during the peak of        hospitals at different rates throughout the pandemic. One might
H1N1, with the number of non-H1N1 hospitalizations and out-               conjecture that the rate of hospital visits would have been higher
patient visits remaining relatively stable throughout the sever-          at the beginning of the pandemic, when media reports were im-
al-month observation period. By using this assumption, we per-            plying a real danger from flulike symptoms, and that the rate
formed a simple transformation on the %ILI curve to obtain a              would decrease toward the end of the epidemic, when reports had
new curve that we considered to be directly proportional to the           confirmed that the consequences of H1N1 were relatively mild;
experienced flu wave curve.                                               but the rate of hospital admissions would not be affected by such
    To carry out the required transformation, we split our time-          psychological factors. Furthermore, there are still other factors,
line into discrete “flu generation periods,” with generations rep-        such as parents of symptomatic children not wishing to present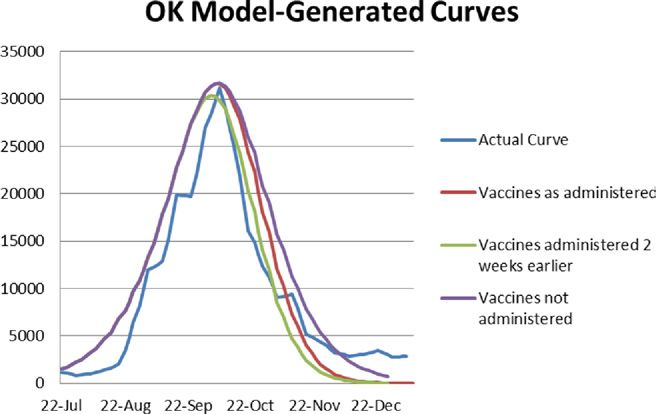
VALUE IN HEALTH 15 (2012) 158 –166                                                         161

their children to medical facilities for fear of their contracting the             We now had a model consisting of the following three equa-
illness, should they not already have it. One can keep conjecturing             tions where V(t) is known for all t.
ad infinitum. It is difficult to quantify these myriad possible ef-                          t⫺1
fects, and so we did not include them in the transformation.
     According to the CDC, the percentage of people infected with
                                                                                MI(t) ⫽ R0   兿 R(n), t ⫽ 1, 2, 3, . . .,
                                                                                             n⫽1
                                                                                                                             tmax

H1N1 in the United States ranged from 14% to 29% of the popula-                             N ⫽ I(t) ⫺ MI(t)
tion [19]. We tried a range of values for the total number of infec-            R(t) ⫽ R0                      , t ⫽ 1, 2, 3, . . ., tmax
                                                                                                   N
tions in the region and fit our model to each one by finding the
parameters that minimized the mean square error between the                     I(t) ⫽ I(t ⫺ 1) ⫹ MI(t ⫺ 1) ⫹ V(t ⫺ 1), t ⫽ 1, 2, 3, . . ., tmax
epidemic curve and the resulting modeled curve. To find the best
fit, we modified three parameters: the total number of infections,                 These equations can be solved iteratively, via recursion start-
the number of infections at the start of the epidemic (“patient                 ing with the boundary conditions MI(0), I(0), and R(0) ⫽ R0.
zeros”), and R0. For each fit, we took the resulting fitted value of R0.
The values were usually close together, and we chose the value of
R0 that best fit the exponential growth of cases near the onset of              Estimating the effects of vaccine
the epidemic.
                                                                                The nonobservable curve
                                                                                Suppose, in the absence of vaccines, we have a pandemic infection
A set of difference equations
                                                                                curve C(t). Here,
We used a set of difference equations that corresponds to a dis-                    C(t) ⫽ the number of new flu infections reported during genera-
crete-time version of a classic Susceptible-Infectious-Recovered                tion t of the infection period, assuming no vaccine. t ⫽ 1, 2, 3, . . ., tmax.
(S-I-R) model [25–27,31].                                                           We called C(t) the base curve, that is, the infection wave that
     For each state, we adjusted model parameters to obtain a best              occurs in the absence of vaccines. Also, for the sake of simplicity
fit between the reported data, as transformed above, and the mod-               we assumed that human behavior, as illustrated, for instance, by
el-generated flu wave epidemic curve. This process led to a direct              hygienic steps and other nonpharmaceutical interventions, re-
estimation of R0.                                                               mained unchanged during the course of the infection period. This
     We let R(t) ⫽ the mean number of new infections generated by               base curve is unobservable because the state-specific data report-
a randomly selected infectious (asymptomatic) patient at genera-                ing numbers of people infected included the effects of adminis-
tion t of the epidemic. t ⫽ 1, 2, 3, . . ., tmax.                               tered vaccines.

The epidemic curve                                                              Timing of vaccinations and subsequent immunity
Suppose the number of infected people at “generation zero” is 1                 To depict the effect of vaccinations on the population, we used
person. That is, there is 1 “patient zero.” Then, the mean number               V(t), which is the number of individuals who have been vacci-
of infected people in generation 1 is R0 persons, each of whom                  nated and first acquired immunity during generation t, with t ⫽
subsequently infects on average R(1) persons in generation 2, and               1, 2, 3, . . ., tmax.
so on. So, in generation t, the mean number of people infected,                     We assumed that only susceptible individuals received vacci-
MI(t), will be the product R0 ⫻ R(1) ⫻ R(2) ⫻ . . . ⫻ R(t ⫺ 1). More            nations.
compactly, assuming that MI(0) ⫽ 1, we calculated                                   On average, vaccines take effect about 2 weeks after they have
             t⫺1                                                                been administered. In our approximations, we compared the
MI(t) ⫽ R0   兿 R(n), t ⫽ 1, 2, 3, . . ., t
             n⫽1
                                             max                         (2)    numbers calculated in the cases in which the vaccines took effect
                                                                                immediately as well as the cases in which vaccines took effect
    where MI(t) is the mean number of infections at time t.                     after 2 weeks. Similarly, we considered vaccine effectiveness (i.e.,
                                                                                creating immunity to H1N1) to be between 75% and 100%. Accord-
Determining R(t)                                                                ing to preliminary studies, the effectiveness of H1N1 vaccine was
Suppose the total population is N persons, all susceptible at the               well over 90% in 10 days [32], and so the actual effect of the vac-
beginning of the epidemic and all mixing homogeneously—                         cines should be well within the bounds of our analysis.
whether or not they are susceptible or have recovered and have
immunity. Then suppose at generation t we have I(t) people                      The observable curve
recovered and immune, recirculating in the population. Be-                      Another pandemic infection curve, C(t, V),   ជ is the number of new flu
cause of homogeneous mixing, R0 is now modified by a factor of                  infections reported during generation t of the flu, given that im-
[N⫺I(t)⫺MI(t)]/N, to become                                                     munities due to vaccinations occur according to the known time
                                                                                vector V,ជ with t ⫽ 1, 2, 3, . . ., t .
                                                                                                                     max
            N ⫺ I(t) ⫺ MI(t)                                                        Our state-derived data depicted the vaccine-affected flu wave
R(t) ⫽ R0                      , t ⫽ 1, 2, 3, . . ., tmax.               (3)
                   N                                                                 ជ and we wished to infer the (unobservable) vaccine-free flu
                                                                                C(t, V),
                                                                                wave C(t). To estimate the effect of the vaccinations, we needed to
Determining I(t)                                                                estimate C(t) and then compare it to C(t, V).   ជ The difference in the
At generation t we assumed that there were a total of I(t) individ-             areas under the respective curves represented our estimate of the
uals immune to the disease. This immunity can be derived from                   number of infections averted because of the vaccine.
                                                                                    To estimate R0, we fit the model-generated C(t, V)   ជ curve to the
having been vaccinated or from having recovered from the dis-
ease. For simplicity in this model, we assumed that individuals                 empirically estimated epidemic curve, which includes the effects of
infected in generation (t ⫺ 1) recovered and were immune in gen-                vaccinations. The influenza cases during the H1N1 epidemic were
eration t. We also assumed that during the time of generation                   severely underreported. The underreporting appeared to be espe-
(t ⫺ 1), V(t ⫺ 1) individuals received vaccine that made them im-               cially significant at the beginning and end of the outbreak [19,33]. To
mune for the first time in generation t. Thus, we wrote a difference            avoid this “statistical noise” effect, we fit the model-based epidemic
equation for determining the value of I(t):                                     curve to the data surrounding the peak of the epidemic, specifically
                                                                                to the part of the empirical curve that contains 75% of the cases. To
I(t) ⫽ I(t ⫺ 1) ⫹ MI(t ⫺ 1) ⫹ V(t ⫺ 1), t ⫽ 1, 2, 3, . . ., tmax.        (4)    find a best reasonable fit, we used the difference Equations 2, 3, and 4,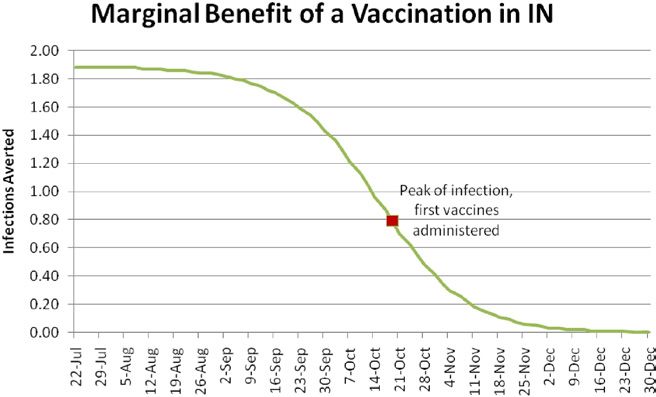
162                                                VALUE IN HEALTH 15 (2012) 158 –166

Fig. 2 – The estimated Oklahoma epidemic curve compared
with vaccines as they were administered in the state. OK,
Oklahoma.

and manipulated the parameters R0 and MI(O). The best fit was de-
termined to be one for which the peak of the model-determined ep-
idemic curve coincided with the estimated real epidemic curve and
for which exponential growth of the early stages of the outbreak
coincided with the real epidemic curve. The R0 obtained by using this
method might be a slight underestimate of the true R0 for the H1N1
pandemic because it was not fitted at the very beginning of the out-
                                                                         Fig. 4 – A closer look at Figure 3. The shaded region
break when data were very noisy, but only once clear exponential
                                                                         represents the difference between the estimated number of
growth was established. This methodology, however, is consistently
                                                                         H1N1 infections that would have occurred without the
used in the literature and provides a reasonable estimate for the
                                                                         intervention of vaccines and the estimated number of
basic reproductive number [16,34].
                                                                         infections that actually occurred with the vaccine.

Results                                                                  2. The curve generated in the hypothetical case in which vaccines
                                                                            were not administered at all; and
Oklahoma in detail                                                       3. The curve generated in the hypothetical case in which vaccines
                                                                            were administered 2 weeks earlier than had actually occurred.
Consider as an illustrative example the estimation process for Okla-
homa. Figure 2 shows 1) the empirical-based estimated epidemic               The total number of infections caused by the outbreak in Okla-
curve for Oklahoma created using the transformation described            homa was calculated by the area under an epidemic curve. The
above and 2) the time-sequenced vaccine administration data re-          effect of the vaccines administered in Oklahoma was determined
ported by the state. In Figure 3, we again included the empirical epi-   by calculating the area between the “actual” model-generated
demic curve and three model-generated epidemic curves:                   curve and the “no-vaccine” model-generated curve (Fig. 4).
                                                                             We analyzed 11 states in detail and inferred the total number of
1. The curve generated by using the Oklahoma-reported vaccine            infections that were prevented as a result of their respective im-
   administration data, fitted to correspond best to the empirical       munization programs. The states Illinois, Indiana, Massachusetts,
   epidemic curve;                                                       Mississippi, Montana, New Jersey, New York, North Dakota, Okla-
                                                                         homa, South Carolina, and Virginia graciously provided us with
                                                                         precise data on vaccines as they were dispensed throughout the
                                                                         outbreak. Here we display two cases for each state:

                                                                         1. The optimistic case, in which all vaccines are effective imme-
                                                                            diately and are 100% effective, and
                                                                         2. The pessimistic case, in which vaccines are effective 2 weeks
                                                                            after administration and are effective for only 75% of the indi-
                                                                            viduals receiving the vaccine.

                                                                             The actual effect of the vaccine should lie within the range
                                                                         specified by these two cases.
                                                                             It is possible that some ILI-related cases were reported with a
                                                                         delay of 1 or 2 weeks with respect to symptom onset, because in-
                                                                         fected individuals may be more likely to visit a medical professional
                                                                         after symptoms become severe. If that is the case, our estimated
                                                                         epidemic curve might be shifted to the left by a few generations. If
Fig. 3 – The estimated epidemic curve along with the                     true, the infections occurred even earlier than what we had assumed,
model-generated curves with and without vaccines. The                    and so vaccine arrival occurred even later with respect to the peak of
best fit for Oklahoma was found with parameters R0 = 1.14,               infections. This would imply that our results are an optimistic esti-
MI(0) = 1500, and I(0) = 0. OK, Oklahoma.                                mate of the effectiveness of states’ vaccine programs.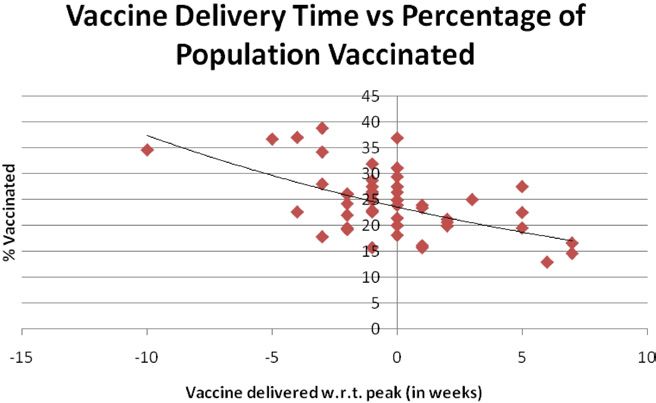
VALUE IN HEALTH 15 (2012) 158 –166                                                        163

 Table 1 – Summary of best-fitted values for R0 and model-determined effects of vaccines as they were distributed*.
 State                  Estimated           % Population                 Optimistic scenario:                      Pessimistic scenario:
                            R0               vaccinated               infections averted (in % of               infections averted (in % of
                                                                           total population)                         total population)

 Illinois                   1.21                   9                              3.43                                       1.2
 Indiana                    1.15                  20                              4.28                                       1.81
 Massachusetts              1.16                  29                             13.71                                       6.84
 Mississippi                1.16                   8                              0.13                                       0.05
 Montana                    1.15                  20                              2.81                                       1.04
 New Jersey                 1.20                  12                              3.36                                       1.1
 New York                   1.20                  14                              3.23                                       1.12
 North Dakota               1.16                  27                              2.95                                       1.06
 Oklahoma                   1.14                  13                              2.29                                       0.93
 South Carolina             1.16                   8                              0.4                                        0.12
 Virginia                   1.19                  22                              1.77                                       0.52

 *In the optimistic scenario, vaccines are 100% effective and take effect immediately. In the pessimistic scenario, vaccines are 75% effective and
 take effect 2 wk after being administered.

                                                                            administering vaccines until after the peak of outbreak. And these
Summary                                                                     states were least successful in averting infections. On the other
In Table 1 we present the results of analysis of 11 states with detailed    hand, Massachusetts and Virginia started administering their vac-
vaccination information. While we have detailed data for only these         cines 5 and 3 weeks, respectively, before their respective peaks.
11 states, we note that the range of estimated values for R0 is fairly      These two states enjoyed a particularly good impact from their vac-
narrow, with higher values falling on more populated states such as         cination programs. Massachusetts, in addition to having 5 weeks of
New York and Illinois and lower values corresponding to states with         vaccinations prior to the H1N1 peak, vaccinated 29% of its popula-
lower population density such as Oklahoma and Montana. Geo-                 tion, the most of any state in our sample. As a result, as much as 7%
graphic proximity also seems to result in similar R0 values.                to 14% of the population may have been spared infection and possi-
    More detailed information for all states is included in Appendix        ble complications from influenza. While Massachusetts and Virginia
A in Supplemental Materials at doi:10.1016/j.jval.2011.07.014.              had effective experiences with their vaccinations, most states did
                                                                            not. On average for our limited sample, vaccines were delivered just
                                                                            before the peak of the states’ outbreaks.
                                                                                To quantify the effect of time in averting infection we considered
Discussion                                                                  one of the states that vaccinated almost 20% of its population, Indi-
While examining the estimated numbers of infections averted, we             ana. Hypothetically, if the same number of vaccines had been deliv-
can identify two major contributing factors. The first is the total         ered just 2 weeks earlier, more than twice the number of infections
number of vaccines administered to the general population. The              could have been averted.
second is the timing of the vaccine administration with respect to              With a more granular approach, we considered the marginal
the peak of the infections. Once the H1N1 virus had been identified         benefit of administering just one vaccination at a given time. We
as a potentially devastating pandemic in the spring of 2009, the            mapped the total projected number of infections that could be
CDC worked to develop and distribute H1N1 vaccines. These vac-              averted if just one vaccination were to be administered to a sus-
cines were sent out to the individual states at the same time, and          ceptible person at different times during the outbreak. That is, we
first doses were administered on October 5, 2009. These vaccines,           calculated the total number of infections that would occur in In-
however, had varying effects because the peak of the outbreak in            diana if exactly one vaccine were administered at different points
different states occurred at markedly different times.                      in time and compared that number to the total number of infec-
    The peak of infection usually occurs when herd immunity oc-             tions that would happen if no vaccines were administered at all.
curs, that is, the time when R(t) ⫽ 1, and every infectious person at       The differences are presented in Figure 5. As expected, adminis-
that time infects on average just one other person [35]. So, at the
time of herd immunity, the number of infections in the next gen-
eration is approximately the same as it was in the previous one.
We say “approximately” because of statistical fluctuations in the
actual number of susceptible people that any one newly infectious
person will infect. Soon afterward, infectious people no longer
replace themselves in society, and the number of infected and
infectious people in each generation decreases. Early administra-
tion of vaccines decreases the number of people who still need to
be infected before herd immunity is achieved, and so decreases
the height of the peak. Late administration of the vaccine has
almost no effect on the dynamics of the outbreak and has little
benefit to the society other than immunizing the people who re-
ceived the vaccine. Such late immunizations may be important if
the flu were to return later in a new wave.
    Consider again the southeastern states of the United States,
the first region to report infection peaks. As early victims they           Fig. 5 – The plot shows the number of infections averted by
received vaccines after the worst of the infection had already              administering exactly one vaccination at different points
passed. Louisiana, Indiana, and South Carolina had not started              throughout the outbreak. IN, Indiana.
164                                               VALUE IN HEALTH 15 (2012) 158 –166

                                                                        need to be administered as soon as possible. These results encour-
                                                                        age us to recommend a more detailed cost– benefit analysis of
                                                                        trying to get some vaccine, even if in much smaller quantities, to
                                                                        the states at the beginning of this “critical period,” when the pop-
                                                                        ulation is particularly sensitive to the timing of vaccination. A
                                                                        small amount of vaccine delivered early should have a more sig-
                                                                        nificant effect on the total number of infections than a batch de-
                                                                        livered just a few weeks later.
                                                                            Furthermore, we conjecture that the timeliness of the vaccines
                                                                        is also closely related to the total amount of vaccine accepted by
                                                                        the population. While the CDC distributed its vaccines proportion-
                                                                        ally to the population of each region, states varied in the amount of
                                                                        vaccine that was actually used. For instance, Mississippi used less
                                                                        than 40% of its allocated vaccine, most likely due to “flu fatigue.”
                                                                        While the media are particularly helpful at warning the public of
                                                                        an ongoing pandemic and encouraging the use of nonpharmaceu-
Fig. 6 – The relationship between the timing of vaccine                 tical interventions, they can also give the impression that the out-
delivery with respect to the peak and the percentage of the             break is over or has been blown out of proportion. Once the peak of
state population that received the H1N1 vaccine for all 50              the outbreak had passed and H1N1 had been determined to be less
states. w.r.t., with respect to.                                        dangerous than was originally feared, the populations of the “early
                                                                        victim” states would be less likely to spend their time and risk
                                                                        perceived possible side effects of getting a flu shot.
tered vaccines have a monotonically decreasing benefit with re-             Looking at all 50 states and comparing the percentage of vac-
spect to time. A striking feature of Figure 5 is the fact that one      cinated population by the end of the outbreak to the week of vac-
vaccination to a susceptible person well before the flu wave starts     cine delivery [36], we notice in Figure 6 a weak negative correlation
averts almost two infections in the population, even with a low         between the timing of vaccine delivery with respect to the peak,
value for R0 (1.15) and even considering the fact that the vacci-       and the total percentage of the population that accepted vaccina-
nated person has a greater than even chance of never becoming           tions. These results are consistent with the position of Harris et al.
infected assuming no vaccination. Clearly, vaccines administered        [22] that had the vaccines been delivered earlier to the states, more
well before the peak carry the added benefit of diluting the sus-       people would have been encouraged to accept a vaccination.
ceptible population with immune people and are particularly use-            This effect would be particularly relevant to South Carolina,
ful in mitigating the spread of infection.                              which started administering its vaccines 1 week after the peak of
    Another insightful feature of this graph is the slope of the mar-   infection and subsequently managed to vaccinate only 8% of its
ginal benefit curve, which represents the time dependence of ef-        population. If these vaccinations were to have started earlier, be-
fective vaccines. While starting vaccine administration in Indiana      fore the peak, we could hypothesize not only an increase in effec-
in July would be most effective for Indiana, the effect of these        tiveness from timing alone but also a higher participation rate in
vaccines would not change significantly until the beginning of          the vaccination program. Early administration is particularly im-
September. That is, if vaccines were to be available in July, Indiana   portant in that it increases the efficacy of vaccine along with en-
could have waited to receive its share until September with min-        couraging people to accept vaccination.
imal losses. Similarly, vaccines received after December will have
the same (minimal) effect whether they are administered in De-
cember or February. The effectiveness of vaccines, however, is          Vaccine allocation
extremely time sensitive from the end of September to mid-No-           As shown in Figure 7, in the first few weeks of vaccine distribution,
vember, where each week results in a significant loss of effective-     when demand for vaccine clearly exceeded supply, the CDC allo-
ness. Vaccines that become available during this critical period        cated vaccine to states proportionally to their populations [4]. Par-

Fig. 7 – During the early stages of the outbreak when the demand for vaccines outweighed the supply, the Centers for
Disease Control and Prevention distributed vaccine proportionally to the population of the states.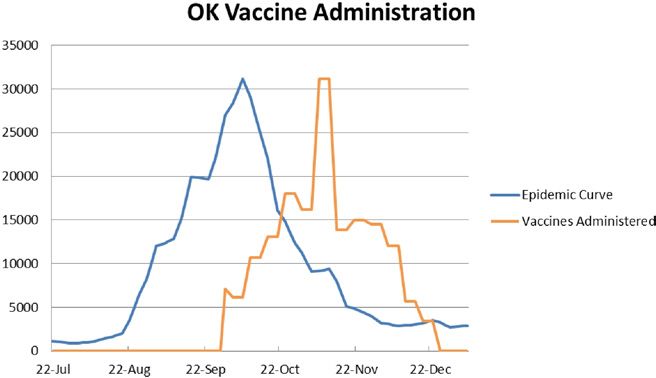
VALUE IN HEALTH 15 (2012) 158 –166                                                        165

 Table 2 – Comparison of vaccination programs in North Dakota and Mississippi.
                             North Dakota                                                                 Mississippi

 ● Started administration 1 wk before peak                                        ● Received vaccines 6 wk after peak
 ● A hypothetical single batch of 32,342 vaccines (5% of the population)          ● A hypothetical single batch of 147,599 vaccines (5% of the
   administered on October 10 averts 33,745 infections (5.2% of the                 population) administered on October 10 averts 27,173
   population)                                                                      infections (0.9% of the population)
 ● In the first 4 wk administered 62% of available vaccines                       ● In the first 4 wk administered less than 25% of available
                                                                                    vaccines

ticularly in early October, this simple distribution scheme ensured        are projected to administer more of the vaccine with greater ben-
that all states received amounts that could be used to immunize            eficial effects.
the same proportion of the population. Come November, those                    In our analysis of individual state immunization programs
states that saw little demand started placing fewer orders for in-         we used a relatively simple model, assuming a homogeneous
fluenza vaccine, while those with later epidemics such as Massa-           population and a deterministic model structure. As a result, our
chusetts and Virginia were still experiencing high demand and              model, as most models, is not an exact picture of what hap-
were shipped larger quantities of vaccine, confirming the intuition        pened during the fall of 2009, but rather a tool to gain insight
from Figure 6.                                                             about strategies that could help the public mitigate the effect of
    The previous sections imply that the same vaccines adminis-            influenza pandemics. While the exact numbers almost surely
tered in states that had already experienced the peak of the infec-        differ from the estimates, the relative results should hold under
tion at the time vaccines started arriving were much less effective        a range of assumptions about R0 vaccine efficacy and the gen-
than those administered in states that had not yet experienced the         eration period of the flu.
peak. Moreover, the states that were past the peak saw less de-
mand for vaccines and thus used only a small fraction of their
allocated vaccines. Consider a side-by-side analysis of Mississippi        Acknowledgments
and North Dakota in Table 2.
    It is clear that vaccines administered in North Dakota were            We thank Dr. Stan Finkelstein, Dr. Sahar Hashmi, Kallie Hedberg,
significantly more effective than those in Mississippi. In fact, the       and Julia Hopkins for helpful comments on an earlier draft.
Mississippi vaccines had almost no effect because the infection               Source of financial support: Work on this study was supported
was barely spreading by the time vaccines became available. Cou-           by the Sloan Foundation of New York under a grant titled “Deci-
pled with this, North Dakota was experiencing more demand for              sion-Oriented Analysis of Pandemic Flu Preparedness & Re-
the vaccines at the beginning of its program. Based on this analy-         sponse” and under a cooperative agreement with the US Centers
sis, we believe that there is a need for more effective procedures         for Disease Control and Prevention (CDC), grant number 1 PO1
for allocating vaccines to US states.                                      TP000307-01, “LAMPS (Linking Assessment and Measurement to
    Naturally, allocating all of Mississippi’s vaccines to North           Performance in PHEP Systems), awarded to the Harvard School of
Dakota would be not only unethical but also politically infeasi-           Public Health Center for Public Health Preparedness (HSPHCPHP)
ble. Instead, as a thought experiment, suppose that just 20% of            and the Massachusetts Institute of Technology (MIT), Center for
Mississippi’s unused vaccine were to be transferred to North               Engineering Systems Fundamentals (CESF). The discussion and
Dakota during the first 4 weeks of vaccine distribution. Suppose           conclusions in this article are those of the authors and do not
that with this addition, 60% of the new vaccines were actually             necessarily represent the views of the Sloan Foundation, the
administered. This additional vaccine would decrease the total             CDC, the US Department of Health and Human Services, Har-
number of infections in North Dakota by 5%. That is a significant          vard, or MIT.
improvement for a relatively small cost. An adaptive decision
such as this can be made during the allocation process. We can
form even approximate predictions about how much vaccine
will actually be demanded by the state and how effective the
                                                                           Supplemental Materials
extra vaccines would be in reducing infections. For example, by
using data collected from our 11 states, we can weakly estimate            Supplemental material accompanying this article can be found in
that a state that had experienced peak infection 6 weeks earlier           the online version as a hyperlink at doi:10.1016/j.jval.2011.07.014
can be expected to vaccinate no more than 4% of its population             or, if a hard copy of article, at www.valueinhealthjournal.com/
within the first 4 weeks. In the first 4 weeks of the 2009 H1N1            issues (select volume, issue, and article).
outbreak, the CDC allocated to Mississippi enough vaccine to
cover 7% of its population. With accurate data, some portion of            REFERENCES
that could have been redirected to states that were more likely
to use and benefit from the vaccine.
                                                                           [1] Centers for Disease Control and Prevention. The 2009 H1N1 pandemic:
                                                                               summary highlights, April 2009-April 2010. Available from: http://
                                                                               www.cdc.gov/h1n1flu/cdcresponse.htm. Accessed January 20, 2011.
Conclusions                                                                [2] World Health Organization. World now at the start of 2009 influenza
                                                                               pandemic. Available from: http://www.who.int/mediacentre/news/
Our analysis shows the importance of the timing of vaccinations
                                                                               statements/2009/h1n1_pandemic_phase6_20090611/en/index.html.
for infectious respiratory diseases such as influenza. We empha-               Accessed January 20, 2011.
size the need to start administering vaccines well before the peak         [3] World Health Organization. Global Alert and Response (GAR):
of an influenza outbreak. Moreover, when a governing body such                 pandemic (H1N1) 2009- update 112. Available from: http://www
                                                                               .who.int/csr/don/2010_08_06/en/index.html. Accessed January 20,
as the CDC is faced with the allocation decision, it is important to
                                                                               2011.
take into consideration the stages of the outbreaks in different           [4] Centers for Disease Control and Prevention. Graph and table of 2009
regions and to deploy vaccine with preference to the regions that              H1N1 influenza vaccine doses allocated, ordered, and shipped;
166 VALUE IN HEALTH 15 (2012) 158 –166
updated February 2, 2010. Available from: http://www.cdc.gov/ [20] Tuite AR, Greer AL, Whelan M, et al. Estimated epidemiologic
h1n1flu/vaccination/vaccinesupply.htm. Accessed July 29, 2010. parameters and morbidity associated with pandemic H1N1 influenza.
[5] Centers for Disease Control and Prevention. Press briefing transcripts; CMAJ 2010;182:131– 6.
updated September 3, 2009. Available from: http://www.cdc.gov/ [21] Finkelstein S, Hedberg KJ, Hopkins JA, et al. Vaccine availability in the
media/transcripts/2009/t090903.htm. Accessed June 10, 2011. US following the 2009 H1N1 outbreak. Am J Disaster Med 2011:6:23–30.
[6] Hopkins, J. 2009 H1N1 after action reports: lessons on vaccine [22] Harris KM, Maurer J, Kellermann A. Influenza vaccine—safe, effective,
distribution. MIT ESD Working Paper 2011. Available from: http:// and mistrusted. N Engl J Med 2010;363:2183–5.
esd.mit.edu/staging/WPS/2011/esd-wp-2011-06.pdf. Accessed October [23] Moyer CS. H1N1 vaccine: what physicians can do with leftover doses.
18, 2011. Am Med News. Available from: http://www.ama-assn.org/amednews/
[7] Centers for Disease Control and Prevention. CDC, seasonal influenza 2010/07/19/prsb0719.htm. Accessed July 19, 2010.
(flu), weekly report: influenza summary update; updated May 28, 2010.
[24] SteelFisher GK, Blendon RJ, Bekheit MM, Lubell K. The public’s
Available from: http://www.cdc.gov/flu/weekly/. Accessed July 29,
response to the 2009 H1N1 influenza pandemic. N Engl J Med 2010;362:
2010.
e65.
[8] Centers for Disease Control and Prevention. Questions and answers:
[25] Kermack WO, McKendrick AG. Contributions to the mathematical
seasonal flu shot. Available from: http://www.cdc.gov/FLU/about/qa/
flushot.htm. Accessed January 20, 2011. theory of epidemics. Proc R Soc Lond 1927;115:700 –21.
[9] Longini I, Halloran E. Strategy for distribution of influenza vaccine to [26] Murray JD. Mathematical Biology. Berlin: Springer, 1989:610 –50.
high-risk groups and children. Am J Epidemiol 2005;161:303– 6. [27] Keeling MJ, Rohani P. Modeling infectious diseases in humans and
[10] Patel R, Longini IM, Halloran ME. Finding optimal vaccination animals. Princeton, NJ: Princeton University Press, 2007.
strategies for pandemic influenza using genetic algorithms. J Theor [28] Larson RC. Simple models of influenza progression within a
Biol 2005;234:201–12. heterogeneous population. Oper Res 2007;55:399 – 412.
[11] Chowell G, Viboud C, Wang X, et al. Adaptive vaccination strategies to [29] Nigmatulina KR. Modeling and responding to pandemic influenza:
mitigate pandemic influenza: Mexico as a case study. PLoS One 2009;4: importance of population distributional attributes and non-
e8164. pharmaceutical interventions (Doctoral dissertation 2009). Available
[12] Nigmatulina K, Larson RC. Living with influenza: impacts of from: http://dspace.mit.edu/handle/1721.1/53298. Accessed February
government imposed and voluntarily selected interventions. EJOR 25, 2011.
2009;195:613–27. [30] Coburn BJ, Wagner BG, Blower S. Modeling influenza epidemics and
[13] Larson RC, Nigmatulina KR. Engineering reponses to pandemics. Info pandemics: insights into the future of swine flu (H1N1). BMC Med
Knowl Sys Manag 2009;8:311–39. 2009;7:30.
[14] Khazeni N, Hutton D, Garber A, et al. Effectiveness and cost- [31] Diekmann O, Heesterbeek JAP. Mathematical Epidemiology of
effectiveness of vaccination against pandemic influenza (H1N1) 2009. Infectious Diseases: Model Building, Analysis and Interpretation. New
Ann Intern Med 2009;151:829 –31. York: Wiley, 2000.
[15] Sander B, Bauch C, Fishman DN, et al. Is a mass immunization [32] Greenberg ME, Lai MH, Hartel GF, et al. Response after one does of a
program for pandemic (H1N1) 2009 good value for money? Early
monovalent influenza A (H1N1) 2009 vaccine—preliminary report.
evidence from the Canadian experience. Vaccine 2010;28:6210 –20.
N Engl J Med 2009;361:2405–13.
[16] Fraser C, Donnelly CA, Cauchemez S, et al. Pandemic potential of a
[33] Centers for Disease Control and Prevention. Underreporting of 2009
strain of influenza A (H1N1): early findings. Science 2009;324:1557– 61.
H1N1 influenza cases. Available from: http://www2c.cdc.gov/podcasts/
[17] White LF, Wallinga J, Finelli L, et al. Estimation of the reproductive
media/pdf/EID_12-09_FluEstimates.pdf. Accessed June 10, 2011.
number and the serial interval in early phase of the 2009 influenza
A/H1N1 pandemic in the USA. Influenza Other Respi Viruses 2009; [34] Mills CE, Robins JM, Lipsitch M. Transmissibility of 1918 pandemic
3(6):267–76. influenza. Nature 2004;432:904 – 6.
[18] Towers S, Feng Z. Pandemic H1N1 influenza: predicting the course of a [35] Anderson R. The concept of herd immunity and the design of
pandemic and assessing the efficacy of the planned vaccination community-based immunization programmes. Vaccine 1992;10:
programme in the United States. Euro Surveill 2009;14(41):19358. 928 –35.
[19] Centers for Disease Control and Prevention. Updated CDC estimates of [36] Centers for Disease Control and Prevention. Interim results: State-
2009 H1N1 influenza cases, hospitalizations and deaths in the United specific influenza A (H1N1) 2009 monovalent vaccination coverage—
States, April 2009 –March 13, 2010. Available from: http://www.cdc United States, October 2009 –January 2010. Available from: http://
.gov/h1n1flu/estimates/April_March_13.htm. Accessed December www.cdc.gov/mmwr/preview/mmwrhtml/mm5912a2.htm. Accessed
15, 2010. January 20, 2011.You can also read