Field Survey of Flank Collapse and Run-up Heights due to 2018 Anak Krakatau Tsunami
←
→
Page content transcription
If your browser does not render page correctly, please read the page content below

Article, Published Version

Esteban, Miguel; Takabatake, Tomoyuki; Achiari, Hendra; Mikami,
Takahito; Nakamura, Ryota; Gelfi, Mustarakh; Panalaran, Satriyo;
Nishida, Yuta; Inagaki, Naoto; Chadwick, Christopher; Oizumi, Kota;
Shibayama, Tomoya
Field Survey of Flank Collapse and Run-up Heights due to
2018 Anak Krakatau Tsunami
Journal of Coastal and Hydraulic Structures

Verfügbar unter/Available at: https://hdl.handle.net/20.500.11970/107568

Vorgeschlagene Zitierweise/Suggested citation:
Esteban, Miguel; Takabatake, Tomoyuki; Achiari, Hendra; Mikami, Takahito; Nakamura,
Ryota; Gelfi, Mustarakh; Panalaran, Satriyo; Nishida, Yuta; Inagaki, Naoto; Chadwick,
Christopher; Oizumi, Kota; Shibayama, Tomoya (2021): Field Survey of Flank Collapse and
Run-up Heights due to 2018 Anak Krakatau Tsunami. In: Journal of Coastal and Hydraulic
Structures 1. https://doi.org/10.48438/jchs.2021.0001.

Standardnutzungsbedingungen/Terms of Use:

Die Dokumente in HENRY stehen unter der Creative Commons Lizenz CC BY 4.0, sofern keine abweichenden
Nutzungsbedingungen getroffen wurden. Damit ist sowohl die kommerzielle Nutzung als auch das Teilen, die
Weiterbearbeitung und Speicherung erlaubt. Das Verwenden und das Bearbeiten stehen unter der Bedingung der
Namensnennung. Im Einzelfall kann eine restriktivere Lizenz gelten; dann gelten abweichend von den obigen
Nutzungsbedingungen die in der dort genannten Lizenz gewährten Nutzungsrechte.
Documents in HENRY are made available under the Creative Commons License CC BY 4.0, if no other license is
applicable. Under CC BY 4.0 commercial use and sharing, remixing, transforming, and building upon the material
of the work is permitted. In some cases a different, more restrictive license may apply; if applicable the terms of
the restrictive license will be binding.
JOURNAL OF COASTAL AND HYDRAULIC STRUCTURES
                                                    Vol. 1, 2021, 1

Field Survey of Flank Collapse and Run-up Heights due
to 2018 Anak Krakatau Tsunami
Miguel Esteban1, Tomoyuki Takabatake2, Hendra Achiari3, Takahito Mikami4, Ryota Nakamura5, Mustarakh Gelfi6,
Satriyo Panalaran7, Yuta Nishida8, Naoto Inagaki9, Christopher Chadwick10, Kota Oizumi11, and Tomoya Shibayama12

                                                                      1esteban.fagan@gmail.com,    Waseda University,
Abstract                                                              Tokyo, Japan
                                                                      2takabatake@aoni.waseda.jp, Waseda University,

    On the 22nd of December 2018 tsunami waves generated by the       Tokyo, Japan
                                                                      3achiarihendra@gmail.com, Bandung Institute of
flank collapse of the Anak Krakatau volcano in Indonesia flooded
                                                                      Technology (ITB), Bandung, Indonesia;
the shorelines of the nearby Sumatra and Java islands. The authors    4tmikami@tcu.ac.jp, Tokyo City University, Tokyo,
conducted a field survey of the Krakatau archipelago to clarify the   Japan
volume of the collapsed flank and the run-up of the tsunami around    5r-nakamura@eng.niigata-u.ac.jp, Niigata

the islands themselves. To aid with the simulation of this complex    University, Niigata, Japan
tsunami and document the current situation of the islands,            6mustarakh.gelfi@kl.itera.ac.id, Institut Teknologi

bathymetric surveys, aerial drone and panoramic video mapping         Sumatera (ITERA), Lampung, Indonesia
                                                                      7satriyo.panalaran@kl.itera.ac.id, Institut Teknologi
were also carried out. Using DEM of Anak Krakatau before and
after the eruptions and tsunami, the authors could calculate the      Sumatera (ITERA), Lampung, Indonesia
                                                                      8yuta325@ruri.waseda.jp, Waseda University,
volume of flank collapse, which was estimated to be 0.286-0.574
                                                                      Tokyo, Japan
km3. The run-ups that were measured were particularly significant,    9richedge68green@toki.waseda.jp, Waseda
over 80 m in height in Panjang Island. While much of the source       University, Tokyo, Japan
directionally was towards the SE of Anak Krakatau, significant        10chris@thehatch.tv, Liverpool John Moores

wave run-ups were also measured towards the NW, indicating that       University, Liverpool, UK
further numerical modelling is needed to fully explain this event.    11f20e026e@mail.cc.niigata-u.ac.jp, Niigata

The estimation of such parameters is of vital importance for the      University, Niigata, Japan
                                                                      12shibayama@waseda.jp, Waseda University, Tokyo,
design of structures to protect and enhance the resilience of human
settlements in at-risk areas.                                         Japan

Keywords                                                              This paper was submitted on 25 April 2020.
                                                                      It was accepted after double-blind review on 25
Tsunami, Landslide, Krakatau, Field survey                            August 2020.

                                                                      DOI: https://doi.org/10.48438/jchs.2021.0001

1      Introduction                                                   The Journal of Coastal and Hydraulic Structures is a
                                                                      community-based, free, and open access journal for
                                                                      the dissemination of high-quality knowledge on the
    Landslides can generate significant tsunamis, with a number of    engineering science of coastal and hydraulic
significant events having taken place in recent decades. In 1963, a   structures. This paper has been written and reviewed
                                                                      with care. However, the authors and the journal do not
subaerial landslide at Vajont Dam, Italy, impacted a reservoir and    accept any liability which might arise from use of its
generated a significant wave, causing more than 2,000 fatalities      contents. Copyright ©2020 by the authors. This
(Panizzo et al., 2005; Genevois and Ghirotti, 2005). During the       journal paper is published under a CC-BY-4.0 license,
                                                                      which allows anyone to redistribute, mix and adapt, as
1988 Papua New Guinea earthquake, it is believed that a submarine
                                                                      long as credit is given to the authors.
landslide generated a tsunami having over 15 m at Sissano split
(Tappin et al. 2001, 2008). In 2007, subaerial landslides at Chehalis Lake in British Columbia, Canada, caused tsunami

Journal of Coastal and Hydraulic Structures Vol. 1, 2021, 1                                                           1 of 14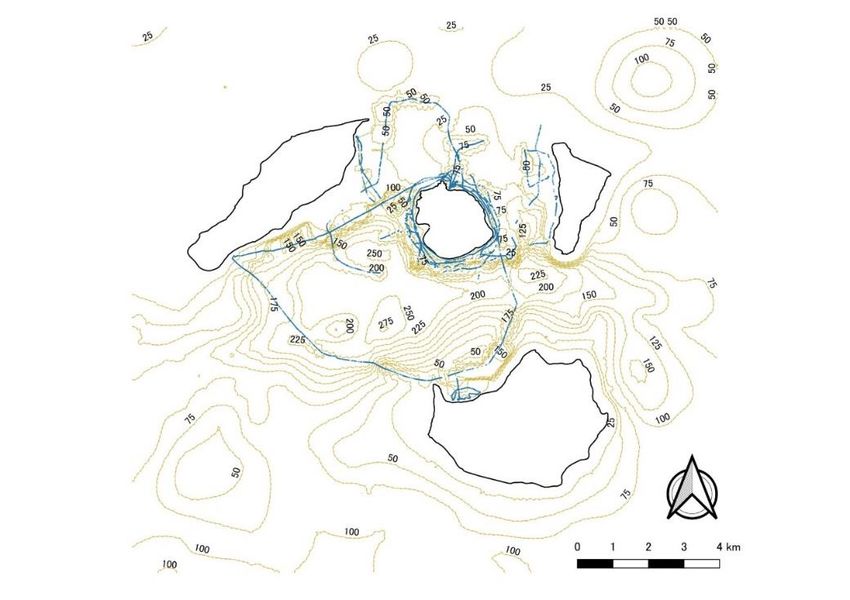
Esteban et al.

run-ups of 38 m (Brideau et al., 2012). In the 2010 Haiti Earthquake, coastal landslides caused by an earthquake generated
local tsunami waves of up to 3 m (Fritz et al. 2013). During the 2018 Palu Earthquake, multiple submarine landslides
generated devastating tsunamis with inundations height of up to 5 m in the City of Palu and the Donggala Regency, in
Sulawesi Island, Indonesia, (Sassa and Takagawa 2019; Mikami et al. 2019; Stolle et al. 2020; Harnantyari et al. 2020).
    At 21:30 local time (UTC+7h) on the 22nd of December 2018 the shorelines of the Sunda Strait, Indonesia, were
flooded by tsunami waves. The inundation caused widespread destruction and resulted in 437 casualties, 31`943 injuries,
10 still missing and over 16,000 people displaced (as of the 14th January 2019 National Disaster Management Agency
(BNBP), 2019). The tsunami was caused by the flank collapse of the Anak Krakatau volcano (Robertson et al. 2018;
TDMRC 2018, Takabatake et al., 2019, Grilli et al., 2019), located roughly at the centre of the Sunda Strait, which
separates the Southern Sumatra and western Java islands. Satellite images by the Geospatial Information Authority of
Japan (2018) show a comparison of Anak Krakatau before (2018/08/20) and after (2018/12/24) the event, clearly
identifying the collapse of the southwest side of the volcano. The volume of material that was displaced from it between
the 24th and 27th of December was estimated to be 0.15-0.17 km3, though these rough calculations require a more detailed
verification (Geospatial Information Authority of Japan, 2018).
    The explosion of Krakatau island in August 1883 is a famous event in volcanology and the history of tsunamis. As a
result of it, most of the island was destroyed (Van den Bergh et al. 2003), and a major tsunami was generated, causing
widespread damage to the coastlines around the Sunda Strait. Pararas-Carayannis (2003) report that around 300 coastal
towns and villages were destroyed by waves up to 37 m in height, resulting in over 36,000 casualties. The Krakatau
volcano has continued to be active since then, and in 1927 Anak Krakatau (literally “the child of Krakatau” in Bahasa
Indonesia) emerged above the sea from the remnants of the original volcano (Hoffmann-Rothe et al. 2006).
    The steep side of Anak Krakatau had been deemed unstable for some time (see Giachetti et al., 2012), and there was
a known risk that it could collapse and cause a tsunami. Despite this, the 2018 tsunami event caught local residents and
the authorities by surprise, even when the volcano had been active since June 2018. Essentially, the Indonesian tsunami
warning system is based on ocean buoys that aim to detect the tsunamis that are generated by submarine earthquakes
Rudloff et al. (2009) and Lauterjung et al. (2010), and not those by submarine landslides or volcanic eruptions (which
might have different characteristics, such as shorter wave periods, see Takagi et al., 2019, Mikami et al., 2019). Also, it
would appear that many of the instruments that had been installed after the 2004 Indian Ocean Tsunami were not operating
in 2018, and in any case they were mostly placed along the subduction zone of the Indonesian islands, and not close to
Anak Krakatau (Robertson et al. 2018).
    A number of researchers have investigated the types of tsunamis that can be triggered by volcanic events (e.g.,
Waythomas and Watts 2003; Choi et al. 2003; Maeno et al. 2006; Maeno and Imamura 2011), even though they are less
frequent than those generated by submarine earthquakes (Paris et al. 2014). Takabatake et al. (2019) performed a field
survey of the affected areas to clarify the hazard mechanism, evacuation patterns and run-up and inundation heights due
to the 2018 Sunda Strait tsunami. The survey results showed that inundation heights were more than 4 m high along the
coastline of Sumatra island (situated to the north-north-east of Anak Krakatau), while less than 4 m were measured along
the north-western direction. In Java island inundation heights of over 10 m were measured at Cipenyu Beach (south-
south-eastern direction from Anak Krakatau). Similar tsunami distributions in Sumatra and Java islands were also reported
by Muhari et al. (2019) and Syamsidik et al. (2020). Takabatake et al. (2019) also conducted a questionnaire survey of
those affected by the event, showing relatively high levels of tsunami awareness. However, the lack of warning and
congestion along evacuation routes were identified as important problems in disaster risk management, and can explain
the large number of casualties despite the relatively modest inundation heights.
   Grilli et al. (2019) performed simulations to attempt to clarify the tsunami generation and propagation mechanisms.
However, such research was based on a number of assumptions, notably the absence of a reliable bathymetry or
measurements of the size and extent of the volume of the landslide. The challenges of producing reliable simulations
without having a reliable bathymetry are mentioned by Heidarzadeh et al. (2020), who approximated the tsunami wave
by trial and error using twelve source models. This is a recurring problem for other authors, who have had to rely on
witness photography to estimate the possible run-ups (Paris et al., 2019), or on the parameters proposed by Grilli et al,
2019 (for example Ren et al., 2020)
    A number of authors have attempted to find out more details about the volume of the flank collapse, for example
through the use of synthetic aperture radar (SAT) satellites (Williams et al. 2019). However, to the authors’ knowledge,
Journal of Coastal and Hydraulic Structures Vol. 1, 2021, paper 1                                                        2
Esteban et al.

the only actual field surveys conducted up to date around Anak Krakatau itself are by Borrero et al. (2020) in February
2019. While these authors report run-up heights, they did not conduct bathymetry measurements, and for their computer
simulations they used a landslide scenario from before the actual 2018 eruption (thus failing to take into account for the
actual changes that took place in the mountain).
    In order to accurately simulate the 2018 tsunami it is thus necessary to estimate the collapsed volume, obtain a reliable
bathymetry, and measure the run-ups generated due to the flank collapse of Anak Krakatau. To ascertain such parameters
the authors conducted a field survey of the Krakatau islands, with the present paper summarising the main results and
observations about the characteristics of the tsunami wave around this archipelago, together with their current bathymetry
and geography. The appropriate estimation of such parameters is of vital importance for coastal engineers and disaster
risk managers to design appropriate coastal structures that can withstand tsunamis, helping to protect the lives and
possessions of individuals in at-risk areas.

2      Methodology
    A field survey was conducted eight months after the volcanic eruption that generated the tsunami, between the 14 th
and 18th August 2019, focusing on the four islands that form the Krakatau group (the three remnants of the original
Krakatau island and a fourth island, Anak Krakatau, that started to form in the early 20th century). The main objectives
were to measure the run-up heights, establish how the tsunami propagated immediately after the flank collapse, estimate
the volume of the material lost, and document the present state of the volcano to establish a benchmark to measure future
geomorphological changes. For this purpose, a variety of complementary methods were employed, as summarised below.

2.1 Survey of run-up heights
    The tsunami run-up heights on the side of the mountains were measured using a laser ranging instrument (IMPULSE
200LR (minimum reading: 0.01 m), Laser Technology Inc.), a prism and staffs. All heights were established using the
sea water level as a reference point, and were corrected to the heights above the estimated tidal level at the time of the
tsunami’s arrival (estimated as 21:00 local time on the 22nd of December 2018) using a global tidal prediction software
(WXtide32). The reference location for WXtide32 was Labuhan (the closest station among those included in the software,
located at S6°22', E105°49', around 50 km away from Anak Krakatau), which has a tidal range of around 1 m. All data
used in this paper corresponds to this corrected dataset. The precise location of each survey point was then recorded using
GPS instruments (GPSMAP 64sc J, Garmin Ltd.), following established surveying techniques for these types of surveys
(see Esteban et al. 2018).
    Given the considerable time that had passed since the tsunami and the survey, these run-up heights represent lower-
bound values (and it is likely that the actual values would have been higher). The height of the run-up was ascertained
using direct observations of remaining damage to the vegetation, videos taken by government officials (as will be
described later) and key informant interviews.

2.2 Bathymetry survey
    The bathymetric surveys were conducted using two Garmin GPSMAP 585 echosounders (with two different
transducers, GT20-TM for shallow water, and GT21-TM for deeper water), which were mounted on the two boats used
during the survey (care was taken to keep the speed of the boat below 8 knots/hr, given the operational limitations of the
instrumentation). The bathymetry data was analysed using QGIS 3.2 software, with the interpolation to produce contour
maps being made using the Inverse Distance Weighting (IDW) method. The coastline was extracted from aerial images
after the tsunami events obtained from Google Earth.

Journal of Coastal and Hydraulic Structures Vol. 1, 2021, paper 1                                                          3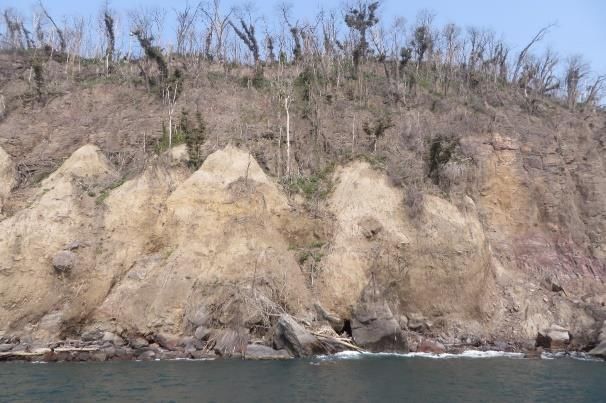
Esteban et al.

2.3 Aerial drone survey
     An aerial drone survey of Anak Krakatau island (and part of the outer islands) was conducted using a Phantom 4 Pro+
unmanned aerial vehicle (UAV) (Da-Jiang Innovations Science and Technology Co. Ltd.). The aerial pictures were taken
at vertical and diagonal angles to the ground level, covering almost 90% area of the volcanic island by flying at 150 m
altitude. The overlap rate of the vertical pictures in the UAV forward moving direction ranged from 70% to 90%, to
compensate the poor side lap rate between flight lines. Diagonal angle views were additionally included in structure from
motion (SfM) process in order to increase the accuracy of constructed digital elevation map (DEM). The photogrammetric
processes, including arrangement of the pictures and construction of the DEM, were conducted using Metashape 1.5.0
Professional Edition (AgiSoft). In these processes, the ground height close to the coastline was corrected to 0 m after the
sea surface area was eliminated from each picture. Then, the absolute value of 90 and 75 percentiles on sorted negative
elevation heights were added to the overall ground heights (75- and 90-case, hereafter).
    The DEM of the island prior to the volcanic eruptions that caused the flank collapse were obtained from the three
datasets mentioned hereafter. The ALOS World 3D (AW3D: Takaku and Tadono, 2017) data bought from NTT has a
2.5 m resolution terrain height generated from the stereo images by ALOS (Advanced Land Observing Satellite) in the
period of 2006-2011. Seamless DEM dan Batimetri Nasional (DEMNAS: Badan Informasi Geospasial 2018a) provides
0.27 arc-second grid-space digital topographic and bathymetric heights around Indonesia. It is based on several different
DEMs which are assimilated with real ground elevation. SRTM (Shuttle Radar Topography Mission: Farr et al. 2007) 1
arc second model is the result of interferometric radar measurement carried out in February 2000. These three DEM were
subtracted from those generated by the data obtained through the UAV to obtain the volume of material that collapsed
and generated the tsunami.

2.4 Underwater and above water 360˚ perimeter video survey
    To document the changes to the perimeter of the island and the underwater characteristics of Anak Krakatau, 360˚
degree panoramic videos were taken using two Nikon KeyMission 360˚ cameras (panoramic 360, framerate 2160/24p).
One of them was installed on top of one of the survey boats, and the other one under water, at a depth of 0.5 m. The boat
sailed around the perimeter of the island, while simultaneously conducting the bathymetry survey of its perimeter.

2.5 Key informant interviews and collection of additional data
   As part of the field survey the authors performed a number of informal non-structured key informant interviews with
local government officers (tasked with guarding the area, as the islands are designed as national parks) and residents. The
aim of this was to collect testimonies, photographic and video footage evidence of the extent of the run-up on the islands.

3      Results

3.1 Run-up heights
   Table 1 shows the tsunami run-up heights measured in this survey, and Fig. 1 the locations of the points surveyed,
together with the results of other surveys around the coastline of Java and Sumatra (Takabatake et al. 2019).
    As shown in Fig. 1, the maximum run-up heights in Rakata island were 46.8 and 49.4 m. As this island was much
higher than the others surrounding it, with steep slopes facing Anak Krakatau, it was not overtopped (see Fig. 2a and b).
Tsunami heights were measured according to the line of vegetation remaining along the slope. Many rocks (of various
sizes, some of them more than 1 m in diameter) were found on the beach of this island, though it was not clear when and
how they had arrived there. The maximum measured run-up in Kecil island (local name: Panjang island) was 82.5 m, and
parts of the island were actually overtopped (according to key informant interviews, see also Fig. 2c and d). Many of the
vegetation in the islands was dead, due to the seawater overtopping them and the consequences of volcanic ash fall.
According to the key informant interviews, although the island had a small jetty used for tourists visiting Anak Krakatau,
Journal of Coastal and Hydraulic Structures Vol. 1, 2021, paper 1                                                        4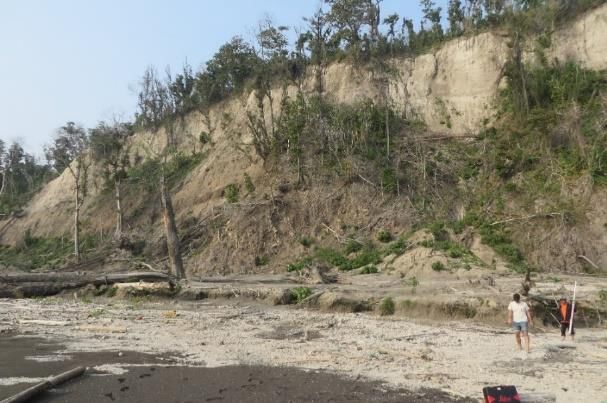
Esteban et al.
this structure was completely washed away as a result of the tsunami. In Sertung island the maximum run-up was 39.9 m
(see Fig. 2e), which was measured according to the damage of the vegetation. At the time of the survey much of Anak
Krakatau had disappeared (see Fig. 2f).
Table 1: Measured tsunami run-up heights.
No Place Latitude (S) Longitude (E) Height (m)
1 Rakata island 6° 08’ 45.49” 105° 25’ 40.53” 46.8
2 Rakata island 6° 08’ 45.64” 105° 25’ 39.92” 49.4
3 Panjang island 6° 05’ 58.93” 105° 27’ 04.23” 82.3
4 Panjang island 6° 05’ 14.64” 105° 27’ 07.20” 82.5
5 Sertung island 6° 06’ 30.96” 105° 22’ 07.61” 39.9
Panjang
Sertung Anak
0.8~2.4 3.4 Krakatau 82.5
4.0~6.8
39.9
(b)
82.3
Sunda Strait 1.0
3.4
10.2~12.6
5.4
2.6
Rakata
46.8 & 49.4
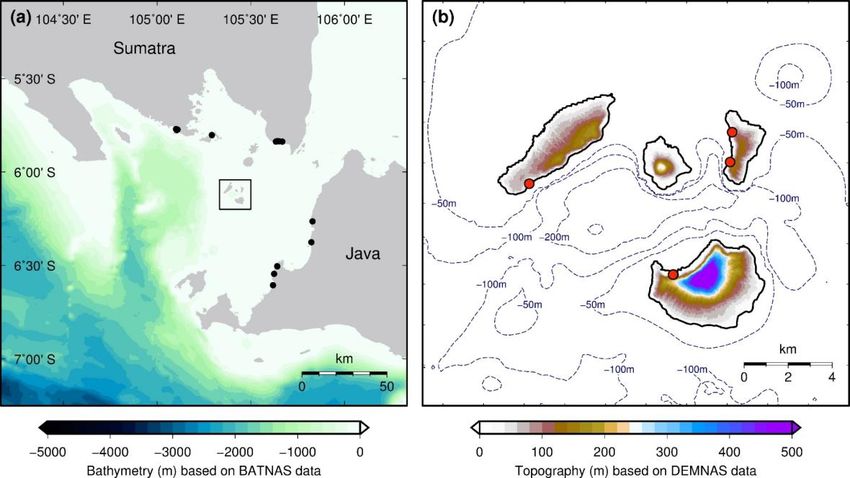
Figure 1: Maps of the area surveyed. Bathymetry and topography are based on BATNAS (resolution: 6-arcsecond) and
DEMNAS (resolution: 0.27-arcsecond) data of Badan Informasi Geospasial (BIG, 2018b Geospatial Information Agency
of Indonesia), respectively. (a) tsunami inundation and run-up heights measured by Takabatake et al. (2019). (b) tsunami
run-up heights measured by the authors on three surrounding islands around Anak Krakatau.
Journal of Coastal and Hydraulic Structures Vol. 1, 2021, paper 1 5
Esteban et al.

                                (a)                                                   (b)

                                (c)                                                   (d)

                                (e)                                                    (f)
Figure 2: (a) Survey points. (a) Run-up survey point in Rakata island (No. 1 in Table 1), (b) Run-up survey point in Rakata
island (No. 2 in Table 1), (c) Run-up survey point in Panjang island (No. 3 in Table 1), (d) Run-up survey point in Panjang
island (No. 4 in Table 1), (e) Run-up survey point in Sertung island (No. 5 in Table 1), (f) Collapsed area in Anak
Krakatau.

3.2 Bathymetry
   Fig. 3 shows the interpolated contour lines obtained from the bathymetric surveys that were carried out. The
bathymetry around the islands is rather complex, probably as a consequence of the dramatic disappearance of the former
Krakatau island in the 19th century. Generally speaking, it is characterized by being fairly deep (with depths of around
200 m) to the southwest of Anak Krakatau. The channel between Panjang and Rakata towards the east is also deep (150-
200 m), while the bathymetry to the north is only 25 to 50 metres in depth.

Journal of Coastal and Hydraulic Structures Vol. 1, 2021, paper 1                                                        6
Esteban et al.

Figure 3: Bathymetric surveys conducted around the Krakatau islands. Continuous blue lines show the track of the two
survey boats.

3.3 Volume of the collapsed slope
    The aerial photographs obtained using the UAV were stitched together to form a map of the surface of the island at
the time of the survey (see Fig. 4). From these images a Digital Elevation Model (DEM) was obtained, with Fig. 5 showing
the elevation of the island before (Fig. 5a-c) and after the survey (Fig. 5d). Figure 6 shows the two transects indicated in
Fig. 5, which highlights how almost the entire island collapsed into the sea.
    The difference between the former and present day DEMs allowed the authors to calculate the volume of the material
that was displaced by the eruption (which formed the landslide that generated the tsunami), see Table 2. According to
this, between 0.286 and 0.574 km3 of material was displaced by the flank collapse.

Figure 4: Stitched map of island from drone photography.

Journal of Coastal and Hydraulic Structures Vol. 1, 2021, paper 1                                                         7
Esteban et al.

                                                                                 Elevation (m)                                                                  Elevation (m)

                                            a)                        AW3D                                                          b)              DENMAS

                                                                         NE
                                            NW

                                                                                                   Latitude
                                 Latitude

                                                 SW
                                                                    SE

                                                        Longitude                                                                            Longitude
                                                                                Elevation (m)                                                                   Elevation (m)

                                                                    SRTM1                                                           d)       Photoscan&UAV
                                            c)
                                 Latitude

                                                                                                   Latitude

                                                        Longitude                                                                            Longitude

Figure 5: Digital Elevation Model (DEM) of the islands. (a) Top left: AW3D data. (b) Top right: DENMAS data. (c)
Bottom left: SRTM data. (d) Bottom right: Present survey (Photoscan & UAV data, 90-percentile case). The SW-NE and
NW-SE vertical transect lines indicated are shown in Figure 6.

                    300                                                                                                       300
                                                                    AW3D                                                                                                        AW3D
                                                                    DENMAS                                                                                                      DENMAS
                    250                                                                                                       250                                               SRTM
                                                                    SRTM
                                                                                                                                                                                UAV&Photoscan (75%-case)
                                                                    UAV&Photoscan (75%-case)
                                                                                                                                                                                UAV&Photoscan (90%-case)
                                                                                                              Elevation (m)
    Elevation (m)

                    200                                             UAV&Photoscan (90%-case)                                  200

                    150                                                                                                       150

                    100                                                                                                       100

                    50                                                                                                        50

                     0                                                                                                         0
                          0       500            1000        1500             2000               2500                               0       500          1000         1500              2000          2500
                              Distance from the south-west edge (m, SW~NE)                                                               Distance from the nouth-west edge (m, NW~SE)

Figure 6: Transects of flank of Anak Krakatau, showing the historical evolution over time and the profile after the 2018
volcanic eruption (from DEM data). The location of the transects is given in Fig. 5. AW3D, DENMAS and SRTM
represent the data available prior to the tsunami, with UAV data representing the authors’ own surveys.

Journal of Coastal and Hydraulic Structures Vol. 1, 2021, paper 1                                                                                                                                            8
Esteban et al.

Table 2: Calculated volume of the material displaced by the eruption.
                                Horizontal        Volume
           Data name                                          Top height (m)             Acquisition period
                                resolution         (km3)
             AW3D                  2.5 m          0.18426           292              During from 2006 to 2011
                               1 arc sec (≈30
              SRTM                                0.18184           277                    February 2000
                                     m)
                                0.27 arc sec
            DEMNAS                                0.16327           260                      After 2006
                                  (≈8 m)
        UAV&Photoscan
                                  0.22 m          0.12690           165                  17th August 2019
          (75%-case)
        UAV&Photoscan
                                  0.22 m          0.13471           168                  17th August 2019
          (90%-case)

3.4 Perimeter survey of the island
   The 360˚ degree panoramic videos produced as part of this survey can be found on
Vimeo ( https://vimeo.com/showcase/6851365 ) and Hatch research blog ( http://www.thehatch.tv/anak-krakatau/ ).
   The Anak Krakatau - Aerial 1 - 7 360 Films were shot on a Nikon KeyMission 360 and allow the viewer to interact
with the film and view the environment in 360 degrees. Unfortunately, the visibility of the underwater 360 film was less
than one metre, given the large amount of suspended particles in the water column. Hence, none of this footage rendered
anything of interest and are not included in the links given above.
    There are two Anak Krakatau aerial UAV (Drone shots) that give the viewer a sense of location of the overhead
terrain. From the films 001 - 012 Handheld it is possible to obtain a visual sense of the run-up heights and loss of
vegetation in the surrounding islands.
    Additionally, the authors collected a number of videos of the event from some of the officers stationed in the islands.
These 001 to 011_Guard films are also included in this vimeo showcase, showing a range of eruptions from Anak
Krakatau as the event was unfolding. There are a number of photographs also provided on the Hatch blog that were taken
at the same time of filming, both from the guards and during the field survey.

4      Discussion
    The measured run-up heights shown in Fig. 1 correlate well with the results of Grilli et al. (2019), who correctly
identified that high-run ups would take place along Sertung and Rakata (they identified that the runup would be at least
45 m on the directly exposed steep shores of those islands, with 39.9 m being measured in the present survey along
Sertung). However, Grilli et al. (2019) failed to reproduce the run-ups of Kecil (Panjang island), where the interviews
with local officials and evidence on the ground (see Fig. 2a) indicate the island was overtopped. The authors measured
run-up as high as 60-80 m, whereas Grilli et al. (2019) indicate that refraction around the volcano would result on run-
ups of 15-25 m. At the southern side of Palau Sertung Borrero et al. (2020) report run-up heights of just around 50 m,
raising to over 80 m. The authors only surveyed one point here, given that further north those interviewed indicated that
the wave went over the island (thus it is not clear whether actually reporting the run-up height would be a good measure
of this value). In the area of Rakata surveyed by the authors Borrero et al. (2020) indicate run-ups of 60 m, though they
reported difficulty in obtaining results from Panjang.
    Then, the authors analysed and try to estimate the volume of material that was lost during the eruption, which was
estimated at 0.286-0.574 km3 (which compares to the range of 0.22-0.30 km3 estimated by Grilli et al. (2019), and could
at least partly indicate the difference in run-up heights).

Journal of Coastal and Hydraulic Structures Vol. 1, 2021, paper 1                                                        9
Esteban et al.
The field results have important implications for the simulation of tsunamis that could be caused by the future flank
collapses of Anak Krakatau, and the importance of source directionality (i.e. the primary direction of the propagation of
the tsunami as it propagates over the ocean). Takabatake et al. (2019) and TDMRC (2019) reported how the 2018 event
caused relatively higher inundation and run-up heights in the north-north-eastern direction from Anak Krakatau (i.e.,
Central Waymuli–Kahai Beach), with a maximum surveyed run-up height of 6.8 m. In Java island, significantly higher
inundation and run-up heights were measured at Cipenyu Beach (Pandeglang Regency), located to the south-south-eastern
direction from Anak Krakatau, with over 10 m inundation and run-up heights being recorded. Essentially, the tsunami
generated by the flank collapse of Anak Krakatau was partially blocked by the island around it (with, for example, Sertung
island preventing the propagation of the tsunami towards Sinar Agung and Bandung Jaya).
This tsunami was generated in shallow water, and would have had a short wavelength than subduction fault tsunamis
(Takabatake et al., 2020). The fact that the bathymetry was rather deep (over 200 m) in the southwest direction from Anak
Krakatau would have helped the tsunami wave propagate in this direction away from the islands of Sumatra and Java,
which can explain why inundation heights in the populated coastline in these islands was limited, see Fig. 1). However,
the opening is rather large in this direction, which would have helped the tsunami wave energy disperse into the wider
ocean.
While the main flank collapse appears to have been towards the south/south-west, the tsunami would have reflected
off Rakata island towards the north. There is also the possibility that part of the volcanic collapse would have been towards
the north (or other directions), explaining the considerable run-up in the other islands in the group. However, the
bathymetry to the north of this group of islands is relatively shallow (around ~25 m in most area). This would have
hindered propagation (due to a reduced flow rate due to the low celerity of the tsunami). The high density of the tsunami
wave would have resulted in the tsunami growing in height, possibly causing some localized wave-breaking (though this
last effect would have been minor). The worst inundation heights recorded by Takabatake et al (2018) were in western
Java, which would have been facilitated by the slightly deeper bathymetry between Panjang and Rakata. However, far
more important than the bathymetry is the effect of the shielding provided by the islands themselves, which would have
reflected much of the wave energy and contained it within the inside of the archipelago. Also, the possibility that in such
complex bathymetry the tsunami could have generated edge waves remains a (speculative) possibility, as has been
indicated by research conducted on the characteristics of the 2011 Tohoku Earthquake and Tsunami in some areas
(Koyano et al., 2020).
There were considerable challenges and limitations involved in this field survey. First of all, it took place months after
the actual the flank collapse, meaning that by then some vegetation had regrown, and the authors could only obtain a
lower limit of the possible run-ups that took place. In some cases, these measurements were based on long distance
estimates, given that it was physically impossible to climb the steep side of the mountains (which are uninhabited).
The bathymetry measurements that were carried out can provide a rough indication of the overall bathymetry in the
area. However, there were very clear and abrupt changes in bathymetry in short distances, indicating the presence of very
steep underwater cliffs and rough edges. To obtain a full picture it would probably be necessary to conduct multi-beam
measurements and spend considerable time mapping the area. Nevertheless, the data obtained can provide modellers with
a better estimation than previously existing maps.
It should be noted that ground control points (GCPs) were not employed, and thus a precise validation of the ground
elevation between the DEM and the actual topography were not carried out (it took the authors four hours to climb to the
top of Anak Krakatau, and there was the risk of further volcanic eruptions). This may lead to some error, and explain the
range of collapse volumes reported previous studies. Nevertheless, the maximum height for the 75- and 90-cases was
165 m and 168 m, which was in good agreement with a maximum height of 157 m reported in LCDV (2015). It should
also be noted that the estimated volume of frank collapse is the accumulated change from the start of the event to the
survey date (i.e. around 8 months). Williams et al. (2019) pointed out the possibility that the volume of the loss that
initially occurred and the generated tsunamis could have been smaller.
In light of the data presented here further numerical modelling is needed to fully clarify this event. Takabatake et al.
(2019) indicated how local residents reported two waves (separated by between 2-5 min), with the second wave being
higher than the first. This would indicate a short wavelength, which would make this similar to the 2015 Taan Fiord
tsunami (Higman et al. 2018) and the 2018 Palu tsunami (Takagi et al. 2019; Mikami et al. 2019). The 2018 event was
clearly smaller in scale than the 1883 eruption of Krakatau, where tsunami heights of 15-22 were recorded in Sumatra
Journal of Coastal and Hydraulic Structures Vol. 1, 2021, paper 1 10Esteban et al.
island and run-up heights of 35 m in western Java (Symons 1888; Pararas-Carayannis 2003). However, it is also
interesting to note that the tsunami period and wavelength (estimated to be 5 minutes and 7 kilometres, respectively),
were similar to those of the present event. This would indicate the need to make a clear distinction between earthquake
and landslide generation mechanisms regarding the resulting tsunami wave periods.
5 Conclusions
The authors surveyed the Krakatau group of islands with the intention of clarifying the run-up heights that took place
after the 2018 Sunda Straight tsunami, and documented the current situation of the islands. Run-up heights of at least
82.5 m, 49.4 m and 39.9 m, were measured along Panjang, Rakata and Sertung islands, respectively. The high run-ups
measured along Panjang island were corroborated through visual observations of the erosion caused by the overtopping
tsunami waves and key informant interviews, and were intriguing given the expected source directionality due to the flank
collapse of Anak Krakatau (towards the SW). The shelter effect given by the islands helped to explain the variation in
wave inundation and run-up patterns along Sumatra and Java island reported in other field surveys.
Using DEM of Anak Krakatau before and after the eruptions and tsunami, the authors could calculate the volume of
flank collapse on December 2018, which was estimated to be 0.286-0.574 km3. Furthermore, the authors performed new
bathymetric measurements around Anak Krakatau island, which will provide valuable input for tsunami generation and
propagation simulations. Being able to obtain accurate results from such simulations is crucial for practicing engineers
and disaster risk managers to be able to formulate adequate countermeasures and design infrastructure that can withstand
the effects of tsunamis.
Acknowledgements
The field survey was financially supported by JST J-RAPID Grant Number JPMJJR1801, Penta Ocean Co. Ltd and
New CC Construction Consultants Co. The present work was performed as a part of activities of Research Institute of
Sustainable Future Society, Waseda Research Institute for Science and Engineering, Waseda University. The authors
would also like to acknowledge the contribution of two anonymous reviewers, whose comments greatly helped to improve
the quality of the manuscript. Also, the authors would like to thank the BKSDA (Indonesia Nature Conversation Agency)
for the SIMAKSI (permission to enter the Krakatau area), and the support provided from their staff in the area.
Author contributions (CRediT)
ME: Fieldwork, Methodology, Writing-original draft. TT: Fieldwork, Methodology, Manuscript draft review and
editing. HA: Fieldwork, Logistics. TM: Fieldwork, Methodology, Manuscript draft review and editing. RN: Fieldwork,
Methodology, DEM analysis. MG: Fieldwork, Key informant interviews. SP: Fieldwork, Bathymetry surveys. YN:
Fieldwork, Bathymetry Interpolation and Analysis. NI: Fieldwork, Analysis. CC: Visualization, Video Image Analysis.
KO: DEM Analysis. TS: Project Planning, Methodology, Funding Acquisition, Project Administration, Manuscript Draft
Review.
References
Badan Informasi Geospasial (2018a): Seamless Digital Elevation Model (DEM) dan Batimetri Nasional. Accessed on 11
November 2019. http://tides.big.go.id/DEMNAS/
Badan Informasi Geospasial (Agency for Geospatial Information) (Meteorology and Geophysics Agency of Republic of
Indonesia) (2018b). http://ina-sealevelmonitoring.big.go.id/ Accessed on 10 February 2019.
Borrero, J, C., Solihuddin, T., Fritz, H. M., Lynett, P. J., Presetya, G.S., Skanavis, V., Husrin, S., Kushendratno,
Kongko, W., Istiyanto, D. C., Daulat, A., Purbani, D., Salim, H. L., Hidayat, R., Asvaliantina, V., Usman, M.,
Kodijat, A., Son, S., and Synolakis, C. E. (2020): Field survey and numerical modelling of the December 22, 2018
Anak Krakatau Tsunami. Pure and Applied Geophysics, 177, https://doi.org/10.1007/s00024-020-02515-y
Brideau, M. A., M. Sturzenegger, D. Stead, M. Jaboyedoff, M. Lawrence, N. J. Roberts, and Clague J. J. (2012): Stability
analysis of the 2007 Chehalis lake landslide based on long-range terrestrial photogrammetry and airborne LiDAR
data. Landslides, 9(1), 75–91. https://doi.org/10.1007/s10346-011-0286-4
Journal of Coastal and Hydraulic Structures Vol. 1, 2021, paper 1 11Esteban et al.
Choi, B. H., Pelinovsky, E., Kim, K. O., and Lee, J. S. (2003): Simulation of the trans-oceanic tsunami propagation due
to the 1883 Krakatau volcanic eruption. Natural Hazards and Earth System Sciences, 3:321-332.
https://doi.org/10.5194/nhess-3-321-2003
Esteban, M., Takagi, H., Mikami, T., Bahbouh, L., Becker, A., Nurse, L., Shibayama, T., Nagdee, M. (2018) How to
Carry Out Bathymetric and Elevation Surveys on a Tight Budget: Basic Surveying Techniques for Sustainability
Scientists. International Journal of Sustainable Future for Human Security, 5(2):86-91.
http://doi.org/10.24910/jsustain/5.2/8691
Farr, T.G., Rosen, P.A., Caro, E., Crippen, R., Duren, R., Hensley, S., Kobrick M., Paller, M., Rodriguez, E., Roth, L.,
Seal, D., Shaffer, S., Shimada, J., Umland, J., Werner, M., Oskin M., Burbank, D., Alsdorf, D. (2007): The shuttle
radar topography mission. Reviews of Geophysics, 45:RG2004. http://doi.org/10.1029/2005RG000183
Fritz, H. M., Hillaire, J. V., Molière, E., Wei, Y. and Mohammed, F. (2013): Twin Tsunamis Triggered by the 12 January
2010 Haiti Earthquake. Pure and Applied Geophysics, 170, 1463–1474. https://doi.org/10.1007/s00024-012-0479-3
Geospatial Information Authority of Japan. (2018): Geomorphic change observed by Synthetic Aperture Radar (SAR).
December 25 2018. Accessed 10 February 2019. http://www.gsi.go.jp/cais/topic181225-index-e.html
Giachetti, T., Paris, R., Kelfoun, K., Ontowirjo, B. (2012): Tsunami hazard related to a flank collapse of Anak Krakatau
Volcano, Sunda Strait, Indonesia. Geological Society, London, Special Publications, 361:79-90.
https://doi.org/10.1144/SP361.7
Genevois, R. and Ghirotti, M. (2005): The 1963 Vaiont landslide. Giornale di Geologia Applicata, 1, 41–52. doi:
10.1474/GGA.2005-01.0-05.0005
Grilli, S. T., Tappin, D. R., Carey, S., Watt, S. F. L., Ward, S. N. Grilli, A R. Engwell, S. L., Zhang, C., Kirby, J. T.,
Schambach, L. and Muin, M. (2019): Modelling of the tsunami from the December 22, 2018 lateral collapse of Anak
Krakatau volcano in the Sunda Straits, Indonesia. Scientific Reports, 9:11946. https://doi.org/10.1038/s41598-019-
48327-6
Harnantyari, A., Takabatake, T., Esteban, M., Valenzuela, P., Nishida, Y., Shibayama, T., Achiari, H., Rusli, Marzuki,
A., Marzuki, M., Aránguiz, R. and Thit Oo Kyaw. (2020): Tsunami awareness and evacuation behaviour during the
2018 Sulawesi Earthquake tsunami. International Journal of Disaster Risk Reduction, 43, 101389.
doi:10.1016/j.ijdrr.2019.101389
Heidarzadeh, M., Ishibe, T., Sandanbata, O., Muhari, A., Wijanarto, A. B. (2020): Numerical modeling of the subaerial
landslide source of the 22 December 2018 Anak Krakatoa volcanic tsunami, Indonesia. Ocean Engineering, 195,
106733.
Higman, B., Shugar, D.H., Stark, C.P., Ekström, G., Koppes, M.N., Lynett, P., Dufresne, A., et al. (2018): The 2015
landslide and tsunami in Taan Fiord, Alaska. Scientific Reports, 8:12993. https://doi.org/10.1038/s41598-018-30475-
w
Hoffman‐Rothe, A., Ibs‐von Seht, M.,Knieβ, R., Faber, E., Klinge, K., Reichert, C., Purbawinata, M.A., and Patria, C.
(2006): Monitoring Anak Krakatau Volcano in Indonesia. Eos, Transactions American Geophysical Union,
87(51):581-586. https://doi.org/10.1029/2006EO510002
Koyano, K., Takabatake, T., Esteban, M. and Shibayama, T. (2020) Influence of edge waves on tsunami characteristics
along Kujukuri beach, Japan, Journal of Waterway, Port, Coastal and Ocean Engineering 147 (1)
https://ascelibrary.org/doi/10.1061/%28ASCE%29WW.1943-5460.0000617
Lauterjung, J., Münch, U., and Rudloff, A. (2010): The challenge of installing a tsunami early warning system in the
vicinity of the Sunda Arc, Indonesia, Nat. Hazards Earth Syst. Sci., 10, 641–646, https://doi.org/10.5194/nhess-10-
641-2010.
LCDV (2015): Indonesie, Anak Krakatau. https://lechaudrondevulcain.com/blog/2019/10/21/october-21-2019-en-
kamchatka-ebeko-indonesia-anak-krakatau-guatemala-pacaya-costa-rica-turrialba-poas-rincon-de-la-vieja/
Maeno, F., Imamura, F. and Taniguchi, H. (2006): Numerical simulation of tsunamis generated by caldera collapse during
the 7.3 ka Kikai eruption, Kyushu, Japan. Earth Planets Space, 58(8):1013-1024. https://doi.org/10.1186/BF03352606
Maeno, F., and Imamura, F. (2011): Tsunami generation by a rapid entrance of pyroclastic flow into the sea during the
1883 Krakatau eruption, Indonesia. Journal of Geophysical Research, 116:B09205.
https://doi.org/10.1029/2011JB008253
Mikami, T., Shibayama, T., Esteban, M., Takabatake, T., Nakamura, R., Nishida, Y., Achiari, H., Rusli, Marzuki, A. G.,
M, Marzuki, M. F. H., Stolle, J., Krautwald, C., Roberton, I., Aranguiz, R. and Ohira, K. (2019): Field Survey of the
Journal of Coastal and Hydraulic Structures Vol. 1, 2021, paper 1 12Esteban et al. 2018 Sulawesi Tsunami: Inundation and Run-up Heights, and Damage to Coastal Communities. Pure and Applied Geophysics, 176:3291-3304. https://doi.org/10.1007/s00024-019-02258-5 Muhari, A., Heidarzadeh, M., Susmoro, H. Nugroho, H. D., Kriswati, E., Supartoyo, Wijanarto, A. B., Imamura, F. and Arikawa, T. (2019): The December 2018 Anak Krakatau Volcano Tsunami as Inferred from Post-Tsunami Field Surveys and Spectral Analysis. Pure Appl. Geophys., 176, 5219–5233. https://doi.org/10.1007/s00024-019-02358-2 National Disaster Management Agency (BNBP). (2019): Tsunami Sunda Strait (Update 14 January 2019)., Accessed 06 May 2019. Dataset no longer available online. Panizzo, A., De Girolamo, P., Di Risio, M., Maistri, A. and Petaccia, A. (2005): Great landslide events in Italian artificial reservoirs. Natural Hazards Earth and System Sciences, 5, 733–740. doi:10.5194/nhess-5-733-2005 Pararas-Carayannis, G. (2003): Near and far-field effects of tsunamis generated by the paroxysmal eruptions, explosions, caldera collapses and massive slope failures of the Krakatau volcano in Indonesia on August 26–27, 1883. Science of Tsunami Hazards, 21(4):191-201. Paris, A., Heinrich, P., Paris, R. and Abadie, S. (2019): The December 22, 2018 Anak Krakatau, Indonesia, Landslide and Tsunami: Preliminary Modeling Results, Oure and Applied Geophysics, 177 , 571-590. Paris, R., Switzer, A. D., Belousova, M., Belousova, A., Ontowirjo, B., Whelley, P. L., Ulvrova, M. (2014): Volcanic tsunami: A review of source mechanisms, past events and hazards in Southeast Asia (Indonesia, Philippines, Papua New Guinea). Natural Hazards, 70(1):447-470. https://doi.org/10.1007/s11069-013-0822-8 Ren, Z., Wang, Y., Wang, P., Hou, J., Gao, Y. and Zhao, L. (2020) Numerical study of the triggering mechanism of the 2018 Anak Krakatau tsunami: eruption or collapsed landslide? Natural Hazards 102, 1-13. Robertson, I., Head, M., Roueche, D., Wibowo, H., Kijewski-Correa, T., Mosalam, K., Prevatt, D. (2018): STEER – Sunda Strait Tsunami (Indonesia): Preliminary Virtual Assessment Team (P-VAT) Report, DesignSafe-CI [publisher], Dataset. doi:10.17603/DS2Q98T Rudloff, A., Lauterjung, J., Münch, U., and Tinti, S.(2009): Preface "The GITEWS Project (German-Indonesian Tsunami Early Warning System)", Nat. Hazards Earth Syst. Sci., 9, 1381–1382, https://doi.org/10.5194/nhess-9-1381-2009. Sassa, S. and Takagawa, T. (2019): Liquefied gravity flow-induced tsunami: first evidence and comparison from the 2018 Indonesia Sulawesi earthquake and tsunami disasters. Landslides, 16(1), 195–200. doi:10.1007/s1034 6-018-1114-x Stolle, J., Krautwald, C., Robertson, I., Achiari, H., Mikami, T., Nakamura, R., Takabatake, T., Nishida, Y., Shibayama, T., Esteban, M., Nistor, I. and Goseberg, N. (2020): Engineering Lessons from the 28 September 2018 Indonesian Tsunami: Debris Loading. Canadian Journal of Civil Engineering, 47(1), 1–12. doi:10.1139/cjce-2019-0049 Syamsidik, Benazir, Luthfi, M., Suppasri, A., and Comfort, L.K. (2020): The 22 December 2018 Mount Anak Krakatau volcanogenictsunami on Sunda Strait coasts, Indonesia: tsunami anddamage characteristics. Nat. Hazards Earth Syst. Sci., 20(2):549-565. https://doi.org/10.5194/nhess-20-549-2020 Symons, G.J., ed. (1888): The Eruption of Krakatoa ans Subsequent Phenomena. Report of the Krakatoa Committee of the Royal Society. London: Trubner and Co. Takabatake, T, Mäll, M., Esteban, M., Nakamura, R., Kyaw, T.O., Ishii, H., Valdez, J.J., Nishida, Y., Noya, F., and Shibayama, T. (2018): Field Survey of 2018 Typhoon Jebi in Japan: Lessons for Disaster Risk Management. Geosciences, 8(11):412. https://doi.org/10.3390/geosciences8110412 Takabatake, T., Shibayama, T., Esteban, M., Achiari, H., Nurisman, N., Gelfi, M., Tarigan, T. A., Kencana, E. R., Fauzi, M. A. R., Panalaran, S., Harnantyari, A S. and Kyaw, T. O. (2019): Field survey and evacuation behaviour during the 2018 Sunda Strait Tsunami. Coastal Engineering Journal, 61(4):423-443. https://doi.org/10.1080/21664250.2019.1647963 Takabatake, T., Mäll, M., Han, D. C., Inagak, N., Kishizaki, D., Esteban, M., & Shibayama, T. (2020): Physical Modelling of Tsunamis Generated by Subaerial, Partially Submerged and Submarine Landslides. Coastal Engineering Journal (accepted). Takagi, H., Bintang, M., Shota, K., Esteban, M., Aranguiz, R., and Ke., B. (2019): Analysis of generation and arrival time of landslide tsunami to Palu City due to the 2018 Sulawesi earthquake., Landslides, 16:983-991. https://doi.org/10.1007/s10346-019-01166-y Takaku, J. and Tadono, T. (2017): Quality updates of ‘AW3D’ global DSM generated from ALOS PRISM. Proceeding of IGARSS 2017, IEEE, Fort Worth, TX, USA, 5666-5669. https://ieeexplore.ieee.org/document/8128293/ Journal of Coastal and Hydraulic Structures Vol. 1, 2021, paper 1 13
Esteban et al.

Tappin D. R., Watts, P., McMurtry, G. M., Lafoy, Y. and Matsumoto, T. (2001): The Sissano, Papua New Guinea tsunami
   of July 1998-offshore evidence on the source mechanism. Marine Geology, 175:1–23. doi:10.1016/S0025-
   3227(01)00131-1
Tappin, D. R., Watts, P. and Grilli, S. T. (2008): The Papua New Guinea tsunami of 1998: anatomy of a catastrophic
   event. Nat. Hazards Earth Syst. Sci., 8, 243–266. doi:10.5194/nhess-8-243-2008
TDMRC (Tsunami and Disaster Mitigation Research Center, Syiah Kuala University). (2018): The 2018 Sunda Strait
  Tsunami Impacts Assessment. http://tdmrc.unsyiah.ac.id/the-2018-sunda-strait-tsunami-impacts-assessment/
  Accessed on 10 February 2018.
TDMRC (Tsunami and Disaster Mitigation Research Centre, Syiah Kuala University). (2019): The Latest Update from
  Post Sunda Strait Tsunami Survey. http://tdmrc.unsyiah.ac.id/the-latest-update-from-post-sunda-strait-tsunami-
  survey/ Accessed on 11 February, 2019. Accessed on 10 February 2018.
Van den Bergh, G.D., Boer, W., de Haas, H., van Weering, Tj.C.E., and van Wijhe, R. (2003): Shallow marine tsunami
   deposits in Teluk Banten (NW Java, Indonesia), generated by the 1883 Krakatau eruption. Marine Geology, 197(1):13-
   34. https://doi.org/10.1016/S0025-3227(03)00088-4.
Waythomas, C. F., and Watts, P. (2003): Numerical simulation of tsunami generation by pyroclastic flow at Aniakchak
  volcano, Alaska. Geophysical Research Letters, 30(14):1751. https://doi.org/10.1029/2003GL017220
Williams, R., Rowley, P., and Garthwaite, M.C. (2019): Reconstructing the Anak Krakatau flank collapse that caused the
   December 2018 Indonesian tsunami. Geology, 47(10):973–976. https://doi.org/10.1130/G46517.1

Journal of Coastal and Hydraulic Structures Vol. 1, 2021, paper 1                                                  14
You can also read


