Numerical simulation of wind field and sand flux in crescentic sand dunes
←
→
Page content transcription
If your browser does not render page correctly, please read the page content below
www.nature.com/scientificreports
OPEN Numerical simulation of wind field
and sand flux in crescentic sand
dunes
Huiwen Zhang1, Zhen Wu2,3*, Jing Hu1, Zhiping Zhang1, Bin Xiao1 & Jianping Ma1
Sand flux is the key factor to determine the migration of sand dunes and the erosion to the
surrounding environment. There are crescent-shaped sand dunes of various scales in the desert, and
there are significant differences in spatial wind field and sand flux among them. However, due to
the difficulty of monitoring, it is difficult to continuously observe the spatial wind field and sand flux
around the larger crescentic dunes. On the basis of the Reynolds-Average Navier–Stokes (RA-NS)
equation and the stress and sand flux model, the distribution of wind field and sand flux of a circular
dune with a height of 4.2 m and a length of about 100 m during the four evolutionary periods of the
evolution into a crescentic dune was simulated in this study. By comparing with the measured results,
we verified that the closer to the leeward side, the more the simulated values of the velocity in wind
field and sand flux were in line with the measured results. In order to further analyze the influence of
the height of dune and other relevant parameters on sand flux, we simulated the influence on wind
field and sand flux by changing the air viscosity and wind velocity of upper boundary. We found that
the air viscosity mainly affected the amount of deposited sand on the leeward side of sand dune, while
the increase of wind velocity would undoubtedly increase the sand flux of the whole sand dune. In
addition, the simulation results also showed that the influence of changes in height of dune on the
turbulent intensity of leeward side was very significant, and the turbulent intensity increased with the
height of dune. The height changes of tall dunes gradually affected the transport of sand caused by
wind flow behind the leeward side because that the rotation of the wind flow would form new vortexes
at the large pores behind the leeward side, which would increase the turbulent energy in space and
thus would increase the distance of migration of the lifting sand. While the low sand dunes could not
form extra small vortexes at the bottom of the leeward side, so the wind velocity was small and the
eddy currents behind the leeward side were more stable. The simulation results indicated that wind
velocity was not the only reason for increasing the amount of sand flux, and the fluctuation of wind
flow caused by turbulence could also stimulate the movement of sand particles on the ground.
Understanding the migration mechanism and the deposition process of crescentic dunes have important guiding
role in preventing and controlling wind-sand d isasters1–4. Under the action of unidirectional wind, sand dunes
of different scales have great differences in sand flux and spatial distribution of wind fi eld5–7. Moreover, the dif-
ferences in recharge of sand source and wind condition can also lead to the differences of spatial sand fl ux8,9, so
many of the larger crescentic dunes near the oasis edge pose a potential threat to the sounding environment.
It is well known that the structure of wind-sand flow is strongly influenced by the properties of underlying
surface. Some studies have found that the sand content in the wind-sand flow decreases exponentially with
the increase of h eight10–12. However, some other studies have shown that the sand flux presents a square root
decreasing relationship with height13,14. The results of the previous studies have been obtained through measured
observations, and have not yielded uniform conclusions15,16. Therefore, the present observation conclusion is that
there is a large spatial heterogeneity of sand flux and wind field distribution in different locations and heights
of crescentic dunes. In order to obtain the specific understanding of the sand flux and wind field distribution
in different locations of crescentic dunes, it is necessary to carry out continuous observation of the wind field
around the dunes of different scale.
1
State Key Laboratory Breeding Base of Desertification and Aeolian Sand Disaster Combating, Gansu Desert
Control Research Institute, Lanzhou 730070, China. 2Lanzhou Geophysical National Field Scientific Observation
and Research Station, Earthquake Administration, Earthquake Administration of Gansu Province, Lanzhou 730000,
China. 3Key Laboratory of Loess Earthquake Engineering, China Earthquake Administration, Lanzhou 730000,
China. *email: wuzhen@lzb.ac.cn
Scientific Reports | (2021) 11:4973 | https://doi.org/10.1038/s41598-021-84509-x 1
Vol.:(0123456789)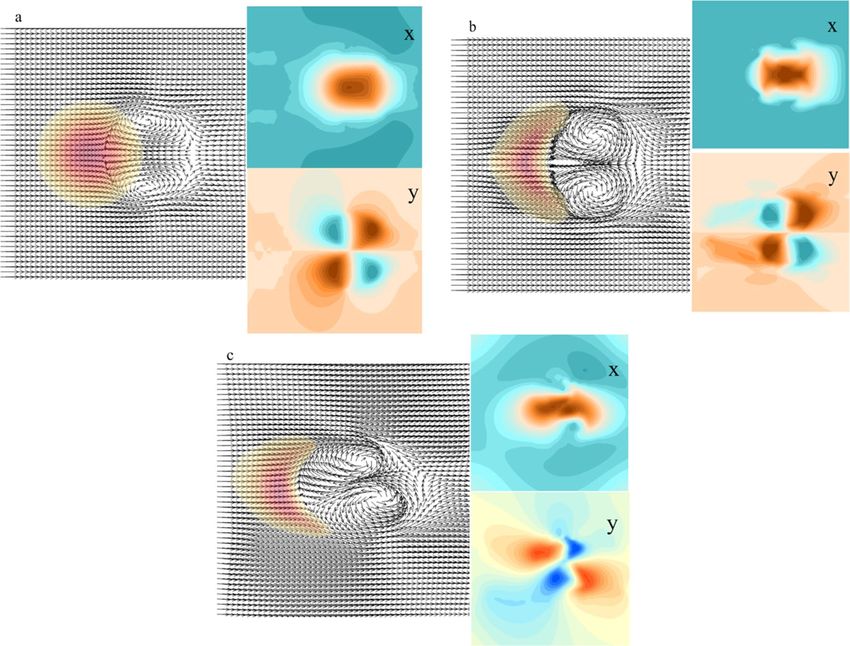
www.nature.com/scientificreports/
Unfortunately, larger-scaled observations of crescentic dunes greatly increase the work load of field moni-
toring. Moreover, conventional observations are not only burdensome but also lack continuity in spatial obser-
vations. Althoughmany scholars have used more convenient methods and means to carry out researches on
migration and deposition of sand dunes, such as wind tunnel e xperiments17–20, remote sensing survey21–23 and
so on, it is still difficult to continuously show the variation of wind field and sand flux at different positions and
heights of sand dunes of different scale, and it is also difficult to give the detailed structure of wind flow field and
the distribution of shear stress in continuous space. To compensate for this defect, many scholars began to use
numerical simulation to analyze the changes of wind flow field in sand dunes13,24–28. Most of the previous numeri-
cal methods are used to simulate smaller dunes, because the simulation of small dunes take a short time, which
mainly to solve the problem that the turbulence behind the leeward side is not separated, and then to obtain
the disturbance characteristics of shear stress and wind field. However, due to the changeable turbulence of the
leeward side in the actual situation, this numerical method can not accurately reflect the influence of turbulence.
With the improvement of computing efficiency of computers in recent years, many scholars have begun to
use complex models such as Reynolds-Average Navier–Stokes (RA-NS) equation to simulate the changes of wind
flow field29–33. Many equations are applied to viscous fl uid1,29,34,35 and many simulation equations about pure
wind field are applied to sand migration and e rosion36–38. But until now, it has not been reported to carry out a
combinatorial continuous simulation study on wind velocity, wind field, spatial sand flux and their influencing
factors of crescentic dunes. The aim of our study was to fill this gap. Firstly, the purpose of this study was to
evaluate the simulation effect of the RA-NS equation on two-dimensional wind field and flow field, and secondly,
to analyze the spatial relations and influencing factors of wind flow field and sand flux. To achieve these goals,
three problems were analyzed by numerical simulation in this study: (1) Changes of wind field and sand flux
around the sand dune during evolution; (2) Influence of different heights of sand dune and turbulences behind
the leeward side on sand flux; (3) Variation in the amount of sand flux caused by the height of dune and wind
velocity of boundary. The results of this study could provide a theoretical reference for the researches on surface
erosion and migration of crescentic sand dunes of different scale.
Research methods and numerical simulations
Simulation of wind flow. Because of the complexity of turbulence in the wind field, we used the RA-NS
equation29,39 to simulate the wind field, which performs well in the fluid simulation. RA-NS equation is widely
used in various engineering problems, including compressed flow, two-phase flow, uncompressed flow of
constant matter and so on40. The related simulation theory is called the theory of turbulent mode. The theory
assumes that the variables in turbulent flow field are composed of a time-averaged variable and a pulsating
quantity variable, and then a NS equation with uniform variation on the time scale can be obtained. The specific
methods are as follows: the various physical parameters of fluid are expressed as stable pulsating values, and
some parameters can also be averaged, then the governing equation of the statistical average physical quantities
can be obtained. The continuous equation and the momentum equation are shown as follows:
∂ρ ∂(ρui )
+ =0 (1)
∂t ∂xi
′ ′
′ ′
∂ν
′ ′ ∂ν ∂p′ 1 ∂ 2 νx ∂ 2 νx
νx x′ + νy x′ = − ′ + ′2 + ′ (2)
∂x ∂y ∂x Re ∂x ∂y 2
′ ′
∂ 2 νy ∂ 2 νy
′ ′
′∂ν ′ ∂ν ∂p′ 1
νx x′ + νy x′ = − ′ + ′ + ′ (3)
∂x ∂y ∂x Re ∂x 2 ∂y 2
ν Vr, D is the diameter of the sand particles, v = 1.46 × 10 m s . ν represents the viscous coefficient
–5 2 −1
where Re = ρD
of the air. u represents the calculated mean velocity of wind. Vr is the relative velocity between sand particle and
wind field. To obtain accurate and stable results, constant uniform wind field was used in this study.
Simulation of sand flux. Wind in different directions will cause different shear stress on the surface of
sand dunes, and the amount of sand flux is mainly affected by the magnitude of the shear stress. The greater
the shear stress, the greater the amount of sand flux. Burkow equation was used to describe sand flux in this
study41,42:
∂h
+ ∇(xi,yi) · q(τ (u)) = 0 (4)
∂x
where q is a relation function between transmission rate and shear stress. Because shear stress is related to
the velocity of wind, so q can be expressed as follows:
3
4τ (u) 2
qs = ε (s − 1)gds3 · − τc (5)
ρf (s − 1)gds
Scientific Reports | (2021) 11:4973 | https://doi.org/10.1038/s41598-021-84509-x 2
Vol:.(1234567890)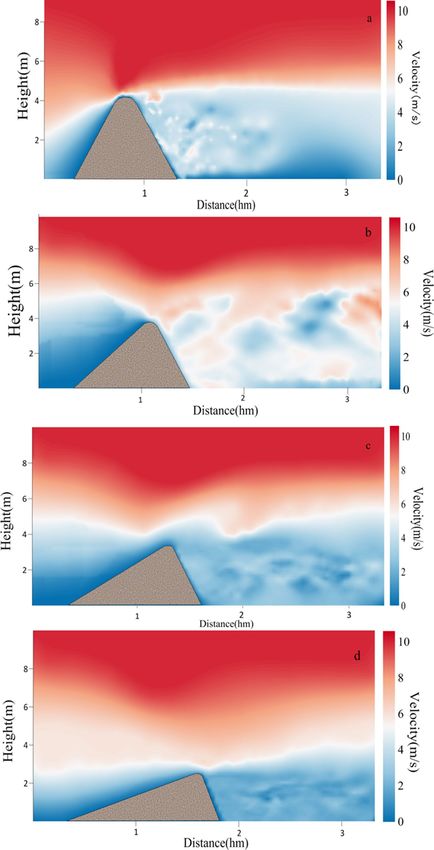
www.nature.com/scientificreports/
1
τ (u) = ρf f |u|2 (6)
8
where ρ denotes the sediment density, ds is the median scale of sand particles (3 mm), τc is the critical shear
stress (the value of it is 0.05). s = ρs /ρf with ρf being the fluid density. The value of ε is 10–8. The f in Eq. (6) is
expressed as 64/Re.
The interaction force between particles and fluid. In general, moving sand particles are subjected to
drag force of airflow, electrostatic force and gravity in the wind field. Among them, the drag force of air flow and
the gravity of sand particles have the greatest influence on the motion of sand particles. This study ignored the
influence of electrostatic force. And the other parameters are expressed as follows.
For nearly spherical sand particles, their gravity Fg can be expressed as follows:
1
Fg = πρg D3 g (7)
6
where ρg is the density of sand particles, D is the diameter of sand particles, g is the acceleration constant of
gravity.
According to the research of Anderson and Haff43, the drag force of wind field on sand particles can be
expressed as follows:
1
FD = CD πD2 |Vr |Vr (8)
8
where Vr is the relative velocity between sand particles and wind field, which can be expressed as follows:
(9)
Vr = (u − uD ) + (v − vD )
where uD and vD represent the velocity of sand particles in the horizontal and vertical directions, respectively. CD
is the resistance coefficient, which can be calculated by the following empirical equation:
4.8
CD = (0.63 + 1 )2 (10)
Re 2
where Re denotes the Reynolds coefficient. The fluid pressure gradient causes shear stress in the velocity direc-
tion, resulting in an updraft. It can be expressed as follows:
1
Fl = πρa Cl D2 uup 2 2
− udown (11)
8
where uup and udown are the wind velocity of sand particles at the upper and lower boundary, respectively. And
Cl is the rising force coefficient, which value is 0.85 times of CD . So the migration equation of sand particles can
be written as follows:
dUD
mp = Fg + FD + Fl (12)
dx
where mp is the mass of sand particle.
Simulation of sand flow deposition and morphological evolution. According to Eq. (4), the shear
stress of wind on the surface of sand dunes has a threshold value44, that is, the maximum amount of sand flux
that wind can carry. Burkow equation also can be writen to describe the morphological changes of sand dunes.
∂h
ρs + ∇q = 0 (13)
∂x
where ρs is the density of sand flow phase, h = h (x, y, t) and q = q (x, z, t) are height of dune and total vertically
intergrated sand flux. The sand transportation can be described in terms of two species, saltation and reptation.
An empirical e quation45 was used to describe the effect of wind velocity on the leaping sand flow here:
ρ
Csat gg u∗ (u∗ + 7.6ut + 2.05) u∗ > ut
qsat = (14)
0 u∗ ≤ ut
where Csat is the correction factor with a value of 0.5. g is the acceleration constant of gravity. u∗ and ut are the
surface sliding velocity and critical sliding velocity, respectively. When sand particles move on the surface of
sand dunes, collision between sand particles often occurs, and the slope will greatly affect the trajectory of sand
particles. Considering the relationship between sand particles and slope, the sliding velocity threshold can be
expressed as follows:
sinθ
(15)
ut = ρm − ρg gds cosθ + /ρg /10
tanθrep
Scientific Reports | (2021) 11:4973 | https://doi.org/10.1038/s41598-021-84509-x 3
Vol.:(0123456789)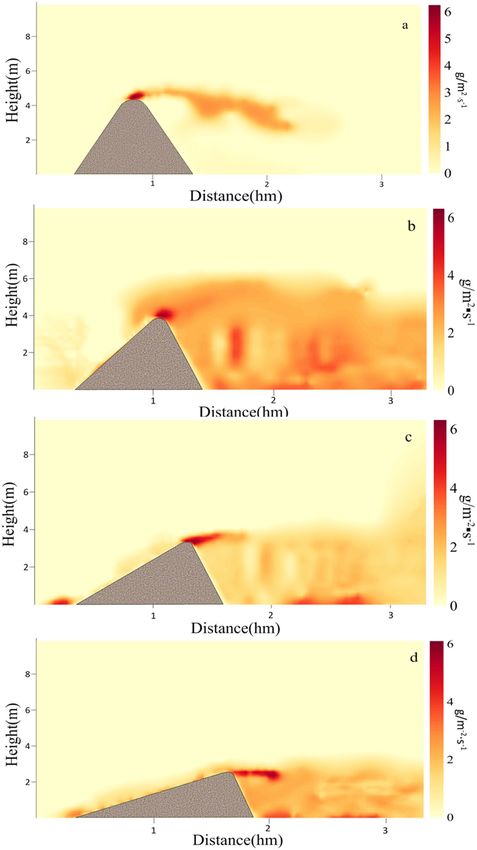
www.nature.com/scientificreports/
where ds is the average size of sand particles, θ is the angle of slope, tanθ = ∇h and θrep is the angle of repose,
nding46.
θ ≈ 37◦ and this value refers to Iversen’s fi
The creep of sand particles is caused by the collision of sand particles moving on the surface, so the reptation
and the jump of sand particles are proportional. According to previous studies, the reptation of sand particles
can be expressed as follows47:
qrep = (1 + α)qsal ex − αβqsal ∇h (16)
where the coefficients α and β represent the fraction of the total sand flux.
Considering the transition of sand flow from unsaturated to saturated state, the change of sand flux can be
expressed as follows:
(17)
∇qsal = qsat − qsal /lsat
where qsal is the saltation flux, and lsat is the saturation length, which have a relationship with friction velocity48.
lsat = aldrag (18)
where the parameter l represents the distance through which the sand grain reaches the wind velocity from
standing at a site.
Except for considering the migration of dune, the avalanche phenomenon on the surface during the evolution
can be explained by the slope angle. This avalanche phenomenon is closely related to the height of sand dune.
We used a diffusion equation combine with a mass balance equation to calculate mass accumulation together.
This diffusion equation can be written as follows:
qava = −ρs ǫ∇h (19)
where ε is a adjustment factor, and its value is related to the change rate of the height of the dune and the grid size
of the model. It is also necessary to define the collapse angle θa. According to the previous research methods49, we
set that when the slope of the dune surface exceeded 34º, that is, when θa < θrep, there would be no avalanche or
slippage movement. In this case qava = 0, otherwise, the sand would be redistributed according to the sand flow:
E [tanh (|∇h|)−(tanθrep )]
|∇h| > tanθrep
ε= |∇h|ρs (20)
0 |∇h| ≤ tanθrep
For a sufficiently large coefficient E, the slope is relaxed independently of E. The value of E is set as − 0.9. This
condition first runs under a constant condition and finally reaches a stable state. Because of the different period
of reconstruction caused by the slope of the leeward side, the setting of the critical slope of the leeward side will
greatly affect the shape of the longitudinal section of the whole dune.
Combined the previous Eqs. (13)–(19) with the collapse conditions, we could obtain the evolutionary process
of surface height of dune until this maximum collapse angle was reached.
Combined with Eq. (10), the total mass equilibrium equation is obtained as follows:
∂h
+ ∇ · uh = ∇ · ǫ∇h (21)
∂x
Boundary conditions. In the actual situation, the velocity of wind with height may appear as pulsating
wind field, but the pulsating wind field will bring great difficulty and uncertainty to the optimization of param-
eters and comparison with the measured data (the simulation results of pulsating wind field are different each
time). Therefore, the upper boundary condition was set to a constant wind velocity, and the left and right bound-
ary conditions were all set to the wind velocity at different heights under the initial conditions. Since the wind
field was far from the dune in space, the initial vertical velocity was set as 0. Moreover, it was assumed that the
temperature would not cause the air flow to rise.
∂u
=0 (22)
∂x
We used an empirical equation to express the friction velocity on the surface of sand dune50. The changes of
sand particles caused by friction and collision were roughly described by shear stress and density distribution
of sand particles:
(23)
uFriction = τ/ρ
In the source direction of the wind, we set the velocity distribution of the wind with the height as follows:
uf z
u(z) = ln (24)
k z0
where uf is the sliding speed, k is the Karman constant, and its value is set to 0.41. z0 represents the surface rough-
ness of sand dune, and its value is set to d/30. d is the diameter of sand particles.
Scientific Reports | (2021) 11:4973 | https://doi.org/10.1038/s41598-021-84509-x 4
Vol:.(1234567890)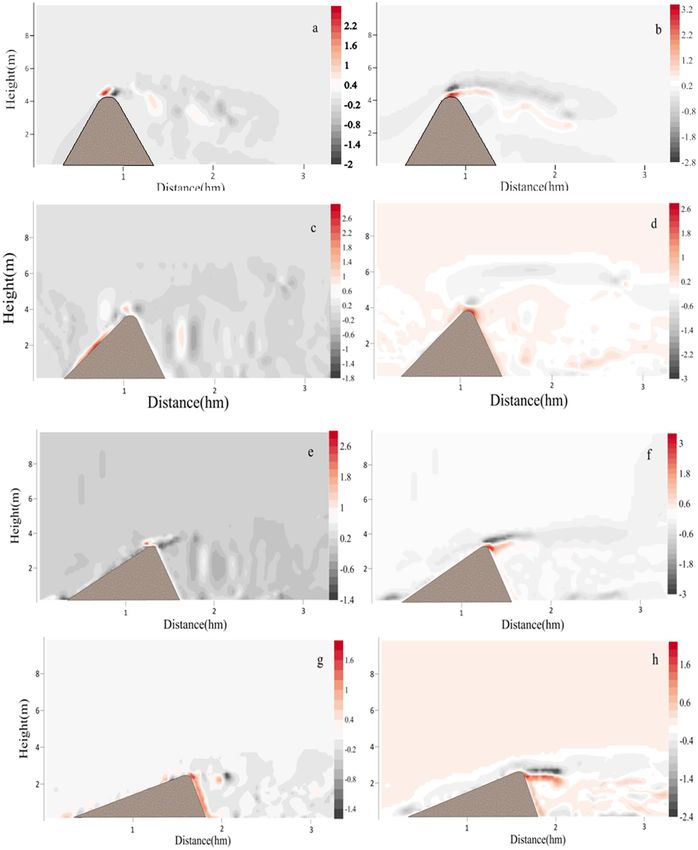
www.nature.com/scientificreports/
The bottom interface is the contact interface between the sand dune and the ground, where we set it to be
no sliding.
The initial morphology of the sand dune was set to a circular dune with a height of 4.2 m, a length of about
100 m and a bottom diameter of 6 m. The diameter of sand particles was set to 200 µm, the density of sand
−3, the viscosity of wind was set to 1.46 × 10⁻⁵ m2 s−1, the iteration time of wind field
particles was set to 1.2 kg m
and the migration of dune was set to 1 × 10⁻⁴ s. The whole grid was set to 180 × 50 × 100, and the convergence
condition was set to converge when the following conditions were reached.
′ ′
�ui − ui−1 �
< 10−5 (25)
�u′ �
Numerical iterative calculation. Equation (20) is equivalent to the momentum equation of a gas state,
and it also includes the continuity equation of the variation of the height of the dune. The instantaneous diffu-
sion of sand particles and continuous height change of sand dunes can be obtained by this equation. The discrete
form of the equation adopts the steady state spatial difference form, the difference form adopts the central differ-
ence form, and the iteration of the whole equation adopts the fully implicit scheme, which overcomes the pos-
sible non-convergence in the calculation. Complete a change process of a sand dune can be summarized as four
steps: (1) to calculate the spatial wind field, set the time interval as ∆t to obtain the spatial wind field distribution;
(2) to calculate the sand flux caused by wind velocity and the spatial distribution of sand particles; (3) to calculate
the shape and height changes of different position of sand dune after calculating three time intervals because that
it takes a certain time from take-off to deposition of sand particles; (4) to obtain the changes of wind field in the
new dune shape by substituting the new height and the coordinates of the dune shape into the wind field iterative
calculation. And then an iterative process is completed. The scale of time and changes of dune in the simulation
calculation are actual time and length.
Results and discussion
Simulated variation of wind field in the central axis of crescentic dune. To better show the distri-
bution changes of wind field and flow field of the leeward side of sand dunes, the longitudinal resolution of the
two-dimensional wind field map was added in the models of this study, that is, the horizontal and vertical coor-
dinates showed different spatial scales. Figure 1a showed the simulated wind field at the initial stage of the circu-
lar dune. The wind velocity at the windward crest was close to the velocity of the wind flow at the corresponding
height due to the blocking effect of the windward side on the wind flow31. Velocity of wind field increased with
the height from the windward toe to the windward crest. Subsequently, disturbance of the wind field caused by
turbulence occurred on the leeward side, while a clockwise vortex was usually formed behind the leeward side as
shown in Fig. 3a. However, the eddy current behind the leeward side caused the sand particles on the surface to
be blown back to the leeward side, and the upper part of leeward side gradually became steeper, which made the
velocity distribution of wind field after the leeward side different greatly and formed a new spatial distribution of
two-dimensional wind field (Fig. 1b). From the velocity field, it could be seen that under the combined action of
uneven spatial wind velocity and air viscous force5, a large number of irregular turbulence appeared behind the
leeward side of sand dune, which was close to the result of Zhang51. Then the occurrence of these large irregular
turbulences would make the sand lifting and deposition of the ground after the leeward side more complicated.
Under the continuous action of wind flow, the sand on the windward side was constantly taken away and the
windward side slowed down slightly (Fig. 1b). The turbulent flow behind the leeward side continuously carried
the sand particles of the leeward toe blowing back to the upper part of the leeward side, which would cause the
sand particles of the upper part to accumulate to a certain extent and then collapse down. Obviously, the mate-
rial reduction at the leeward toe increased the drop rate of the sand particles on the upper part. Through the
continuous collapse cycle, the height of the dune gradually decreased, and the slope of the leeward side gradually
became gentle with the collapse and accumulation of the sand particles. At this stage (Fig. 1c), the wind velocity
at the top of the leeward side decreased as the height of the dune decreased, and the field of wind flow behind
the leeward side slowly showed a relatively steady change, then the difference of spatial wind velocity decreased
gradually. The erosion of leeward side would continue until the slope reached a certain degree of gentle, that is,
when the highest point of sand dune was gradually reduced to the critical height of the leeward side under wind
erosion (Fig. 1d), the shear stress of turbulence to the leeward side began to weaken, and then the fluctuation of
wind velocity behind the leeward side was further weakened. Now the wind velocity of leeward side was smaller
than that of windward side at the same height. On the one hand, as the height of the dune decreased, the wind
with lower velocity in the low altitude could easily pass through the top of the dune. On the other hand, after
the wind velocity at the top of the leeward side decreased, the resulting turbulent energy also decreased, and
the disturbance to the air flow decreased. So the difference of wind velocity behind the leeward side decreased
and the overall turbulent phenomenon weakened. The above results showed that the height of sand dune had a
significant effect on the turbulent intensity of leeward side. Anyway, although there showed a complicated wind
velocity field behind the leeward side, the structure of eddy current behind the leeward side could be seen from
the distribution of wind velocity field.
To analyze the vertical distribution of velocity field at different positions of the dune and verify the reliability
of the simulation results, we compared the simulated the variation of horizontal wind velocity with height at the
windward toe, the leeward toe and the different distance positions at the downwind (Fig. 2). The measured data
were from a crescentic dune in the desert of northwest Minqin County of China, which had a length of 86.5 m, a
Scientific Reports | (2021) 11:4973 | https://doi.org/10.1038/s41598-021-84509-x 5
Vol.:(0123456789)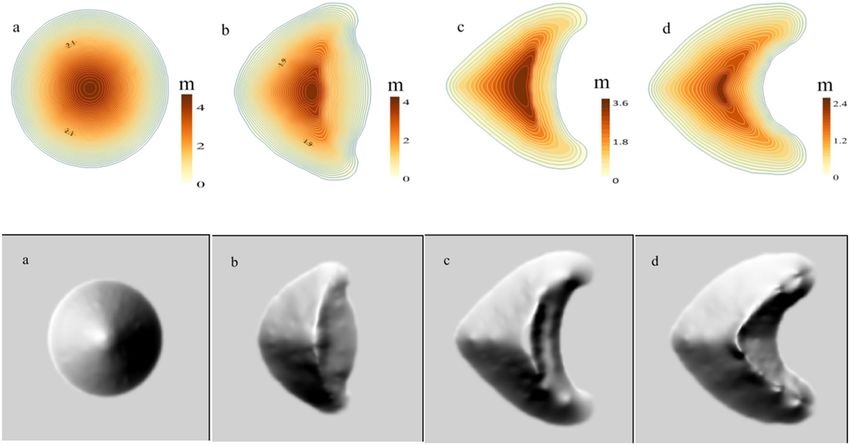
www.nature.com/scientificreports/
Figure 1. The simulated two-dimensional wind fields at the position of the central axis during the evolution
into a crescentic dune. (a–d) represented the two-dimensional wind field at the position of the central axis of the
four stages, respectively. The map was plotted using Matlab 2014a (https://www.mathworks.com).
Scientific Reports | (2021) 11:4973 | https://doi.org/10.1038/s41598-021-84509-x 6
Vol:.(1234567890)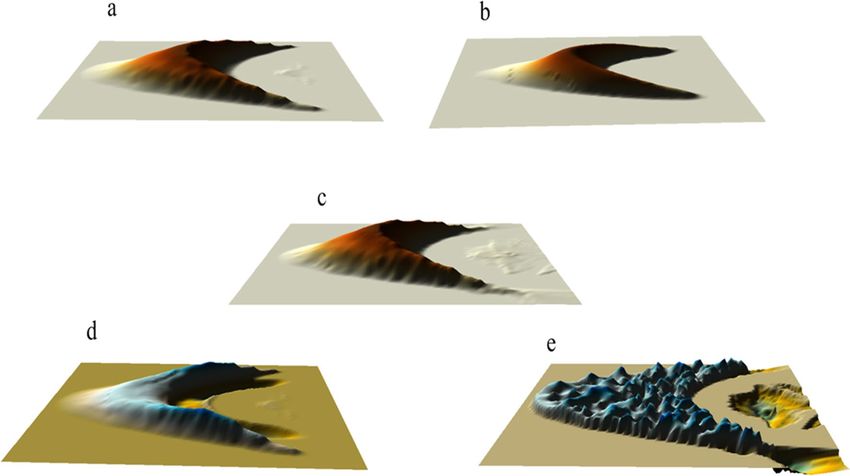
www.nature.com/scientificreports/
Figure 2. Comparison of simulation in wind field (round blue dots) and field measured wind velocity (square
red blocks) at different locations of sand dune (the wind velocity position corresponded to the different distance
position in Fig. 1b). The upper right corner showed the wind frequency map of the measured sand dune
position. The map was plotted using Matlab 2014a (https://www.mathworks.com) and Surfer 16 (https://www.
goldensoftware.com/).
height of 3.7 m, and a maximum wind velocity of 11 m s −1. Although the local wind velocity and wind direction
had some fluctuations, the wind velocity in the main wind direction was relatively stable.
The simulation results of five positions in Fig. 2 were in good agreement with the measured data, which
indicated that the model could reproduce the actual distribution of wind velocity more truthfully. There was
significant negative velocity at the leeward side in Fig. 2b which suggested that the eddy current caused by
the decrease of pressure at the leeward side would cause the inversion of the horizontal wind field, and which
accorded with the conclusions of most of the previous studies52–54. In the downwind direction, with the increase of
the distance from the leeward side, the influence of eddy current on wind velocity and wind direction decreased
gradually, so the vertical wind velocity in the downwind direction tended to be close to the parabola shape again.
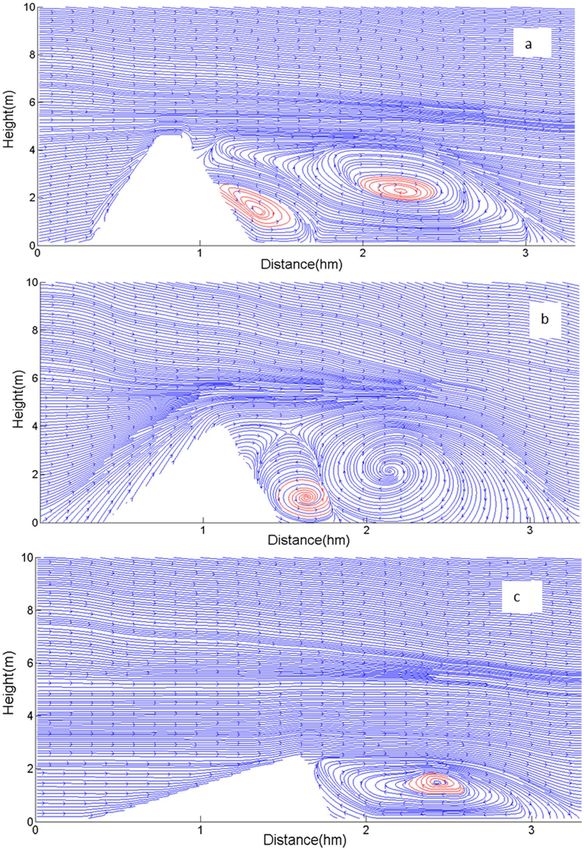
To further verify the reliability of the simulation, we obtained the distribution maps of two-dimensional
wind flow field of sand dune corresponding to Fig. 1a,b,d by calculating the divergence of velocity. From the
change of wind flow field in Fig. 3a, it could be seen that the blocking of the air flow by the tall dune made the
low pressure zone formed behind the leeward side. Firstly, the wind blowing through the top squeezed the air
behind the leeward side to sink. Then the downdraft contacted the ground to form shear force, prompting the air
flow to reverse. The recirculation flow was then lifted along the leeward side to fill the low pressure zone formed
by the lost air flow. These compressed and refluxed air flows formed a large vortex, with a wide range of spread,
whose height was basically the same as that of the resulting dune, and whose length was even larger than that of
the resulting dune. This large vortex maintained a near-circular shape, driving the surrounding air to move and
then rise along the leeward side. After that, the edge of vortex was in contact with the upper part of the leeward
side, so a certain space after air loss was left between the edge of the vortex and the leeward toe, which led to the
generation of the second small vortex.
Figure 3b was the wind flow field pattern corresponding to the dune morphology in Fig. 1b. From it we
realized that compared with the first stage, the vortex center after the leeward side continuously produced the
outflow of the central airflow, while in the first stage the airflow only rotated with the vortex current. This situ-
ation would lead to the formation of a low pressure zone in the internal vortex center, and which was easier to
Scientific Reports | (2021) 11:4973 | https://doi.org/10.1038/s41598-021-84509-x 7
Vol.:(0123456789)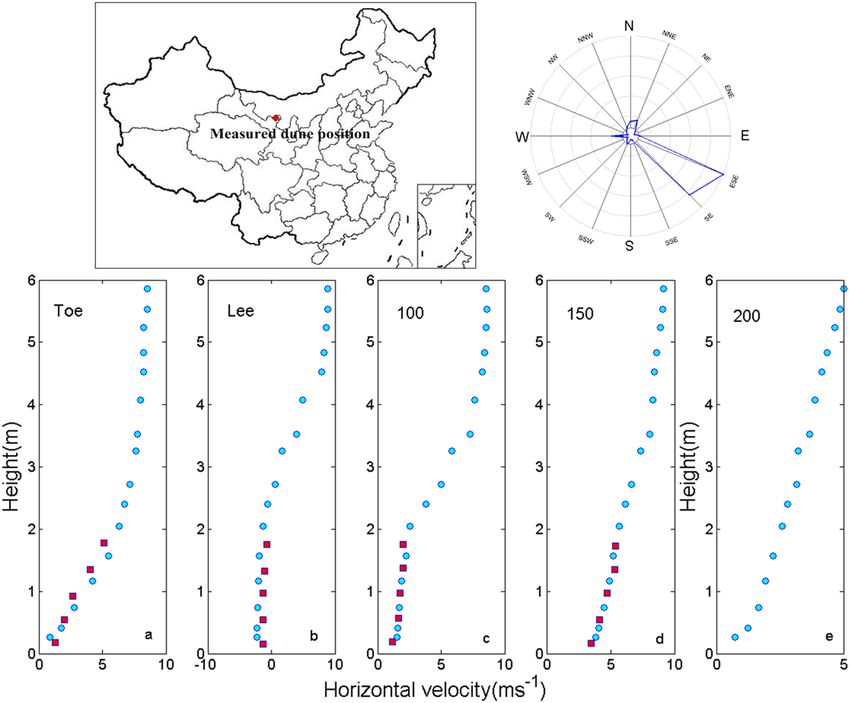
www.nature.com/scientificreports/

                                            Figure 3.  Distributions of two-dimensional wind flow field around the crescentic dune in Fig. 1a (a), 1b (b) and
                                            1d (c) (red circles represented the vortexes).

                                            accelerate the flow of wind. Moreover, it would also promote the transport of sand particles. Figure 3c displayed
                                            the distribution of two-dimensional flow field of dune in Fig. 1d. We found that there was only one large vortex
                                            behind the leeward side. The large vortex, though long in length, had been compressed into an ellipse. There was
                                            little space between the edge of the vortex and the leeward toe to produce additional vortexes, so there was only
                                            one larger vortex in Fig. 3c. Therefore, the different height of dune would produce different number and scale of
                                            vortexes, thus affecting the scale of sand flux.

                                            Simulation of sand flux. Figure 4 simulated the changes of sand flux around the central axis of the four
                                            stages during the evolution into a crescentic dune. Figure 4a showed the distribution of sand flux after loading
                                            wind flow at the initial stage. At this stage, the sand flux at the windward crest was the largest. Then the sand

          Scientific Reports |   (2021) 11:4973 |               https://doi.org/10.1038/s41598-021-84509-x                                                 8

Vol:.(1234567890)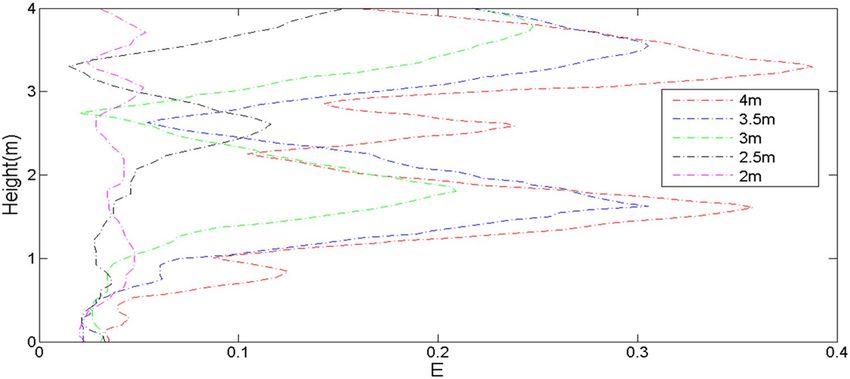
www.nature.com/scientificreports/

                                  Figure 4.  Spatial variation of two-dimensional sand flux around the dune at four stages in Fig. 1.

Scientific Reports |   (2021) 11:4973 |                https://doi.org/10.1038/s41598-021-84509-x                                            9

                                                                                                                                        Vol.:(0123456789)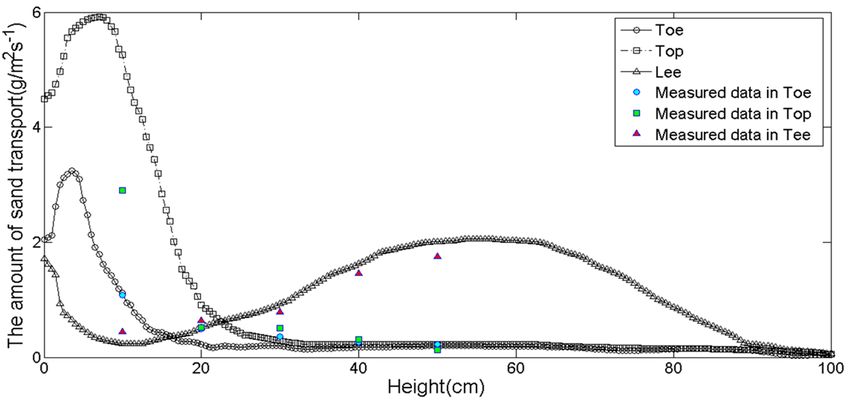
www.nature.com/scientificreports/
particles after being blown to the leeward side diffused in the downwind direction, and the depositing dust
would be affected by the vortexes at the leeward side, and then the finer particles would migrate in the direction
of vortex rotation.
Figure 4b revealed the sand flux of the dune at the time of evolution to the second stage. We found that
although the sand flux at the windward crest was always the largest, the sand flux around the whole area in the
downwind behind the leeward side had become larger from at this stage. During this period, the range of sand
flux was the largest and the amount of sand flux was also the largest, and the amount of sand flux in many posi-
tions had reached 4 g·m−2 s−1. At the same time, the amount of sand lifting near the ground was also very large.
In addition, the windward crest was still the most significant position of instantaneous sand flux.
Figure 4c displayed the change of sand flux during the evolution to the third stage. It showed that the maxi-
mum sand flux was still maintained at the windward crest, but the direction of sand transport there was more
horizontal. As the height of the dune decreased, the wind velocity at the windward crest also decreased. How-
ever, due to the increase of sand density in the region of leeward side, the collision of the sand particles would
lead to the increase of the shear stress of the impacted sand particles in the air and on the ground. Although the
velocity of the original sand particles decreased after the collision, it would continue to gain acceleration energy
through the wind flow. Especially when the sand particles in the turbulence of wind flow, it was easier to obtain
continuous energy s upply55. The whole process would increase the migration distance of sand particles and
then increased the sand flux56,57 on the ground. The decrease of the height and slope of the windward side made
the difference between the windward side and the wind direction smaller, so the acceleration effect of the sand
particles decreased, but the amount of sand flux in the horizontal direction would increase.
As shown in Fig. 4d, when the dune evolved to a more typical crescentic shape, the sand transport at the
windward crest almost showed horizontal movement, while the phenomenon of the sand lifting on the surface
of the whole windward side was obvious, and the amount of sand flux was also larger. As the slope decreased,
the movement of sand particles on the windward side changed from the windward crest of the initial stage to
the windward toe now, so the sand transport tended to occur on the whole slope. At this stage, the volume of
vortexes behind the leeward side was compressed and reduced, and the shear stress of the eddy current to the
sand of the leeward side and that of the leeward toe was more uniform. Therefore, the distribution of sand lifting
or sand settlement at the position of the downwind behind the leeward side was more uniform.
Figure 5 showed the horizontal and vertical components of spatial sand flux in different stages. The positive
and negative values in the horizontal direction indicated that the direction of sand migration was the same or
opposite of the wind direction, respectively. The positive and negative values of vertical direction indicated
that the direction of sand movement was rising or falling, respectively. From Fig. 5a,b, we found that it had the
maximum horizontal and vertical sand flux on the windward crest at the beginning stage of simulation. Then at
the second stage of simulation, Fig. 5c displayed that the horizontal sand flux on the windward side was relatively
large, while that on the leeward side was not large. Figure 5d revealed that most of the sand particles jumped in
the surrounding space below the peak of the whole dune, indicating that the transport of wind flow to sand flow
on the ground was stronger at this stage. From the horizontal transport in Fig. 5e, it could be seen that the sand
flux on the windward side was relatively stable and the amount of sand flux was small, but there were still more
negative sand flux on the leeward side. Figure 5f discovered that the sand particles showed more settlement at this
stage, indicating that the sand lifting effect of leeward side was reduced. The exhibition of Fig. 5g,h reflected that
with the decrease of the height of dunes, the sand flux of the whole dunes decreases. Although Fig. 5h showed
that the eddy current on the leeward side increased the sand flux in vertical direction, the sand flux was smaller
in horizontal and vertical direction compared with the stages in Fig. 5c,d. Because tall dunes are more likely to
cause small eddy currents near large ones, thus increasing sand flux on the ground and on the surface of dunes.
For small dunes, the opposite is true.
To verify the accuracy of simulated sand flux, we compared the measured sand flux in three different loca-
tions of measured dune in Minqin County (Fig. 6). The relevant data of the measured dune and the velocity of
Fig. 2 came from the same dune. We found that the simulated values and measured values of sand flux were in
good agreement with the trend at the toe of the sand dune and the leeward side, but the difference was great at
the windward crest. The reasons for the difference were as follows: firstly, there was a certain difference in the
scale between the actual sand dune we used to compare and that we used to simulate. Secondly, we used a stable
wind field in the simulation, but in practice it was a pulsating wind field. In the introduction of the method, we
had emphasized that the input of pulsating wind field in the simulation would lead to the obvious fluctuation in
the simulated sand flux, which was also the difficulty of correcting the model.
Two‑dimensional and three‑dimensional morphological changes of sand dunes at different
stages. Based on the simulated wind field and sand flux, we constructed the morphological evolution of
crescentic dune. The evolution time of dune from the initial morphology to the last three stages was 11.5, 20.7
and 32.2 days, respectively. Obviously, the evolution time was less than the actual formation time (several weeks
or one month) of a crescentic dune of similar scale. The reason was that the model set the continuous wind
velocity and the constant stable state of parameters, which accelerated the evolution of dune. After 11.5 days of
unidirectional wind action from the initial form of Fig. 7a, the circular dune gradually formed two short horns,
thus initially having the morphology of the crescentic dune (Fig. 7b). At this stage, the windward side and the
brink parabola were obvious, and the range of the windward crest was more concentrated, but the highest point
and the brink parabola did not coincide. The windward side was relatively smooth, and there was still a large
protruding behind the leeward side. Then after 20.7 days of evolution, the windward and leeward sides became
more pronounced, and the range of the windward crest was elongated with the lengthening of both horns. Then
the windward side began to become steep and formed windward toe, and the back of the leeward side had been
Scientific Reports | (2021) 11:4973 | https://doi.org/10.1038/s41598-021-84509-x 10
Vol:.(1234567890)www.nature.com/scientificreports/
Figure 5. The horizontal (a,c,e,g) and vertical (b,d,f,h) components of spatial sand flux at different stages in
Fig. 4.
Scientific Reports | (2021) 11:4973 | https://doi.org/10.1038/s41598-021-84509-x 11
Vol.:(0123456789)www.nature.com/scientificreports/
Figure 6. Comparison between the simulated and measured values of sand flux in final form.
Figure 7. Morphological evolutions of sand dunes at different stages. The map was plotted using Surfer 16
(https://www.goldensoftware.com/).
tightened in a curved moon shape (Fig. 7c). After another 32.2 days, the dune reached the final evolutionary
form, the windward crest coincided with the brink parabola, and the leeward side became more curved as the
horns stretched (Fig. 7d).
Because of the long simulation time, we tried to obtain the rapid morphological evolution process of dune by
increasing the amount of sand flux or reducing the diameter of sand particles. However, the final morphology of
the dunes obtained by these two methods was not the same. Because the increase in amount of sand flux needed
to increase the wind velocity, it would inevitably lead to the long distance extension of the horns of the crescentic
dune. And the movement distance of the sediment and the amount of sediment in the unit range on the leeward
side would change. While the method of reducing the diameter of sand particles would also make the deposi-
tion and drift of sand particles obviously different, especially the characteristics of deposition in the downwind
behind the leeward side would become more complex, and the sand particles could even be deposited far away.
These changes further indicated that the migration and change of sand dune were affected by many factors. In
the simulation, we could fit the reasonable results by adjusting the individual parameter, but the changes in the
actual situation were the results of the complex action of many factors together.
The simulation results of Fig. 8a showed that two vortexes appeared on both sides of the leeward side of the
initially circular dune, which pushed the sand particles in the inner side of the dune to the opposite direction
of the wind, and pushed the sand flow at the edge of the dune to the downwind direction, and the wind on both
sides continuously gave the rotation power to the vortexes as its outer boundary, which lead to the extension of
Scientific Reports | (2021) 11:4973 | https://doi.org/10.1038/s41598-021-84509-x 12
Vol:.(1234567890)www.nature.com/scientificreports/
Figure 8. The simulated wind flow field distribution around the circular dune (a); the simulated wind flow field
of the symmetric crescentic dune and the velocity component of the horizontal and vertical (x and y) directions
(b); the simulated wind flow field around the asymmetric crescentic dune and the velocity component of the
horizontal and vertical (x and y) directions (c). The map was plotted using Matlab 2014a (https://www.mathw
orks.com) and Surfer 16 (https://www.goldensoftware.com/).
the two horns of the crescentic dune. Figure 8b revealed that after the formation of crescentic dunes, there were
still two vortexes in the leeward side. From the direction of the vortexes, we found that the sand particles of the
leeward side were distributed to both sides of the dunes and gradually the horns developed with the transmis-
sion of the sand particles. Under the influence of this wind flow, although the dunes moved slowly backward as
a whole, the sand particles on the leeward side moved slower than that of the two horns, so it gradually formed
the crescentic shape of dune with the two horns downwind direction extending and the leeward side gradually
depressed. It was the existence of these two vortexes that made the horns extending continuously, but when the
length of the horns reached a certain length, that is, when the vortexes formed in the leeward side could not act
on the sand flow on the horn, the horn might produce new small crescentic dunes under the continuous action
of the wind (Fig. 8c).
Effect of wind velocity and air viscosity on sand flux. To test the influence of different parameters on
sand migration and sand flux, we simulated the morphological changes of dune obtained under different wind
velocity and Reynolds numbers, respectively. Where the wind velocity increased from the original 10 m s−1 to
12 m s−1, the air viscosity changed from the original 1.46 × 10⁻⁵ m2 s−1 to 2.46 m2 s−1.
Figure 9a was the result of sand dune generated after 1.26 × 10⁸ iterations with simulated wind velocity of 10 m
s−1. The actual time of simulation was approximately 35 days. Figure 9b was the result of sand dune obtained after
the iteration of the same time when the maximum wind velocity was set to 12 m s −1. The comparison between
the two pictures showed that the larger wind velocity made the sand migration faster. Figure 9d revealed the
difference between Fig. 9a and Fig. 9b. From which it could be seen that the increase of wind velocity increased
the migration velocity of sand dune. And the extension direction of the two horns of the sand dune also showed
a trend of more convergence behind the windward side.
Figure 9c displayed the change of sand deposition after changing Reynolds number. From this figure we
found that the sand deposition behind the dune increased obviously. Figure 9e showed the difference between
Fig. 9a and Fig. 9c. From which we could see that the change of sand particles on the surface of sand dune was
extremely uneven, and the situation of sand lifting and deposition was more complicated, especially the range
in change of deposition behind the leeward side was very large. These results indicated that the increase of air
viscosity had a significant effect on the deposition distribution of sand particles on the leeward side, especially
Scientific Reports | (2021) 11:4973 | https://doi.org/10.1038/s41598-021-84509-x 13
Vol.:(0123456789)www.nature.com/scientificreports/
Figure 9. Simulation of the sand distribution on the leeward side in several cases. (a) At the wind velocity of
10 m s−1; (b) high Reynolds; (c) at the wind velocity of 12 m s −1; (d) difference between (a) and (b); (e) difference
between (a) and (c). The map was plotted using Surfer 16 (https://www.goldensoftware.com/).
the deposition amount in the leeward toe and the middle part. In the previous section, we discussed the low-
pressure vortexes caused by the wind flow field in the downwind behind the leeward side (Fig. 3). The shear
stress produced by the friction between vortexes and the ground may increase the sand flux11,41,58, because the
increase of the number and the intensity of vortexes in the air flow all can increase the shear stress of the ground
surface59,60. Moreover, the change of air viscosity have a strong effect on the spatial turbulent i ntensity51,61. Then
the change of air viscosity further influenced the distribution of sediment by affecting the spatial turbulent
intensity. Therefore, it is for this reason that the large difference of diurnal temperature in desert area will affect
the change in sand flux of sand dunes62.
Effect of height of sand dune on shear stress and turbulent intensity behind the leeward
side. We simulated the wind flow field and sand flux in the evolution of the dune, the results showed that
with the changes of the height of the dune, the sand flux of the whole dune changes significantly, especially the
turbulent intensity and the number of vortexes at the leeward side also affected the variation of sand flux. In
the simulation, when the wind field and sand flux were calculated to reach a stable state, we regarded it as the
steady-state result in the current situation. The end condition of the iterative physical quantity was set as follows:
′
2�u′ − u −1 �
′ < 10−2 (26)
�u′ − u −1 �
Through simulation, we found that except that the sand dune with a height of 2 m had a great influence
on the shear stress of the ground surface behind the leeward side, the increases of other height of sand dune
had no obvious effect (Fig. 10). But when the shear stress was stable below 6 Pa, the disturbance of shear stress
decreased with the increase of height. Therefore, for dunes with a height of less than 4 m, the effect of wind flow
on shear stress was not significant. This was not consistent with the results of the simulated sand flux in Fig. 3.
Figure 3 suggested that the deposition of sand particles behind the leeward side of sand dune with higher height
was more uneven. The reasons were as follows: firstly, the position to lift sand on the leeward side was higher
and the deposition range was large. And secondly, the vortexes behind the leeward side of tall dune were not a
single distribution. If there was an irregular air flow gap between the middle part and the two horns of dune, it
was possible to form more low pressure zones, thus forming more vortexes, which would increase the amount of
sand flux on the whole dunes. Then the changes would result in changes of shear stress behind the leeward side,
triggering a wider range of sand particles on the ground. However, the vortexes in the downwind behind the
leeward side of low dunes was smaller and more stable, and the stable vortexes would form more stable deposition
in the leeward side. Therefore, the morphological changes of low sand dunes were also relatively stable during the
migration process. These results suggested that the wind velocity did not completely determine the magnitude
of shear stress on the ground surface, and other factors such as direction of eddy current and fluctuation of air
flow all could affect the sand flux.
In order to analyze the influence of height changes of sand dune on the turbulent intensity behind the leeward
side, we used the following formula to calculate the turbulent i ntensity63,64:
Scientific Reports | (2021) 11:4973 | https://doi.org/10.1038/s41598-021-84509-x 14
Vol:.(1234567890)www.nature.com/scientificreports/
Figure 10. Changes of shear stress on the ground surface corresponding to different distances behind the
leeward side at different heights of sand dune.
Figure 11. Turbulent intensity at the leeward toe of the sand dunes with different heights.
Eintensity =
′
u 2 /Uh=0.25 (27)
where u′ was the instantaneous velocity of the wind flow.
Figure 11 indicated that the sand dune with height of 4 m had larger turbulent intensity at two positions, 1 m
and 3 m. Moreover, the closer almost every dune was to the ground, the smaller the turbulent intensity. One
of the reasons was related to the wind velocity, and the other was related to the fluctuation of the air flow, that
is, the more complex the fluctuations and turbulence, the larger energy the fluid generated. According to the
results of Figs. 10 and 11, it could be concluded that the magnitude of shear stress was not proportional to the
turbulent intensity, which indicated that the calculated shear stress and turbulent intensity could only represent
the intensity of sand transport to a certain extent. After all, there was a complex relationship between the amount
of sand flux and wind velocity, size of sand particles and the flow direction between vortexes.
Conclusion
On the basis of the RA-NS equation and the stress and sand flux model, the wind field diagram of a circular
dune with a height of 4.2 m and a length of about 100 m during the four evolution periods of the evolution into
a crescentic dune was simulated in this study. Based on the relationship between wind shear stress and sand flux,
the two-dimensional distribution of sand flux in the main axis of sand dune was obtained. By comparing with the
measured velocity, we verified that the simulated velocity of wind field and the simulated sand flux at different
positions and heights behind the leeward side were all accorded with the measured results. From the simulation
results, we found that the variation of dune height may lead to different vortex patterns on leeward slope, the
complexity of eddy current behind the leeward side had an important influence on the sand flow of the leeward
side and the transmission and migration of the sand particles on the ground. And the increase of wind velocity
Scientific Reports | (2021) 11:4973 | https://doi.org/10.1038/s41598-021-84509-x 15
Vol.:(0123456789)www.nature.com/scientificreports/
increased the sand flux of the main body of the sand dune. In addition, the influence of the height of the dune
on the turbulent intensity of the leeward side was very significant, and the turbulent intensity increased with the
height of the dune. Moreover, the changes of height of tall sand dunes had significant effect on the surface shear
stress caused by eddy current behind the leeward side, but the changes of height of low sand dunes had little effect.
This was because the leeward side of tall dunes was more prone to steep slope, and there was also more space to
generate more vortexes and more friction with the surface. The leeward side of low dunes was relatively slow,
and the gap between the vortex boundary and the leeward side was less than enough to produce more vortexes.
These phenomena were due to changes in special sand flux during the evolution of dunes.
By comparing the relationship between surface shear stress and turbulent intensity of sand dunes with dif-
ferent heights, it could be seen that on the basis of increasing surface shear stress by wind velocity and turbulent
intensity, the fluctuation of wind velocity and eddy current caused by vortexes were also the reasons for increas-
ing sand migration distance.
Received: 5 August 2020; Accepted: 16 February 2021
References
1. Nokhandan, M. M., Piomelli, U. & Omidyeganeh, M. Large-eddy and wall-modelled simulations of turbulent flow over two-
dimensional river dunes. Phys. Chem. Earth 113, 123–131 (2018).
2. Kok, J. F. Difference in the wind speeds required for initiation versus continuation of sand transport on mars: implications for
dunes and dust storms. Phys. Rev. Lett. 104, 074502 (2010).
3. Zhang, R., Kawamura, T. & Kan, M. Numerical simulation of formation and movement of various sand dunes. Notes Numer. Fluid
Mech. 19, 954–957 (2005).
4. Ewing, R. C., Hayes, A. G. & Lucas, A. Sand dune patterns on Titan controlled by long-term climate cycles. Nat. Geosci. 8, 15–19
(2015).
5. Zhou, W. & Hui, H. Improvements of film cooling effectiveness by using Barchan dune shaped ramps. Int. J. Heat Mass Transf.
103, 443–456 (2016).
6. Weaver, Corinne, M., Wiggs & Giles, F. S. Field measurements of mean and turbulent airflow over a barchan sand dune. Geomor-
phology 128, 32–41 (2011).
7. Wang, Z. T. et al. Barchans of Minqin: Sediment transport. Geomorphology 96, 233–238 (2008).
8. Palmer, J. A., Mejia-Alvarez, R., Best, J. L. & Christensen, K. T. Particle-image velocimetry measurements of flow over interacting
barchan dunes. Exp. Fluids 52, 809–829 (2012).
9. Moosavi, V., Moradi, H., Shamsi, S. R. F. & Shirmohammadi, B. Assessment of the planimetric morphology of barchan dunes.
CATENA 120, 12–19 (2014).
10. Michel, S. et al. Comparing dune migration measured from remote sensing with sand flux prediction based on weather data and
model, a test case in Qatar. Earth Planet. Sci. Lett. 497, 12–21 (2018).
11. Smith, A. B., Jackson, D. W. T. & Cooper, J. A. G. Three-dimensional airflow and sediment transport patterns over barchan dunes.
Geomorphology 278, 28–42. https://doi.org/10.1016/j.geomorph.2016.10.025 (2017).
12. Jiang, H., Dun, H., Tong, D. & Huang, N. Sand transportation and reverse patterns over leeward face of sand dune. Geomorphology
283, 41–47 (2017).
13. Hesp, P. A. & Smyth, T. A. G. Nebkha flow dynamics and shadow dune formation. Geomorphology 282, 27–38. https://doi.
org/10.1016/j.geomorph.2016.12.026 (2017).
14. Zhou, X., Zhang, Y., Wang, Y. & Li, M. 3D numerical simulation of the evolutionary process of aeolian downsized crescent-shaped
dunes. Aeol. Res. 21, 45–52 (2016).
15. Durán, O., Schwämmle, V., Lind, P. G. & Herrmann, H. J. Size distribution and structure of Barchan dune fields. Nonlinear Process.
Geophys. 18, 455–467 (2011).
16. Silvestro, S., Fenton, L. K., Vaz, D. A., Bridges, N. T. & Ori, G. G. Ripple migration and dune activity on Mars: Evidence for dynamic
wind processes. Geophys. Res. Lett. 37, 95–108. https://doi.org/10.1029/2010GL044743 (2010).
17. Yang, Z., Yuan, W. & Pan, J. Evolution of downsized crescent-shaped dune in wind tunnel experiment. Sci. China Phys. Mech.
Astron. 57, 143–151 (2014).
18. Tominaga, Y. et al. Wind tunnel experiment and CFD Analysis for the wind erosion/deposition around an obstacle standing on
the sand. Bul. Niigata Inst. Technol. 11, 310–310. https://doi.org/10.1016/j.jweia.2018.09.008 (2006).
19. Russell, A. J., Gregory, A. R., Large, A. R. G., Fleisher, P. J. & Harris, T. D. Tunnel channel formation during the November 1996
jokulhlaup, Skeiethararjokull Iceland. Ann. Glaciol. 45, 95–103 (2007).
20. Clifton, A., Ruedi, J. D. & Lehning, M. Snow saltation threshold measurements in a drifting-snow wind tunnel. J. Glaciol. 52,
585–596 (2006).
21. Al-Masrahy, M. A. & Mountney, N. P. Remote sensing of spatial variability in aeolian dune and interdune morphology in the Rub’
Al-Khali Saudi Arabia. Aeolian Res. 11, 155–170 (2013).
22. Zimbelman, J. R. Transverse Aeolian Ridges on Mars: First results from HiRISE images. Geomorphology 121, 22–29 (2010).
23. Field, W. S. D. & Mexico, N. Aeolian dune interactions and dune-field pattern formation. Sedimentology 57, 1199–1219 (2010).
24. Durán, O., Parteli, E. J. R. & Herrmann, H. J. A continuous model for sand dunes: Review, new developments and application to
barchan dunes and barchan dune fields. Earth Surf. Proc. Land. 35, 1591–1600 (2010).
25. Luna, M. C. M. D. M., Parteli, E. J. R., Durán, O. & Herrmann, H. J. Model for the genesis of coastal dune fields with vegetation.
Geomorphology 129, 215–224 (2011).
26. Hersen, P. Flow effects on the morphology and dynamics of aeolian and subaqueous barchan dunes. J. Geophys. Res. Earth Surf.
110, F04S07. https://doi.org/10.1029/2004JF000185 (2005).
27. Shi, F. & Huang, N. Computational simulations of blown sand fluxes over the surfaces of complex microtopography. Environ.
Model. Softw. 25, 362–367 (2010).
28. Al-Awadhi, J. M. & Al-Awadhi, A. A. Modeling the aeolian sand transport for the desert of Kuwait: Constraints by field observa-
tions. J. Arid Environ. 73, 995 (2009).
29. Mohotti, D., Wijesooriya, K. & Dias-da-Costa, D. Comparison of Reynolds Averaging Navier-Stokes (RANS) turbulent models in
predicting wind pressure on tall buildings. J. Build. Eng. 21, 1–17 (2019).
30. Araújo, A. D., Parteli, E. J. R., Thorsten, P., Andrade, J. S. & Herrmann, H. J. Numerical modeling of the wind flow over a transverse
dune. Sci. Rep. 3, 2858 (2013).
31. Parsons, D. R., Walker, I. J. & Wiggs, G. F. S. Numerical modelling of flow structures over idealized transverse aeolian dunes of
varying geometry. Geomorphology 59, 149–164 (2004).
Scientific Reports | (2021) 11:4973 | https://doi.org/10.1038/s41598-021-84509-x 16
Vol:.(1234567890)www.nature.com/scientificreports/
32. Zhen, W., Shiyin, L., Huiwen, Z., Junyin, C. & Kai, Y. Full-Stokes modeling of a polar continental glacier: The dynamic character-
istics response of the XD Glacier to ice thickness. Acta Mech. 229, 2393–2411. https://doi.org/10.1007/s00707-018-2112-8 (2018).
33. Wu, Z. et al. Fluctuation analysis in the dynamic characteristics of continental glacier based on Full-Stokes model. Sci. Rep. 9,
20245. https://doi.org/10.1038/s41598-019-56864-3 (2019).
34. Wu, C. J., Wang, M. & Wang, L. Large-eddy simulation of formation of three-dimensional aeolian sand ripples in a turbulent field.
Sci. China 51, 945–960 (2008).
35. Klose, M. & Shao, Y. Large-eddy simulation of turbulent dust emission. Aeol. Res. 8, 49–58. https://doi.org/10.1016/j.aeoli
a.2012.10.010 (2013).
36. Klaus, K., Gerd, S. & Herrmann, H. J. Minimal model for sand dunes. Phys. Rev. Lett. 88, 054301 (2002).
37. G, S., K, K. & HJ, H. A continuum saltation model for sand dunes. Phys. Rev. E 64, 31305. (2001).
38. Maurizi, A. Numerical simulation of turbulent flows over 2-D valleys using three versions of the k-ε closure model. J. Wind Eng.
Ind. Aerodyn. 85, 59–73 (2000).
39. Zhang, Y., Deng, S. & Wang, X. RANS and DDES simulations of a horizontal-axis wind turbine under stalled flow condition using
OpenFOAM. Energy 167, 1155–1163 (2019).
40. Xiao, H. & Cinnella, P. Quantification of model uncertainty in RANS simulations: A review. Prog. Aerosp. Sci. 108, 1–31 (2019).
41. Burkow, M. & Griebel, M. Numerical simulation of the temporal evolution of a three dimensional barchanoid dune and the cor-
responding sediment dynamics. Comput. Fluids 166, 275–285. https://doi.org/10.1016/j.compfl uid.2018.02.018 (2018).
42. Coleman, S. E. & Nikora, V. I. Exner equation: A continuum approximation of a discrete granular system. Water Resour. Res. 45,
706–715. https://doi.org/10.1029/2008WR007604 (2009).
43. Anderson, R. S. & Haff, P. K. Wind modifacation and bed response during saltation in air. Acta Mech. 1, 21–51 (1991).
44. Bagnold, R. A. The physics of blown sand and desert dunes (Springer, Netherlands, 1941).
45. Sørensen, M. An analytic model of wind-blown sand transport. Acta Mech. 1, 67–81 (1991).
46. Iversen, J. D. & Rasmussen, K. R. The effect of surface slope on saltation threshold. Sedimentology 41, 721–728 (1994).
47. Andreotti & Bruno. A two-species model of aeolian sand transport. J. Fluid Mech. 510, 47–70 (2004).
48. PaHtz, T., Parteli, E. J. R., Kok, J. F. & Herrmann, H. J. Analytical model for flux saturation in sediment transport. Phys. Rev. E 89,
052213 (2014).
49. Durán, O., Schwammle, V. & Herrmann, H. Breeding and solitary wave behavior of dunes. Phys. Rev. E: Stat., Nonlin, Soft Matter
Phys. 72, 021308. https://doi.org/10.1103/PhysRevE.72.021308 (2005).
50. Hanocha, G., Yizhaqb, H. & Ashkenazyb, Y. Modeling the bistability of barchan and parabolic dunes. Aeolian Res. 35, 9–18. https
://doi.org/10.1016/j.aeolia.2018.07.003 (2020).
51. Zhang, Y. & Rinoshika, A. Multi-scale vortical structure analysis on large eddy simulation of dune wake flow. J. Vis. 18, 95–109
(2015).
52. L, B. T. & J, Z. X. The formation and evolution of aeolian dune fields under unidirectional wind. Geomorphology 134, 408–416.
doi:https://doi.org/10.1016/j.geomorph.2011.07.014 (2011).
53. Bendjebbas, H., El-Hadj, A. A. & Abbas, M. Numerical simulation of wind barrier openings effect on high wind speed flow around
heliostats field. Appl. Math. Model. 61, 443–456 (2018).
54. Jiang, H., Huang, N. & Zhu, Y. Analysis of wind-blown sand movement over transverse dunes. Sci. Rep. 4, 7114. https://doi.
org/10.1038/srep07114 (2014).
55. Li, G., Zhang, J., Herrmann, H. J., Shao, Y. & Huang, N. Study of aerodynamic grain entrainment in aeolian transport. Geophys.
Res. Lett. 47, L086574 (2020).
56. Li, Y. & Yi, G. Numerical simulation of aeolian dusty sand transport in a marginal desert region at the early entrainment stage.
Geomorphology 100, 335–344. https://doi.org/10.1016/j.geomorph.2008.01.006 (2008).
57. Kang, L. & Liu, D. Numerical investigation of particle velocity distributions in aeolian sand transport. Geomorphology 115, 156–171
(2010).
58. Ewing, R. C. & Kocurek, G. A. Aeolian dune interactions and dune-field pattern formation: White Sands Dune Field New Mexico.
Sedimentology 57, 1199–1219 (2010).
59. Xue-lian, J., Tian, Y., Qing-ping, Z. & Han-bin, G. Flow separation and vortex dynamics in waves propagating over a submerged
quartercircular breakwater. China Ocean Eng. 32, 514–523 (2018).
60. Adrian, R. J., Meinhart, C. D. & Tomkins, C. D. Vortex organization in the outer region of the turbulent boundary layer. J. Fluid
Mech 422, 1–54 (2000).
61. Stoesser, M. A., Braun, C., García-Villalba, M. & Rodi, M. A. Turbulence structures in flow over two-dimensional dunes. J. Hydraul.
Eng. 134, 44–55 (2008).
62. Hesse, P. P., Telfer, M. W. & Farebrother, W. Complexity confers stability: Climate variability, vegetation response and sand transport
on longitudinal sand dunes in Australia’s deserts. Aeol. Res. 25, 45–61 (2017).
63. Zeytounian, K. R. Theory and applications of viscous flow. J. Fluid Mech. 526, 379 (2005).
64. Szmelter, J. & Pagano, A. Viscous flow modelling using unstructured meshes for aeronautical applications (Springer, Berlin Heidelberg,
1995).
Acknowledgements
This study was supported by the National Natural Science Foundation of China (No. 41761006), the Key Projects
of Gansu Natural Science Foundation (20JR5RA097), the Science for Earthquake Resilience of China Earthquake
Administration (XH20059), the National Key R & D Program of China (No. 2018YFC1503206), the Scientific
Program of China Earthquake Administration (2020IESLZ04), the Key R & D Program of Gansu Province (No.
17YF1FA113) and the Self-listed Program of Forestry and Grassland Bureau of Gansu Province (2019kj122).
Author contributions
H.W.Z. performed the numerical simulations and wrote this article. Z.W. revised the manuscript. J. H., Z.P.Z.,
B.X. and J.P.M. took part in field investigation. All authors reviewed the manuscript.
Competing interests
The authors declare no competing interests.
Additional information
Correspondence and requests for materials should be addressed to Z.W.
Reprints and permissions information is available at www.nature.com/reprints.
Scientific Reports | (2021) 11:4973 | https://doi.org/10.1038/s41598-021-84509-x 17
Vol.:(0123456789)You can also read