Characterization of binding of magnetic nanoparticles to rolling circle amplification products by turn-on magnetic assay
←
→
Page content transcription
If your browser does not render page correctly, please read the page content below
Characterization of binding of magnetic nanoparticles to rolling
circle amplification products by turn-on magnetic assay

Downloaded from: https://research.chalmers.se, 2021-11-14 19:05 UTC

     Citation for the original published paper (version of record):
     Sepehri, S., Agnarsson, B., Zardán Gómez De La Torre, T. et al (2019)
     Characterization of binding of magnetic nanoparticles to rolling circle amplification products
     by turn-on magnetic assay
     Biosensors, 9(3)
     http://dx.doi.org/10.3390/bios9030109

N.B. When citing this work, cite the original published paper.

research.chalmers.se offers the possibility of retrieving research publications produced at Chalmers University of Technology.
It covers all kind of research output: articles, dissertations, conference papers, reports etc. since 2004.
research.chalmers.se is administrated and maintained by Chalmers Library

                                           (article starts on next page)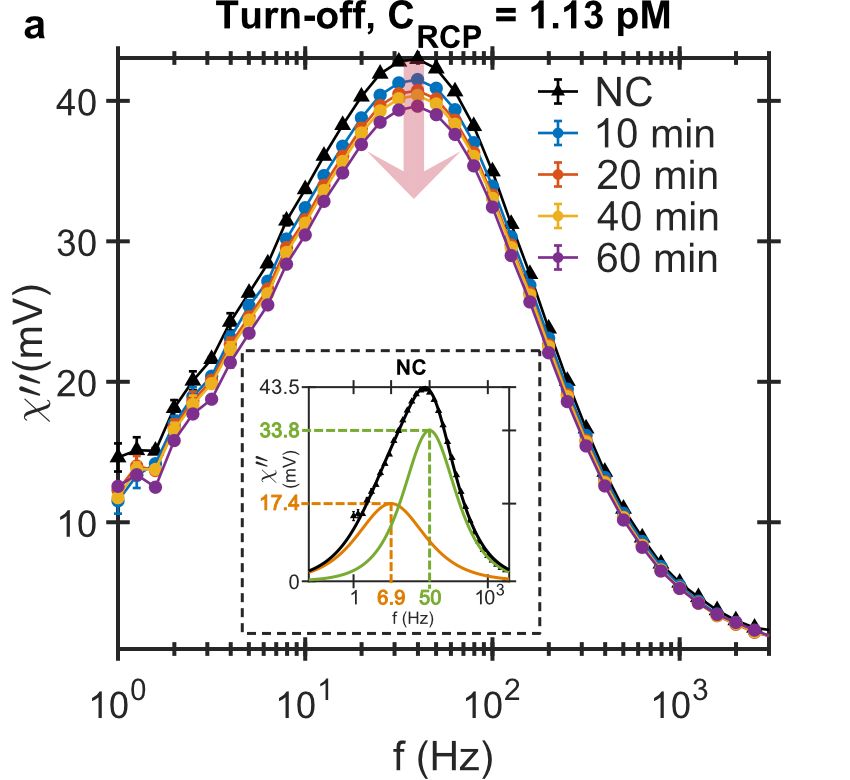
biosensors
Article
Characterization of Binding of Magnetic
Nanoparticles to Rolling Circle Amplification
Products by Turn-On Magnetic Assay
Sobhan Sepehri 1, * , Björn Agnarsson 2 , Teresa Zardán Gómez de la Torre 3 ,
Justin F. Schneiderman 1,4 , Jakob Blomgren 5 , Aldo Jesorka 6 , Christer Johansson 5 ,
Mats Nilsson 7 , Jan Albert 8,9 , Maria Strømme 3 , Dag Winkler 1 and Alexei Kalaboukhov 1
 1    Department of Microtechnology and Nanoscience—MC2, Chalmers University of Technology,
      SE-412 96 Göteborg, Sweden; justin.schneiderman@neuro.gu.se (J.F.S.); dag.winkler@chalmers.se (D.W.);
      alexei.kalaboukhov@chalmers.se (A.K.)
 2    Department of Physics, Chalmers University of Technology, SE-412 96 Göteborg, Sweden;
      bjorn.agnarsson@chalmers.se
 3    Department of Engineering Sciences, Uppsala University, The Ångström Laboratory, Box 534,
      SE-751 21 Uppsala, Sweden; Teresa.Zardan@angstrom.uu.se (T.Z.G.d.l.T.);
      maria.stromme@angstrom.uu.se (M.S.)
 4    MedTech West and the Institute of Neuroscience and Physiology, University of Gothenburg, SE-405 30
      Göteborg, Sweden
 5    RISE—Research Institutes of Sweden, SE-411 33 Göteborg, Sweden; jakob.blomgren@ri.se (J.B.);
      christer.johansson@ri.se (C.J.)
 6    Department of Chemistry and Chemical Engineering, Chalmers University of Technology,
      SE-412 96 Göteborg, Sweden; aldo@chalmers.se
 7    Science for Life Laboratory, Department of Biochemistry and Biophysics, Stockholm University, Box 1031,
      SE-171 21 Solna, Sweden; mats.nilsson@scilifelab.se
 8    Department of Clinical Microbiology, Karolinska University Hospital, SE-171 76 Stockholm, Sweden;
      jan.albert@ki.se
 9    Department of Microbiology, Tumor and Cell Biology, Karolinska Institute, SE-171 77 Stockholm, Sweden
 *    Correspondence: sobhan.sepehri@chalmers.se

 Received: 30 June 2019; Accepted: 4 September 2019; Published: 17 September 2019

 Abstract: The specific binding of oligonucleotide-tagged 100 nm magnetic nanoparticles (MNPs) to
 rolling circle products (RCPs) is investigated using our newly developed differential homogenous
 magnetic assay (DHMA). The DHMA measures ac magnetic susceptibility from a test and a control
 samples simultaneously and eliminates magnetic background signal. Therefore, the DHMA can
 reveal details of binding kinetics of magnetic nanoparticles at very low concentrations of RCPs.
 From the analysis of the imaginary part of the DHMA signal, we find that smaller MNPs in the
 particle ensemble bind first to the RCPs. When the RCP concentration increases, we observe the
 formation of agglomerates, which leads to lower number of MNPs per RCP at higher concentrations
 of RCPs. The results thus indicate that a full frequency range of ac susceptibility observation is
 necessary to detect low concentrations of target RCPs and a long amplification time is not required
 as it does not significantly increase the number of MNPs per RCP. The findings are critical for
 understanding the underlying microscopic binding process for improving the assay performance.
 They furthermore suggest DHMA is a powerful technique for dynamically characterizing the binding
 interactions between MNPs and biomolecules in fluid volumes.

 Keywords: magnetic nanoparticle; bioassay; differential homogenous magnetic assay; immobilization;
 binding kinetics; rolling circle amplification product

Biosensors 2019, 9, 109; doi:10.3390/bios9030109                              www.mdpi.com/journal/biosensors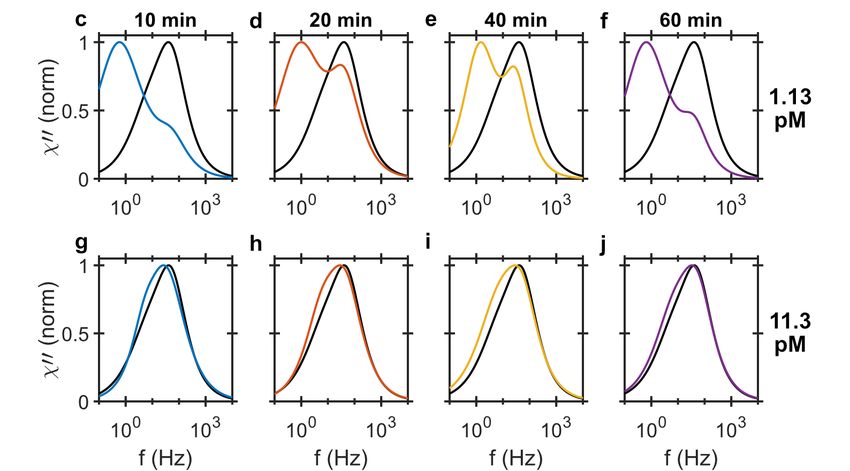
Biosensors 2019, 9, 109                                                                            2 of 16

1. Introduction
      Rolling circle amplification (RCA) is a versatile tool with applications in nanobiotechnology,
diagnostics and biodetection [1]. It has high specificity that is ideal for high resolution sequence
detection and is an isothermal process that is simple to implement and integrate into microsystems
for point-of-care diagnostic [2]. The RCA products contain multiple repetitive complementary
copies of a circular DNA template which can be customized to have different functional
sequences [1]. For detection of nucleic acids, the assay uses padlock probe ligation [3] for target
recognition and RCA [4] to create a single strand concatemer, i.e., the rolling circle product (RCP).
The RCPs can be analysed by various methods including gel electrophoresis [5,6], incorporation of
fluorophore-conjugated dNTP for fluorescent microscopy and spectroscopy [7] or hybridization of
complementary strands with fluorescence markers, gold nanoparticles [8], magnetic nanoparticles
(MNPs) [9], quantum dots [10], etc.
      MNPs are particularly promising tags due to their high surface-to-volume ratio, biocompatibility,
physical and chemical stability, and they can be easily manipulated using an external magnetic
field [11,12]. In addition, biological samples are generally not magnetic and thus do not affect the
sensitivity/signal transduction in the magnetic domain, unlike how fluorescence can in the optical
domain. Numerous methods have been developed for sensing the magnetically labelled target analytes
in a volume [13] and on a sensor surface and some of which are used for detection of magnetically
labeled RCPs including: magneto-resistive sensors [14], superconducting quantum interference devices
(SQUIDs) [9,15–17], induction coils [18,19], optomagnetic sensors [20,21], and ferromagnetic resonance
sensors [22]. The MNPs are conjugated to the RCPs by base pare hybridization forming MNP-RCP
complexes which have a larger hydrodynamic size compared to the unbound MNPs. The increase
in the hydrodynamic size changes the characteristic Brownian relaxation dynamics of the MNP-RCP
complexes, c.f. Section 4.4. The MNP-RCP ensemble therefore has two relaxation dynamics and
consequently two relaxation frequencies: (I) a high relaxation frequency (HRF) which is characteristic
of the unbound MNPs and (II) a low relaxation frequency (LRF) which is a result of the MNP-RCP
complexes. The change in the hydrodynamic size due to binding to target can be measured using
magnetic ac susceptibility [23,24]. This size change appears as a shift in the susceptibility curve.
However, due to broad size distribution of the MNPs it is difficult to measure the frequency shift and
magnetic assays based on this method have low sensitivity.
      In another approach, MNPs are bound to large RCPs (or agglomerate due to association with
target analyte) which significantly changes their relaxation frequency. In this case, the binding is
detected as a reduction in the HRF peak amplitude at the frequency corresponding to the free
(unbound) MNPs, turn-off detection [9,25]. The turn-off detection approach has been used for
quantification of magnetically labelled RCPs using various kinds of sensors such as induction coils [26],
optomagnetic [27], SQUID [15,17]. The main issue with this approach is the magnetic background
from the unbound MNP markers in the solution. At very low concentration of RCPs, very small
fraction of the available markers in the sample solution is consumed by forming MNP-RCP complexes.
The population of these complexes are basically too small compared to the unbound MNP markers
background to produce any significantly detectable signal in the ac susceptibility. This imposes the
MNP concentration to be close to the RCP one in order to produce a measurable fraction of bound
MNPs. An alternative approach is a turn-on detection strategy [28,29] where an increase of LRF peak
amplitude as a result of MNPs binding to the RCPs is measured. Attempts have been made to optimize
the magnetic assay by using the small changes observed at low frequencies in the 2nd order harmonic
components in the optomagnetic sensor [29]; however, since this approach is more in the line with
traditional turn-off assays, it fails to provide real-time data. Since the size of the MNPs is usually
comparable to the RCPs, the MNPs cannot bind to the inner side of the RCPs and the number of MNPs
that can hybridize to the RCPs is therefore limited. Using the turn-off approach, it has been shown
that the number of bound MNPs mainly depends on the amplification time (which determines the size
of the RCPs), the size of the MNPs [28,30], and the oligonucleotide surface coverage of the MNPs [30].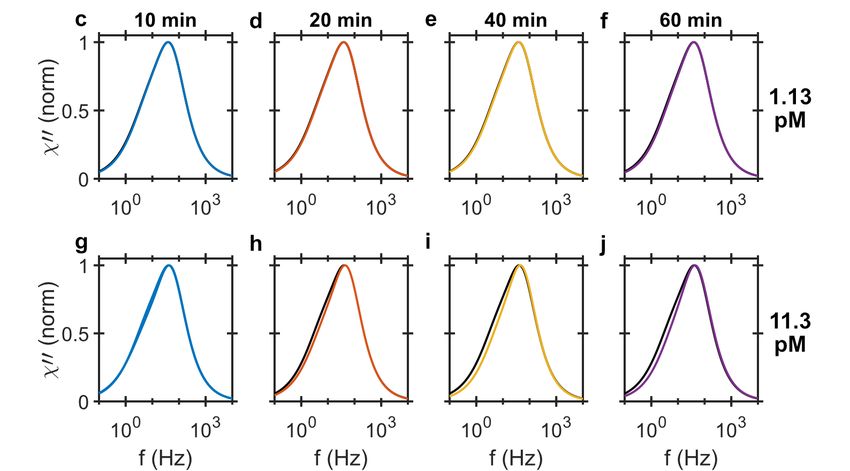
Biosensors 2019, 9, 109                                                                             3 of 16

While optical methods such as fluorescent microscopy or dynamic light scattering are used to obtain
information about the size distribution of the MNP-RCP complexes, the turn-off method is unable to
provide similar information and further it fails to determine the LRF from the MNP-RCP complexes for
MNPs larger than 40 nm at RCP concentration levels that are of any practical use [28]. This is mainly
due to the large magnetic background from the unbound MNPs which obscures the LRF signal.
      Recently we developed a differential homogenous magnetic assay (DHMA) which measures a
test and a control sample simultaneously to eliminate the troublesome magnetic background [31].
This enables the subtraction of signal from the excess unbound MNPs, which is analogous to a physical
washing step in most bulk assays for removing excess markers. In this way, the DHMA is able to
resolve directly the very small differences in the nanoparticle’s concentrations and size distributions in
the two samples. Using the assay we already demonstrated fM sensitivity with a constant 50% binding
fraction for all low concentrations of target molecules [31]. The 50% binding fraction ensures that the
MNP markers do not mask the LRF. The DHMA is therefore a turn-on detection strategy which detects
small changes in the MNP size distribution by measuring the LRF of the MNP-RCP complex and the
HRF of the unbound MNPs.
      Here, we use DHMA to investigate the binding characteristics of 100 nm MNPs to RCPs using both
turn-off and turn-on detection approaches, see Figure S1. The DHMA clearly reveals the presence of
two distinct relaxation processes, LRF and HRF, which can be obtained even at very low concentrations
of the RCPs. This has never been seen in the turn-off detection approach. The signal is studied for RCPs
of different concentrations and amplification times. The concentration of the RCPs affects the number
of MNPs per RCPs due to formation of MNP-RCP agglomerates. Nanoparticle tracking analysis (NTA)
is also used to provide information regarding the size distribution of the RCPs. To better understand
the binding mechanism of MNPs to RCPs, and to further explore the possible applications of DHMA,
the method was directly compared to a conventional turn-off approach. Increasing the amplification
time from 10 to 60 min only doubles the number of MNPs per RCP. Therefore, a long amplification time
is not necessarily required for improving the limit of detection in the assay. The turn-on approach based
on DHMA provides critical information for improving the assay performance and understanding the
underlying microscopic binding process.

2. Results

2.1. Effect of Amplification Time
     To investigate the binding kinetics, four different rolling circle amplification times of 10,
20, 40 and 60 min and two RCP concentrations of 1.13 and 11.3 pM labelled with 250 µg/mL (250 pM
equivalent) magnetic markers for analysis were used. The MNP markers are incubated with RCPs for
20 min at 55 ◦ C and hybridization buffer is used for diluting the samples. The negative control (NC)
sample consists of hybridization buffer and is mixed with the same amount of MNPs as in the test
samples. It therefore contains no RCPs. The samples are then analyzed using both the turn-off and
turn-on strategies.

2.1.1. Turn-Off Analysis
     In the turn-off approach, the ac susceptibility of each sample is measured and compared with
the NC sample. The drop in the peak imaginary ac susceptibility due to the presence of RCPs is
the detection signal and is a function of the RCPs’ concentration. Figure 1a,b shows the imaginary
part of the ac susceptibility as a function of the magnetic excitation field frequency for the different
amplification times and RCP concentrations. The results show that increasing the amplification time
results in a larger drop in the peak imaginary ac susceptibility signal indicating that there are more
binding sites available for the MNPs.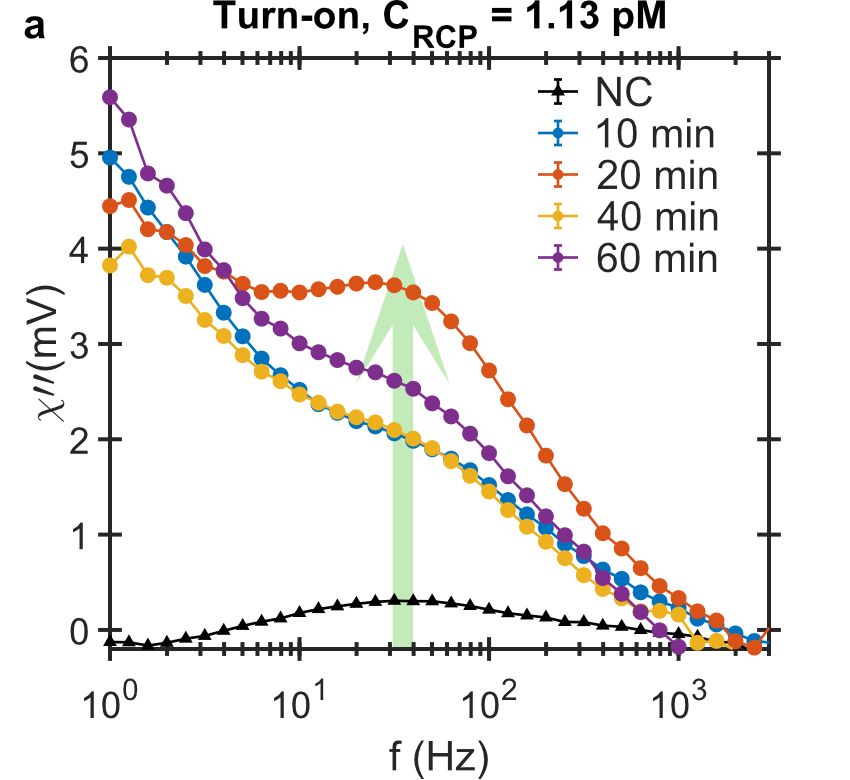
Biosensors 2019, 9, 109                                                                                       4 of 16

      Figure 1. Imaginary component of ac magnetic susceptibility measured using the turn-off detection
      strategy versus the excitation frequency from MNP-labeled RCPs of (a) 1.13 pM and (b) 11.3 pM in
      concentration amplified for 10, 20, 40 and 60 min. The samples are diluted in hybridization buffer.
      The signals’ peak amplitudes decrease with increasing the RCP concentration and amplification time.
      The inset in (a) shows the bi-modal Cole-Cole model fitted to the imaginary component of the NC
      sample and shows that the MNP system has an intrinsic bi-modal size distribution with corresponding
      Brownian relaxation frequencies of 7 and 50 Hz; (c–j) Normalized bi-modal Cole-Cole model fitted
      to the imaginary component of ac susceptibility in the turn-off detection method for the magnetically
      labeled RCPs of (c–f) 1.13 pM and (g–j) 11.3 pM rolled for 10, 20, 40 and 60 min. The black curve that is
      present in all the panels corresponds to the bi-modal model fitted to the NC sample.

      Since the concentrations of RCPs (1.13 and 11.3 pM) and MNPs (250 pM) are known, the number
of MNP-RCP complexes can be evaluated. The number of MNPs per RCP, g, is given by dividing the
total number of RCPs, CRCP , by the bound MNP markers, C MNPbnd . Assuming the magnetic moments of

the MNPs do not change, the imaginary ac susceptibility signal is a measure of the MNP concentration
and the amount of bound MNPs is a linear function of the decrease in the peak amplitude of the
imaginary component [17]. Therefore, the number of MNPs per RCP is given by:

                                          bnd
                                        C MNP    χ00 NC − χ00tRCP    C
                                  g=          =(                  ) × MNP                                         (1)
                                        CRCP          χ00 NC         CRCP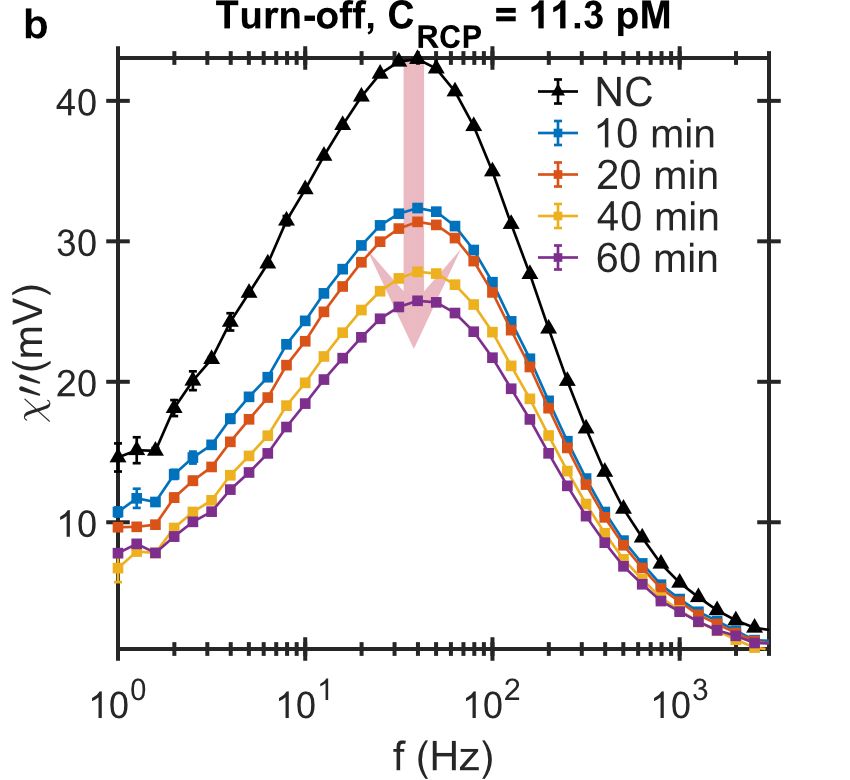
Biosensors 2019, 9, 109                                                                             5 of 16

where χ00 NC is the peak amplitude of the imaginary ac susceptibility from the NC sample,
C MNP is the concentration of the MNPs in the sample, and χ00tRCP is the peak amplitude of the
imaginary ac susceptibility from the sample with concentration of CRCP and the amplification time
t. Table 1 summarizes the estimated number of MNPs per RCP for each concentration of RCP
and amplification time. As expected, the number increases with increasing amplification time;
however, there are twice as many MNPs per RCP in the 1.13 pM sample compared to the 11.3 pM
sample. This could be due to the higher number of available MNPs per RCP during the hybridization in
                                                       C NC
the 1.13 pM sample compared to the 11.3 pM sample, CMNP ≈ 221 and 22.1 MNPs per RCP, respectively.
                                                          RCP
     A bi-modal relaxation model based on a superposition of two Cole-Cole models [19] is used to fit
the data. By normalizing the fitted bi-modal Cole-Cole model to the peak amplitude, we can visually
compare the response curves of the turn-off detection for any change in the size distributions in the
samples. We should emphasize that the MNP system also has an intrinsic asymmetric size distribution.
The inset of Figure 1a shows the fitted bi-modal Cole-Cole model to the NC sample in hybridization
buffer with the two distinct Brownian relaxation frequencies of 7 and 51 Hz. The asymmetrical size
distribution of this particular particle system has also been previously observed elsewhere [17,19]. The
intrinsic LRF of the NC should not be confused with the LRF from the MNP-RCP complexes. As we
shall see later, the DHMA allows distinction of the LRFs from the NC and the MNP-RCP complexes.
     Figure 1c–j shows the normalized Cole-Cole plots for all samples measured with the turn-off
strategy. The black curve, which is present in all the plots, is the bi-modal Cole-Cole model fitted
to the NC sample, also normalized to its peak amplitude. For the 1.13 pM samples, c.f. Figure 1c–f,
the response signals are nearly identical to the NC sample irrespective of the amplification time.
However, for the 11.3 pM samples, Figure 1g–j, the contribution from the LRF becomes slightly more
visible with increasing amplification time. Also, at such high concentrations of RCP, MNPs bind to
several RCPs at the same time, creating large agglomerates that sediment and completely disappear
from the measurement frequency window. The sedimentation of the agglomerates are visible to the
bare eye after hybridization and is also reported elsewhere [28,32].

2.1.2. DHMA, Turn-On Analysis
       For the turn-on analysis, we use the DHMA method [31] which measures a test sample and a
reference sample simultaneously. The reference sample in this case is the NC and it fills one of the two
available microfluidic channels. The second channel is filled with a test sample containing RCPs which
are amplified for 10, 20, 40 and 60 min and have different concentrations of 1.13 pM and 11.3 pM.
The magnetic signals from the samples resting in the two microfluidic channels are measured with a
gradiometer sensor where the they are subtracted and only the difference in two signals is read out,
Figure 2a,b. For 1.13 pM samples, the LRF contribution, which is the result of MNP-RCP complex
formation, is rather large, resulting in a distinct bi-modal response signal. For the RCP concentration of
11.3 pM, the populations of MNP-RCP complexes in the test sample and the corresponding unbound
MNPs in the control sample are larger which results in a broad detection signal with the peak position
shifted to lower frequency. The larger size of the MNP-RCP complexes compared to unbound MNPs in
the ensemble shifts the peak position to lower frequencies. Increasing the amplification time results in
larger RCPs which at such high RCP concentration form agglomerates when hybridizing with MNPs.
The large agglomerates have their relaxation frequency out of the measurement frequency window,
thereby bringing the frequencies of the two peak position back to the NC sample value again.
       To visualize the bi-modal response signals and frequency shifts, the data is fitted to the bi-modal
Cole-Cole model. The model provides a better picture of the underlying dynamic process. Bi-modal
Cole-Cole distributions fitted to the differential signals and normalized to the peak amplitudes are
plotted in Figure 2c–j and the fitting parameters are listed in Table 1. One important fitting parameter
is χχ01
     02
        , c.f. Equation (4), which gives the ratio of LRF and HRF contributions in the total bi-modal
distribution of the response signal. The results show that for the samples with 1.13 pM concentration,
the LRF position is below 1.5 Hz and the contribution of the LRF is larger than the HRF, meaning χχ01   02
Biosensors 2019, 9, 109 6 of 16
is larger than one. The HRF moves to lower frequencies with increasing the amplification time which
indicates that the MNP-RCP complexes are larger. The shift to lower frequencies is also visible for
samples of 11.3 pM RCP concentrations; however, it is more pronounced at shorter amplification times
where the contribution of the two distributions are very close, thereby shifting the peak frequency
position below that of the NC sample. The shape and position of the peaks approach those of the NC
sample with increasing amplification time, c.f. Figure 2g–j. The loss of LRF distribution here is also
due to the agglomeration of the MNP-RCP complexes. These agglomerates sediment in the sample
vials and are visible to the bare eye and therefore their relaxation frequency is out of the measurement
frequency window.
Figure 2. Imaginary component of ac magnetic susceptibility measured using the turn-on detection
strategy versus the excitation frequency from MNP-labeled RCPs of (a) 1.13 pM and (b) 11.3 pM
in concentration amplified for 10, 20, 40 and 60 min. The dilution samples are prepared using
hybridization buffer. All the samples are measured using the NC as the control. The detection
signal in this case increases with increasing RCP concentration and amplification time. The LRF
(Biosensors 2019, 9, 109 7 of 16
Table 1. Estimated number of MNP markers per RCPs, g, for each amplification time and RCP
concentration calculated using Equation (1) and the bi-modal Cole-Cole fitting parameters for the
turn-off and turn-on (DHMA) analysis presented in Figures 1 and 2.
Amplification Times
Measurement Method Concentration Parameters
NC 10 min 20 min 40 min 60 min
g – 8 12 14 18
χ01
0.65 0.61 0.60 0.61 0.55
1.13 pM χ02
LRF (Hz) 6.9 6.9 6.9 6.9 6.9
Turn-off Analysis HRF (Hz) 50.0 50.3 50.2 50.2 50.1
g – 5 6 8 9
χ01
0.73 0.64 0.56 0.47 0.52
11.3 pM χ02
LRF (Hz) 6.9 6.0 6.9 6.9 6.7
HRF (Hz) 52.4 51.8 52.9 52.6 51.3
g – 11 14 14 20
χ01
0.65 5.94 2.09 1.74 4.87
1.13 pM χ02
LRF (Hz) 7.0 0.57 0.85 1.33 0.63
Turn-on Analysis HRF (Hz) 51.0 51.66 41.92 30.61 40.78
g – 3 5 6 8
χ01
0.73 0.25 0.73 1.48 1.04
11.3 pM χ02
LRF (Hz) 7.0 4.91 5.82 6.87 6.88
HRF (Hz) 52.0 34.05 45.82 52.10 52.40
2.2. Effect of RCP Concentration in Turn-On Analysis
To study the effect of the RCP concentration, the DHMA signal is measured for RCPs amplified
for 20 min and concentration ranging from 45 fM to 90 pM. Figure 3a shows the imaginary part
of the differential ac susceptibility as a function of frequency for the NC sample and three positive
test samples with the low RCP concentrations of 45 fM, 113 fM and 226 fM. Two peaks become
prominent with increasing RCP concentration. The LRF peak corresponds to the Brownian relaxation
of the MNP-RCP complex in the positive test sample and the HRF peak is due to unbound MNPs
and its magnitude corresponds to the relative difference between unbound MNPs in the test and
the NC samples. Figure 3b shows the frequencies of the LRF and HRF as a function of RCP
concentration extracted by fitting the imaginary part of the differential ac susceptibility using a
bi-modal Brownian relaxation model. At high RCP concentrations, the LRF and the HRF saturate at 12
and 64.5 Hz, respectively. These frequencies correspond to a characteristic bi-modal distribution of the
functionalized MNPs system in PBS buffer. The ionic strength of the buffer affects the electrostatic
interaction in the solution and changes its viscosity [33] and may even affect the size distribution of
the MNP system [34]. The PBS buffer, in this case, has a lower viscosity compared to the hybridization
buffer due to less salt concentration. Therefore, the values of the LRF and HRF ’of the NC are higher
than the ones in Figures 1 and 2 which are listed in Table 1. At low RCP concentrations, the HRFs
are at higher frequencies than that of the NC. This implies that the smaller particles in the MNP size
distribution hybridizes to the RCPs first. We attribute this to the larger diffusion coefficient of the
smaller particles in the MNP distribution. The diffusion coefficient of a particle in the solution is
inversely related to its size and is given by Equation (2). Considering the large intermolecular distances
at these low concentrations, it is thus more likely for smaller MNPs to meet the RCPs and thus take
precedence in binding during the hybridization process. The MNP system has a log-normal size
distribution with a median hydrodynamic size of 100 nm. Those MNPs with hydrodynamic sizes
smaller than the median 100 nm thus comprise only a small part of the entire MNP population.Biosensors 2019, 9, 109 8 of 16
Figure 3. The binding process between MNPs and RCPs rolled for 20 min at low RCP concentrations.
(a) Imaginary component of differential ac susceptibility versus the frequency for three RCP
concentrations, 45 fM, 113 fM and 226 fM diluted in PBS buffer which results in slightly higher
values for LRF and HRF compared to samples presented in Figures 1 and 2 due to lower viscosity of
the buffer. The lines are the result of fitting to a bi-modal relaxation model. There are two frequency
components visible in the imaginary part of the differential ac susceptibility and they are defined as
the low relaxation frequency peak (LRF) and the high relaxation frequency peak (HRF); (b) The LRF
and HRF are extracted from fitting the bi-modal relaxation model to the imaginary component of the
differential ac susceptibility versus the RCP concentration. For high RCP concentration, the values of
both the LRF and HRF are shifted to 12 and 64.5 Hz, respectively. These two frequencies corresponds
to the LRF and HRF of the intrinsic bi-modal distribution of the NC sample in PBS buffer.
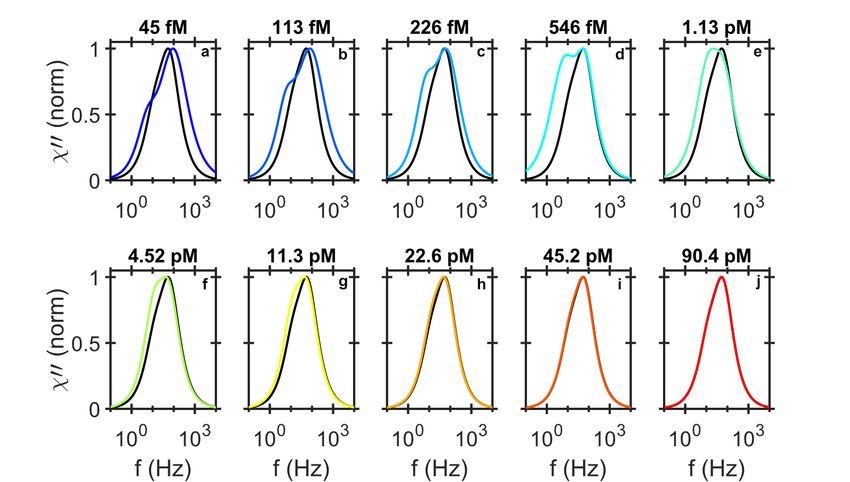
As the RCP concentration increases and the small MNPs in the size distribution are all bound,
the larger MNPs start to hybridize to the RCPs. This results in a shift in the HRF from 100 Hz
to 64.5 Hz. At low concentration of RCPs, the LRF peak position appears at approximately 5 Hz,
which corresponds to the average size of the MNP-RCP complexes, ∼500 nm. With increasing RCP
concentration, the LRF amplitude increases, as more MNP-RCP complex form. The LRF finally slowly
shifts to 12 Hz, which is the LRF of the MNPs. This behaviour is illustrated in Figure 4 where the
shape of the amplitude normalized distribution for different RCP concentrations are compared. We
have previously shown that for this assay the equilibrium dissociation constant is K D = 16.5 pM [31].
The equilibrium dissociation constant is a measure of tendency for the MNP-RCP complex to dissociate
into separate MNP and RCP entities. Also, when the concentration of the RCPs is equal to K D , half of
the MNP markers are consumed. When the concentration of the RCPs is close to or larger than K D ,
it is more likely for a single MNP to conjugate to two or more RCPs and thus form an agglomerate.
The agglomerates can become very large and sedimented, which can be even visible to the bare
eye. The Brownian relaxation frequency of agglomerates falls outside of the measurement frequency
window which shifts the LRF to that of the NC, i.e., 12 Hz. When all MNPs in a positive test sample
are effectively immobilized, the shape of the differential readout signal becomes similar to the one
from the NC sample, see Figure 4g–j.Biosensors 2019, 9, 109 9 of 16
Figure 4. Normalized imaginary component of the differential ac susceptibility. To compare the shape
of the imaginary component of the differential ac susceptibility from different RCP concentrations
diluted in PBS (a–j), we normalized the fitted bi-modal model to the imaginary responses and plotted
them individually with the normalized imaginary response from the NC sample (black line). The
shapes of the response curves, especially at low concentration of the RCPs are very different form the
NC sample. For higher concentration of RCPs, the low frequency contribution decreases and falls
outside of the measurement frequency window and the shape of the response signal becomes similar
to the NC sample.
2.3. Nanoparticle Tracking Analysis
To obtain the size distribution of the RCPs for each amplification time, NTA is employed. The RCPs
in this case are only tagged with fluorescent markers to obtain a more precise size distribution.
Unlike the MNPs that have multiple oligonucleotides covering their surface and may hybridize to
more than one RCP, the fluorescent tagged oligonucleotides can only bind to one RCP and therefore,
they do not induce any agglomeration. Figure 5 shows the size distribution for RCPs with 10, 20, 40
and 60 min amplification times obtained from NTA measurements. The mean and standard deviation
is determined from fitting a normal distribution to the measurements. The mean hydrodynamic
diameter of the RCPs increases only slightly with increasing amplification time. The RCPs with a
longer amplification time, however, have a greater dispersion in their hydrodynamic size distribution
compared to shorter amplification times. The RCPs are diluted in the hybridization buffer for NTA
measurements. The high electrolyte concentration in the buffer makes the RCPs which are DNA coils
more compact and interwound by overcoming the electrostatic repulsion from the negatively charged
backbone of the DNA [35]. The high salt concentration in the buffer make the RCPs to fluoresce as a
single point object which is necessary for tracking the RCPs in the NTA measurements.
Figure 5. NTA number-weighted probability size distribution of the (a) 10; (b) 20; (c) 40 and (d) 60 min
rolled RCPs labelled with fluorescent marker. The mean hydrodynamic diameter, µ, and standard
deviation, σ, are obtained from fitting a normal distribution to the data.Biosensors 2019, 9, 109 10 of 16
3. Discussion
Figure 1c–f compares the Cole-Cole fits to the data from turn-off strategy for test samples of
1.13 pM RCP concentration and different amplification times and it reveals no visible change in the
MNP size distributions. The fit to the test samples entirely overlaps the NC sample. This is also true
even when increasing the RCP concentrations to 11.3 pM, c.f. Figure 1g–j. The LRF and HRF values
extracted for both 1.13 and 11.3 pM RCP concentrations and all four amplification times are the same
as NC sample, i.e., 7 and 51 Hz. The χχ01 02
parameter given in Table 1, which gives the contribution
of the LRF in the total bi-modal distribution, is almost constant and only changes around 20–30%
for the longest amplification time and 11.3 pM concentration of RCPs. Since the variations in fitting
parameters for different NC sample are also around 15%, these changes can be considered insignificant.
The values of the LRF and HRF extracted from all the test samples are also the same as the ones for the
NC sample and therefore, provides no further information about the binding characteristics. The main
issue with this approach is the magnetic background from the unbound MNP markers in the solution.
In the turn-on analysis using the DHMA, however, both the NC sample and the test sample
containing the RCPs are measured simultaneously and their corresponding ac susceptibility signals
subtracted at the sensor. The difference in the particle size distribution of the two samples is measured
and thus, the magnetic background from the excess unbound MNPs in the test sample is eliminated by
the NC sample. The DHMA thus measures the magnetic ac susceptibility from the combination of:
(I) the MNP-RCP complexes in the test sample and (II) the excess MNPs in the NC sample which is a
result of MNPs hybridized to RCPs in the test sample forming the MNP-RCP complexes. The outcome
of this analysis is an assay that is sensitive to the low concentrations of the RCPs and the signature of
the MNP-RCP complex is directly measured in this readout approach. Normalized Cole-Cole fits to
the 1.13 pM RCP concentration, c.f. Figure 2c–f, show a double peak distribution and a clear deviation
from the NC response. The LRF peak is related to the MNP-RCP complexes and the HRF to the excess
markers in the NC sample. As the χχ01 02
parameter is larger than 1, the LRF contribution has a larger
contribution in the bi-modal distribution.
Furthermore, the LRF and HRF peak positions in the DHMA signal depend on the RCP
concentration, c.f. Figure 4, therefore, the whole frequency window especially at low frequencies
should be used as a detection signal. There are two distinct processes that influence the LRF and
HRF peak positions. First, the binding of the MNPs with RCPs and the formation of individual
MNP-RCP complexes. This gives rise to the LRF peak which appears at low frequencies due to larger
hydrodynamic size of the complex compared to the free MNPs. The LRF peak amplitude gradually
increases with increasing the RCP concentration. At 1.13 pM, the LRF peak amplitude is larger than the
HRF peak amplitude. This is the point where the χχ01 02
ratio from the bi-modal Cole-Cole analysis reaches
a maximum value of ≈1.43. Increasing the concentration of the RCP further, cross-linking between
the individual MNP-RCP complexes starts. Since these cross-linked complexes are very large (they
sediment in the sample solutions and are visible by bare eye), the χχ01 02
ratio decreases for increasing
the RCP concentration, and the LRF and HRF saturate to those of the NC at the RCP concentration of
90.4 pM. This implies that the LRF contribution diminishes with increasing RCP concentration due to
the formation of the agglomerates (cross-linked MNP-RCP complex) which have Brownian relaxation
frequencies outside our measurement window.
The estimated number of MNPs per RCP, g, contains an important information that helps optimize
the magnetic assay. Unlike the similar RCA assays, which are based on fluorescent markers, increasing
the amplification time does not drastically increase the number of magnetic markers per RCP. This
can be explained by the fact that the size distribution of the RCPs does not change very much
with amplification time. This is supported by the NTA measurements that reveal rather broad size
distributions for all amplification times. It also shows that the mean hydrodynamic size increases only
slightly with the amplification time. This is also in agreement with the observation that the LRF does
not change with the amplification time, See Figure 2a. The broad size distribution of the RCPs haveBiosensors 2019, 9, 109 11 of 16
also been observed by opening and stretching the RCPs both on a glass and by confinement of DNA in
nanochannels [36].
Comparing the g parameter for the 1.13 pM and 11.3 pM RCP concentrations also indicates
that a higher ratio of MNP per RCP in solution helps increase the number of bound MNPs per
RCP. This means that the assay performs best when the number of markers is in excess of the RCPs.
An apparent way to ensure that, is to use a higher concentration of MNP markers in the assay. That is,
however, unfavourable for the turn-off detection approach as it becomes challenging to resolve the
small detection signal in a presence of a large background. This large background is nevertheless
eliminated in the differential analysis. The advantage of increasing the markers concentration is faster
binding kinetics, especially at low concentration of RCPs.
The turn-on strategy using the DHMA can clearly distinguish the LRF and HRF peaks
corresponding to the MNP-RCP complexes and the unbound MNPs even at very low concentrations of
the RCPs. This is a crucial piece of information which is not available in turn-off detection approaches.
Furthermore, we observe a preferential binding of the smaller MNPs to RCPs at low concentrations
of RCPs and also formation of agglomerates due cross-linking of individual MNP-RCP complexes
at high RCP concentrations. Increasing the amplification time does not significantly increase the
number of MNPs bound to each individual RCP which is important for optimization of the magnetic
assay and increasing its sensitivity to target analyte. This has also been confirmed by the NTA
measurements. The zero starting signal in the DHMA makes the quantification of MNP-labeled
RCPs easier and provides us with a powerful technique for dynamically characterizing the binding
interactions between MNPs and biomolecules in fluid volumes. The LRF peaks can be monitored over
time during the hybridization process to provide time dependent analysis. By incorporating a heater
in the PDMS chip and sweeping the temperature through the melting point of the MNP-RCP binding,
the binding/releasing of the MNPs to/from RCPs can be observed over time. The performance of the
biosensor can also be improved by fully implementing the nucleic acid assay on a lab-on-a-chip.
4. Materials And Methods
4.1. Rolling Circle Amplification
Vibrio cholerae synthesized target DNA (Biomers, Ulm, Germany) is hybridized to the padlock
probe and ligated forming a circle DNA. The padlock probe is a linear molecule with target
complementary ends. To perform this, a ligation mixture of 5 µL of 10 × φ29 buffer, 2.5 µL ATP
(20 mM), 1 µL padlock probe (1 µM), 3 µL target DNA (1 µM), 1 µL T4 ligase (1 U/µL) and 37.5 µL
Milli-Q water is prepared and incubated at 37 ◦ C for 15 min. The circular padlock probes are then
amplified for different times using the RCA method to form RCPs of different sizes. The RCA mixture
consists of 25 µL of the ligation mix prepared earlier, 6 µL of 10 × φ29 buffer, 4 µL dNTP (2.5 mM),
6 µL BSA (2 µg/µL), 0.4 µL of φ29 polymerase (10 U/µL), and 18.6 µL of Milli-Q water. Four RCA
mixtures are prepared and incubated at 37 ◦ C for 10, 20, 40 and 60 min followed by 5 min of enzyme
inactivation at 65 ◦ C. To obtain a solution containing 5 nM RCPs (based on the initial padlock probe
concentration), 40 µL of hybridization buffer containing 0.1 M EDTA, 0.1 M Tris-HCl (pH 8), 0.005%
Tween 20, and 2.5 M NaCl is added to the mixtures. Considering the 22.6% success rate of the assay [37],
the effective RCP concentration of the mixtures are 1.13 nM instead of 5 nM. By further diluting the
original RCP mixture with hybridization buffer, we prepare different concentrations of RCPs for the
experiments. Table 2 lists the sequences for the target, padlock probe and the detection oligonucleotide.Biosensors 2019, 9, 109 12 of 16
Table 2. DNA sequences of target, padlock probe and detection oligonucleotide for rolling circle
amplification of Vibrio Cholerae. The padlock probe has motifs that matches the target Cholera
sequence (green and blue) and forms a circle by hybridizing to it. The detection oligonucleotide is part
of the padlock probe (red) and therefore, hybridizes with the RCP of the circularized padlock probe.
Oligonucleotides Sequences from 5’ to 3’
Target CCCTGGGCTCAACCTA GGAATCGCATTTG
Padlock probe TAGGTTGAGCCCAGGG ACTTCTAGAGTGTACCGACCTCAGTAGCCGTGACTATCGACTT
GTTGATGTCATGTGTCGCAC CAAATGCGATTCC
Detection oligonucleotide biotin-TTTTTTTTTTTTTTTTTTTT GTTGATGTCATGTGTCGCAC- atto488
4.2. Labelling The Rcps
In this study, we labeled the RCPs with fluorescent marker of atto-488 or magnetic markers
consisting of magnetic nanoparticle. The atto-488 are attached to the 3’ side of the detection
oligonucleotide and have their excitation wavelength in the range of the laser wavelength used
in our NTA setup. The MNP system used, according to its datasheet, is a suspended iron oxide-based
streptavidin coated multi-core particles with median diameter of 100 nm for the core (micromod
Partikeltechnologie GmbH, Rostock, Germany). The detection oligonucleotides also have a biotinylated
side which can bind to the streptavidin coating of the MNPs and functionalizing them for specific
binding to the RCPs. To do so, the MNPs (10 mg/mL) are washed twice with 1 × Wtw buffer
(10 mM Tris-HCl, 5 mM EDTA, 0.1% Tween 20, 0.1 M NaCl) using a permanent magnet and thereafter
re-suspended in the 1 × Wtw buffer and incubated with 10 µM biotin-conjugated oligonucleotides
for 30 min at room temperature. After incubation, the MNPs are washed again twice with the 1 ×
Wtw buffer and suspended in phosphate-buffered saline (PBS) in its original volume. To conjugate the
fluorescent or the magnetic markers to the RCPs, either of the two markers and the RCPs are mixed
and the solution incubated for 20 min at 55 ◦ C. Different concentrations are prepared by diluting the
mixture in PBS or hybridization buffer.
4.3. Nanoparticles Tracking Analysis
Nanoparticle tracking analysis (NTA) is a technique that uses either the light scattering or
fluorescence signal to track Brownian motion from which it can determine the size distribution of
samples in liquid suspension. A laser beam of specific wavelength is passed into the sample chamber
containing the nanoparticle suspension with reduced profile [38]. The particles in the path of the beam
then scatter or absorb the light which is easily visible using a low magnification microscope objective.
A CMOS camera records the particles movement in the fields of view. A software then identifies each
particle and tracks its movements under Brownian motion on a frame by frame basis and calculates the
average distance moved by the particle. The spherical equivalent of the particle diameter, d, is given
by the Stokes-Einstein equation
D = kT/3πηd (2)
where D is the particle diffusion coefficient, k is the Boltzman’s constant and T is the temperature. The
NTA measurements were performed with a NanoSight LM20 (Nanosight, Amesbury, UK) which uses
a 488-nm laser. The samples were injected in the sample chamber using a sterile syringe and a syringe
pump. All measurements are performed at room temperature and samples were measured three times
for 180 s with manual shutter and gain adjustment.
4.4. Magnetic Ac Susceptibility Analysis
For the studied 100 nm magnetic particle system, the Brownian relaxation time is shorter than
Néel relaxation and therefore, the effective relaxation process associated with this particle system
is dominated by the Brownian rotational motion. The Brownian relaxation time, τB , and frequency,
f B , of the MNP ensemble is given byBiosensors 2019, 9, 109 13 of 16
τB = 1/(2π f B ) = 3ηVB /kT (3)
where η is the viscosity of the solvent, k is the Boltzman’s constant, T is the temperature and VB is
the hydrodynamic volume of the particle. The MNPs are functionalized with fluorescent marked
biotinylated oligonucleotide strands for hybridization with the RCPs.
The dynamic magnetic properties of the suspended MNP ensemble are detected using magnetic
ac susceptibility. An ac magnetic field in the range of 1–3000 Hz is applied to the sample and both
the in-phase and out-of-phase components of the magnetic response of the solution is measured
using first order planar high transition superconductor gradiometer loop coupled to a high-Tc
superconducting quantum interference device (SQUID). The in-phase and out-of-phase response of
the sample correspond to the real and imaginary components of the complex susceptibility. The actual
complex susceptibility is a calibration factor that converts the voltage output of the sensor to the
sample magnetic moment. Therefore, the susceptibility signals are expressed in voltage.
Here we use two strategies for detection of target molecules using the ac susceptibility analysis,
turn-off and turn-on (or differential) strategies. In the turn-off detection, a NC samples is measured,
and the peak amplitude of imaginary component is taken as a reference point. Upon binding of the
MNPs to the target molecules, the magnitude of the peak amplitude of the imaginary component
of the ac susceptibility decreases which is taken as the detection signal [9,17,27]. The differential ac
susceptibility takes advantage of the symmetry in the gradiometer sensor to measure the relative
difference in the ac susceptibility responses of two suspended magnetic samples. The magnetic flux
from each sample is coupled to an individual loop of the gradiometer using two identical microfluidic
channels that are aligned parallel to the baseline of the gradiometer. The screening current in each
loop is then subtracted in the middle line of the loop measured by the SQUID providing the relative
difference in the ac susceptibility of the two samples [31]. A bi-modal relaxation model based on a
superposition of two Cole-Cole models [19]:
χ01 χ02
χ(ω ) = + + χhigh (4)
1 + (iωτ1 )α1 1 + (iωτ2 )α2
is used to fit to the data presented here. χ01 and χ02 are the DC susceptibilities, χhigh is the high
frequency contribution to the real part of the susceptibility, τ1 and τ2 are the relaxation time and α1 and
α2 are the phenomenological relaxation distribution parameters for the 1st and 2nd relaxation modes,
respectively. The resulting frequencies are extracted from τ1 and τ2 and are related to the HRF and
LRF from the unbound MNPs and the MNP-RCP complexes, respectively.
5. Patents
S.S., A.K., and D.W. are co-inventors of a patent filed at the Swedish patent and registration office,
patent pending 1950159-2(2019), on the DHMA.
Supplementary Materials: The following are available online at http://www.mdpi.com/2079-6374/9/3/109/s1,
Figure S1: (a) A schematic diagram of the DHMA, (b) turn-off detection approach (c) turn-on detection approach;
Figure S2: Turn-on detection signal versus the RCP concentration.
Author Contributions: Conceptualization and methodology, S.S., A.K., D.W., J.F.S. and C.J.; investigation S.S.;
NTA investigation B.A., S.S.; formal analysis, S.S.; NTA data analysis, S.S., B.A.; resources A.J., M.N., M.S., J.A.,
A.K., and D.W.; supervision A.K., J.F.S., C.J. and D.W.; visualization, S.S.; writing—original draft preparation, S.S.;
writing—review and editing, S.S., B.A., T.Z.G.d.l.T., J.F.S., J.B., A.J., C.J., M.N., J.A., M.S., D.W., A.K.
Funding: This work was supported through the Swedish Foundation for Strategic Research (SSF) Grant “FLU-ID”
No. SBE13-0125, the Swedish Research Council Grant 2015-03640, the Knut and Alice Wallenberg foundation,
and the Swedish Infrastructure for Micro-and Nanofabrication–Myfab.
Conflicts of Interest: The authors declare no conflict of interest. The funders had no role in the design of the
study; in the collection, analyses, or interpretation of data; in the writing of the manuscript, or in the decision to
publish the results.Biosensors 2019, 9, 109 14 of 16
Abbreviations
The following abbreviations are used in this manuscript:
MNP magnetic nanoparticle
RCA rolling circle amplification
RCP rolling circle product
DHMA differential homogenous magnetic assay
SQUID superconducting quantum interference device
NTA nanoparticle tracking analysis
HRF high relaxation frequency
LRF low relaxation frequency
References
1. Ali, M.M.; Li, F.; Zhang, Z.; Zhang, K.; Kang, D.K.; Ankrum, J.A.; Le, X.C.; Zhao, W. Rolling circle
amplification: A versatile tool for chemical biology, materials science and medicine. Chem. Soc. Rev.
2014, 43, 3324–3341. [CrossRef] [PubMed]
2. Zhao, Y.; Chen, F.; Li, Q.; Wang, L.; Fan, C. Isothermal Amplification of Nucleic Acids. Chem. Rev.
2015, 115, 12491–12545. [CrossRef] [PubMed]
3. Nilsson, M.; Malmgren, H.; Samiotaki, M.; Kwiatkowski, M.; Chowdhary, B.P.; Landegren, U. Padlock
probes: Circularizing oligonucleotides for localized DNA detection. Science 1994, 265, 2085–2088. [CrossRef]
[PubMed]
4. Banér, J.; Nilsson, M.; Mendel-Hartvig, M.; Landegren, U. Signal amplification of padlock probes by rolling
circle replication. Nucleic Acids Res. 1998, 26, 5073–5078 [CrossRef] [PubMed]
5. Kuhn, H.; Demidov, V.V.; Frank-Kamenetskii, M.D. Rolling-circle amplification under topological constraints.
Nucleic Acids Res. 2002, 30, 574–580. [CrossRef] [PubMed]
6. Mahmoudian, L.; Kaji, N.; Tokeshi, M.; Nilsson, M.; Baba, Y. Rolling circle amplification and circle-to-circle
amplification of a specific gene integrated with electrophoretic analysis on a single chip. Anal. Chem.
2008, 80, 2483–2490. [CrossRef] [PubMed]
7. Schweitzer, B.; Wiltshire, S.; Lambert, J.; O’Malley, S.; Kukanskis, K.; Zhu, Z.; Kingsmore, S.F.; Lizardi, P.M.;
Ward, D.C. Immunoassays with rolling circle DNA amplification: A versatile platform for ultrasensitive
antigen detection. Proc. Natl. Acad. Sci. USA 2000, 97, 10113–10119. [CrossRef]
8. Zhao, W.; Gao, Y.; Kandadai, S.A.; Brook, M.A.; Li, Y. DNA polymerization on gold nanoparticles
through rolling circle amplification: Towards novel scaffolds for three-dimensional periodic nanoassemblies.
Angew. Chem. Int. Ed. 2006, 45, 2409–2413. [CrossRef]
9. Strömberg, M.; Göransson, J.; Gunnarsson, K.; Nilsson, M.; Svedlindh, P.; Strømme, M. Sensitive Molecular
Diagnostics Using Volume-Amplified Magnetic Nanobeads. Nano Lett. 2008, 8, 816–821. [CrossRef]
10. Cheng, W.; Yan, F.; Ding, L.; Ju, H.; Yin, Y. Cascade signal amplification strategy for subattomolar protein
detection by rolling circle amplification and quantum dots tagging. Anal. Chem. 2010, 82, 3337–3342.
[CrossRef]
11. Kudr, J.; Haddad, Y.; Richtera, L.; Heger, Z.; Cernak, M.; Adam, V.; Zitka, O. Magnetic Nanoparticles: From
Design and Synthesis to Real World Applications. Nanomaterials 2017, 7, 243. [CrossRef] [PubMed]
12. Koh, I.; Josephson, L. Magnetic Nanoparticle Sensors. Sensors 2009, 9, 8130–8145. [CrossRef] [PubMed]
13. Schrittwieser, S.; Pelaz, B.; Parak, W.J.; Lentijo-Mozo, S.; Soulantica, K.; Dieckhoff, J.; Ludwig, F.; Guenther, A.;
Tschöpe, A.; Schotter, J. Homogeneous biosensing based on magnetic particle labels. Sensors 2016, 16, 828.
[CrossRef] [PubMed]
14. Dalslet, B.T.; Damsgaard, C.D.; Donolato, M.; Strømme, M.; Strömberg, M.; Svedlindh, P.; Hansen, M.F.
Bead magnetorelaxometry with an on-chip magnetoresistive sensor. Lab Chip 2011, 11, 296–302. [CrossRef]
[PubMed]
15. Strömberg, M.; Zardán Gómez de la Torre, T.; Göransson, J.; Gunnarsson, K.; Nilsson, M.; Svedlindh, P.;
Strømme, M. Multiplex detection of DNA sequences using the volume-amplified magnetic nanobead
detection assay. Anal. Chem. 2009, 81, 3398–3406. [CrossRef] [PubMed]
16. Göransson, J.; Zardán Gómez De La Torre, T.; Strömberg, M.; Russell, C.; Svedlindh, P.; Strømme, M.;
Nilsson, M. Sensitive detection of bacterial DNA by magnetic nanoparticles. Anal. Chem. 2010, 82, 9138–9140.
[CrossRef] [PubMed]Biosensors 2019, 9, 109 15 of 16
17. Sepehri, S.; Eriksson, E.; Kalaboukhov, A.; Zardán Gómez de la Torre, T.; Kustanovich, K.; Jesorka, A.;
Schneiderman, J.F.; Blomgren, J.; Johansson, C.; Strømme, M.; et al. Volume-amplified magnetic bioassay
integrated with microfluidic sample handling and high- Tc SQUID magnetic readout. APL Bioeng.
2018, 2, 016102. [CrossRef]
18. Zardán Gómez De La Torre, T.; Mezger, A.; Herthnek, D.; Johansson, C.; Svedlindh, P.; Nilsson, M.;
Strømme, M. Detection of rolling circle amplified DNA molecules using probe-tagged magnetic nanobeads
in a portable AC susceptometer. Biosens. Bioelectron. 2011, 29, 195–199. [CrossRef]
19. Ahrentorp, F.; Blomgren, J.; Jonasson, C.; Sarwe, A.; Sepehri, S.; Eriksson, E.; Kalaboukhov, A.; Jesorka, A.;
Winkler, D.; Schneiderman, J.F.; et al. Sensitive magnetic biodetection using magnetic multi-core nanoparticles
and RCA coils. J. Magn. Magn. Mater. 2017, 427, 14–18. [CrossRef]
20. Donolato, M.; Antunes, P.; Bejhed, R.S.; Zardán Gómez De La Torre, T.; Østerberg, F.W.; Strömberg, M.;
Nilsson, M.; Strømme, M.; Svedlindh, P.; Hansen, M.F.; et al. Novel readout method for molecular diagnostic
assays based on optical measurements of magnetic nanobead dynamics. Anal. Chem. 2015, 87, 1622–1629.
[CrossRef]
21. Tian, B.; Qiu, Z.; Ma, J.; Donolato, M.; Hansen, M.F.; Svedlindh, P.; Strömberg, M. On-Particle Rolling Circle
Amplification-Based Core-Satellite Magnetic Superstructures for MicroRNA Detection. ACS Appl. Mater.
Interfaces 2018, 10, 2957–2964. [CrossRef] [PubMed]
22. Tian, B.; Liao, X.; Svedlindh, P.; Strömberg, M.; Wetterskog, E. Ferromagnetic Resonance Biosensor for
Homogeneous and Volumetric Detection of DNA. ACS Sens. 2018, 3, 1093–1101. [CrossRef] [PubMed]
23. Connolly, J.; St Pierre, T.G. Proposed biosensors based on time-dependent properties of magnetic fluids.
J. Magn. Magn. Mater. 2001, 225, 156–160. [CrossRef]
24. Astalan, A.P.; Ahrentorp, F.; Johansson, C.; Larsson, K.; Krozer, A. Biomolecular reactions studied using
changes in Brownian rotation dynamics of magnetic particles. Biosens. Bioelectron. 2004, 19, 945–951.
[CrossRef] [PubMed]
25. Hong, C.Y.; Wu, C.C.; Chiu, Y.C.; Yang, S.Y.; Horng, H.E.; Yang, H.C. Magnetic susceptibility reduction
method for magnetically labeled immunoassay. Appl. Phys. Lett. 2006, 88, 2004–2007. [CrossRef]
26. Blomgren, J.; Ahrentorp, F.; Ilver, D.; Jonasson, C.; Sepehri, S.; Kalaboukhov, A.; Winkler, D.;
Zardán Gómez De La Torre, T.; Strømme, M.; Johansson, C. Development of a Sensitive Induction-Based
Magnetic Nanoparticle Biodetection Method. Nanomaterials 2018, 8, 887. [CrossRef] [PubMed]
27. Donolato, M.; Antunes, P.; de la Torre, T.Z.G.; Hwu, E.T.; Chen, C.H.; Burger, R.; Rizzi, G.; Bosco, F.G.;
Strømme, M.; Boisen, A.; et al. Quantification of rolling circle amplified DNA using magnetic nanobeads
and a Blu-ray optical pick-up unit. Biosens. Bioelectron. 2015, 67, 649–655. [CrossRef] [PubMed]
28. Strömberg, M.; Zardán Gómez de la Torre, T.; Göransson, J.; Gunnarsson, K.; Nilsson, M.; Strømme, M.;
Svedlindh, P. Microscopic mechanisms influencing the volume amplified magnetic nanobead detection
assay. Biosens. Bioelectron. 2008, 24, 696–703. [CrossRef] [PubMed]
29. Bejhed, R.S.; Zardán Gómez de la Torre, T.; Donolato, M.; Hansen, M.F.; Svedlindh, P.; Strömberg, M.
Turn-on optomagnetic bacterial DNA sequence detection using volume-amplified magnetic nanobeads.
Biosens. Bioelectron. 2015, 66, 405–411. [CrossRef] [PubMed]
30. Zardán Gómez De La Torre, T.; Strömberg, M.; Russell, C.; Göransson, J.; Nilsson, M.; Svedlindh, P.;
Strømme, M. Investigation of immobilization of functionalized magnetic nanobeads in rolling circle amplified
DNA coils. J. Phys. Chem. 2010, 114, 3707–3713. [CrossRef] [PubMed]
31. Sepehri, S.; Zardán Gómez de la Torre, T.; Schneiderman, J.; Blomgren, J.; Jesorka, A.; Johansson, C.;
Nilsson, M.; Albert, J.; Strømme, M.; Winkler, D.; et al. Homogeneous differential magnetic assay.
ACS Sens. 2019. [CrossRef] [PubMed]
32. Lin, C.; Zhang, Y.; Zhou, X.; Yao, B.; Fang, Q. Naked-eye detection of nucleic acids through rolling circle
amplification and magnetic particle mediated aggregation. Biosens. Bioelectron. 2013, 47, 515–519. [CrossRef]
[PubMed]
33. Earle Waghorne, W. Viscosities of electrolyte solutions. Philos. Trans. R. Soc. Lond. Ser. 2001, 359, 1529–1543.
[CrossRef]
34. Zimbone, M.; Baeri, P.; Calcagno, L.; Musumeci, P.; Contino, A.; Barcellona, M.L.; Bonaventura, G. Dynamic
Light Scattering on Bioconjugated Laser Generated Gold Nanoparticles. PLoS ONE 2014, 9, e89048.
[CrossRef] [PubMed]Biosensors 2019, 9, 109 16 of 16
35. Schlick, T.; Li, B.; Olson, W. The influence of salt on the structure and energetics of supercoiled DNA.
Biophys. J. 1994, 67, 2146–2166. [CrossRef]
36. Dekoning, N. A Rolling Circle Amplification-Based Methodology for Making Long, Sequence–Repeating ,
DNA Duplexes. Master’s Thesis, Chalmers University of Technology, Gothenburg, Sweden, 2018.
37. Kühnemund, M.; Hernández-Neuta, I.; Sharif, M.I.; Cornaglia, M.; Gijs, M.A.; Nilsson, M. Sensitive and
inexpensive digital DNA analysis by microfluidic enrichment of rolling circle amplified single-molecules.
Nucleic Acids Res. 2017, 45, 59. [CrossRef] [PubMed]
38. Carr, B.; Wright, M. Nanoparticle Tracking Analysis: A Review of Applications and Usage 2012–2012;
NanoSight Ltd.: Salisbury, UK, 2012; p. 188.
c 2019 by the authors. Licensee MDPI, Basel, Switzerland. This article is an open access
article distributed under the terms and conditions of the Creative Commons Attribution
(CC BY) license (http://creativecommons.org/licenses/by/4.0/).You can also read