Optimization and Improvement of Emulsion PCR for the Ion Torrent Next-Generation Sequencing Platform
←
→
Page content transcription
If your browser does not render page correctly, please read the page content below
Optimization and Improvement of Emulsion PCR for
               the Ion Torrent Next-Generation Sequencing Platform

                                                                                               Jimmy Perrott
                                                                                               March 17, 2011

          Next-generation Sequencing (NGS) techniques are opening exciting opportunities in the field of life
sciences. Over the past 5 years, high-throughput sequencing platforms have become widely available, but the race
to develop new sequencing platforms, at a reduced cost, is still continued. The existing platforms are available only
to larger institutes or genome sequencing centers. Ion Torrent’s Personal Genome Machine (PGM), recently
released, is promising with respect to cost and complexity associated with sequencing. Like all other NGS
instruments, the longer read length is the challenge for the PGM. To improve the average read length, the total
number of template fragments per bead must be maximized to increase the signal intensity. The signal intensity
produced during a sequencing run is directly proportional to the average read length which would ultimately reduce
the cost.
          For higher amplification yield, I investigated the effect of several PCR boosts including; 3 PCR boosts
from Biometrica Inc., Ammonium Sulfate, and Spermidine on the specific amplification of unique fragments on the
hydrogel beads during emulsion PCR. The emulsion breaking efficiency was evaluated using different alcohols such
as butanol, isopropanol, and octanol. Additionally, the bead washing was optimized by using different detergents
such as Saline-Sodium Citrate (SSC) and Sodium Dodecyl Sulfate (SDS). Also, bead loading was improved by using
a solution of Phosphate Buffer Saline-Tween (PBS-Tw) and glycerol to increase bead density on the CMOS chip.
          The results indicate that Ammonium Sulfate and Spermidine proved to enhance specific amplification on
the hydrogel beads during emulsion PCR. Ammonium Sulfate increased the Q17 average read length from 54bp to
71bp along with the total reads from 33,231 reads to 109,494 reads, whereas Spermidine had increased the Q17
average read length from 54bp to 66bp along with the total reads from 33,231 reads to 191,800 reads. However, the
three Biometrica PCR boosts didn’t show any significant impact on amplification as well as read length. In regards
to breaking and washing, isopropanol and octanol were inadequate for breaking the emulsion while butanol was
shown to be the most effective at breaking emulsions. These results also show that SSC wash detergent significantly
decreased the bead clumping while glycerol helped to increase the bead density, which together, improved the bead
loading on the CMOS chip. These results demonstrate the improvements in over all average read length and
through-put of thePGM.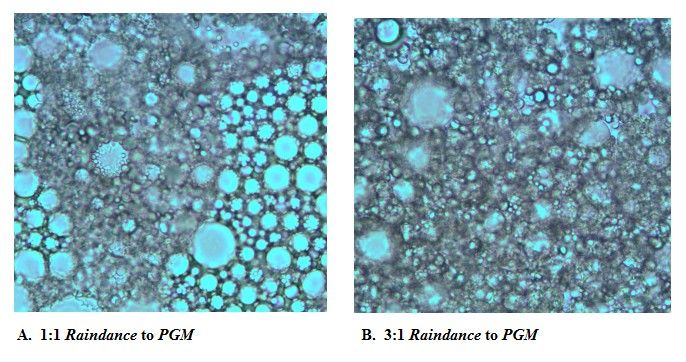
Perrott 2

                             Table of Contents

      Section                                                   Page Number
I.    Scope and Goals .......................................................... 3
II. What is Emulsion PCR ................................................ 3
III. Challenges in Emulsion PCR ...................................... 5
IV. Micro-reactor Size Optimization ................................ 6
V.     Stability of the Emulsion ............................................ 9
     1.   Oil to Aqueous ratio ................................................. 10
     2.   Choice of Oil .......................................................... 10
VI. PCR component Optimization .................................. 11
VII. Additional PCR Additives ......................................... 14
VIII. Post PCR Optimization ............................................. 17
IX. Increasing Bead Density ........................................... 19
X. Summary of Results .................................................. 19
XI. Discussion ................................................................. 20
XII. Conclusion ................................................................ 21
XIII. Acknowledgments .................................................... 21
XIV. Appendix A: Supplemental Figures .......................... 21
XV. Appendix B: Chemicals & Materials ........................ 22
XVI. Appendix C: Optimized Protocol .............................. 23
XVII. References ................................................................. 25
Perrott 3

  I. Scope and Goals
       One particular downfall of NGS platforms is that they rely heavily on cameras and
imaging systems, or sensitive pH sensors in the case of the PGM. These imaging systems and
sensors have not been designed to detect single fluorescent events 1, so to overcome this issue,
amplified template using emulsion PCR (emPCR) is required. EmPCR is basically all the PCR
reagents along with a 1μm hydrogel bead that is coated with primers that are complementary to
adapters which have been ligated to the DNA library. This PCR mixture is then mixed with oil to
produce micro-reactors. Ideally within each micro-reactor, there will be one DNA template
along with one bead. When the emulsion undergoes PCR, the isolated template is amplified
around the bead producing monoclonal templated beads which are ready for sequencing.
       In this report I describe several new components that help to increase the amplification of
DNA template during emPCR. These additional components increased both the average read
length and the total reads of Ion Torrent Inc.'s PGM, a sequencing machine that integrates charge
perturbation technology to detect liberated protons during nucleotide incorporation 2. Like many
other NGS platforms, the PGM is based on the massively parallel sequencing-by-synthesis
approach. In this method, when DNA polymerase acts in synchronization a readable signal is
produced.   Due to emPCR producing monoclonal templated beads, this synchronization is
possible. The motivation for improving and optimizing emPCR is to improve the signal-to-noise
ratio which will in turn increase the average read length of the PGM.

  II. What is Emulsion PCR
         Most of the biotechnological advances that have been made in the 20 th century have
included some method where a single molecule of DNA is amplified. Among the first few DNA
amplification techniques, two were molecular cloning3 and PCR4. Molecular cloning involved
isolating a DNA strand, ligating it into a vector, typically a plasmid, and transforming bacterial
cells by subjecting the cells to electroporation. Positively transformed cells are then screened
and selected by using X-gal and antibiotics. Molecular cloning was ideal because each bacterial
cell was naturally isolated from each other, inherently separating the different populations
arising, however cloning still has many other problems. In PCR-based methods, the only way to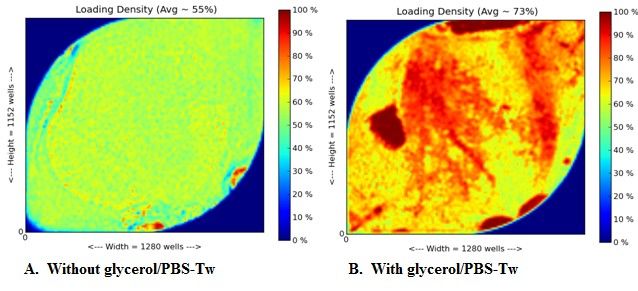
Perrott 4

get separate products was by putting each template in individual compartments or tubes, thus an
alternative method was needed to separate products using simply one tube. EmPCR alleviates
the need to use separate tubes to produce large populations of PCR products.
         EmPCR works by performing a simple PCR reaction and adding it into a bulk oil phase
and shaking the mixture, to produce approximately 10 10 micro-reactors in a 1mL tube 5. The
micro-reactors formed are also very stable at high temperatures making emPCR an elegant
solution for separating PCR products. In an ideal emPCR there will be exactly one of each of the
components of a single PCR reaction isolated inside each micro-reactor. For emPCR to be used
in NGS platforms an additional component must be added. This component is a 1μm hydrogel
bead coated with primers that are complementary to the adapters which have been ligated to the
library during library preparation. After emPCR, the hydrogel beads contain thousands of copies
of the single DNA molecule originally present. These beads are then recovered through a series
of centrifugations and washings and are now ready for sequencing.
         Emulsions are biphasic systems consisting of two immiscible liquids. One liquid serves
as the dispersion phase–the phase dispersed as uniform droplets–whereas the other liquid serves
as the dispersion medium which is the phase that the droplets are dispersed in. When forming an
emulsion, there are two main types that can form, water-in-oil or oil-in-water emulsions. These
two types depend entirely on the volumes of the two immiscible liquids mixed together. EmPCR
uses the water-in-oil form. The oil serves as the dispersion medium while the aqueous serves as
the dispersed phase. When optimizing emPCR for next-generation sequencing platforms, is it
important to determine the ratio of each phase so that uniform droplets can form.
         Apart from the ratio of both phases being important, the type of oil used in the emPCR
can make all the difference when producing monoclonal products. Oils are defined as any
substance that is liquid at ambient temperatures and is hydrophobic but also soluble in organic
solvents6. Several different oils have been used in various sequencing platforms. Each oil's
viscocity and color is determined by the size of hydrocarbon molecules in the oil. That is to say,
longer hydrocarbon chains give rise to more viscous oils, which in turn require an organic
solvent with long hydrocarbon chains in order to break the emulsion. In this report I work with
two different oils to determine the best one to produce monoclonal products.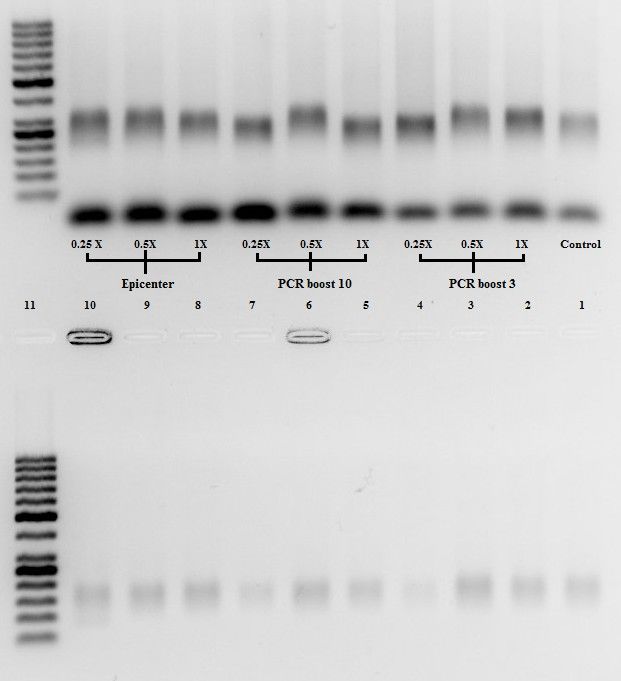
Perrott 5

  III. Challenges in Emulsion PCR
         As simple a solution as emPCR is for next-generation sequencing platforms, some
challenges arise: having a uniform size of the micro-reactors, having a stable emulsion during
PCR, ensuring a single DNA template per micro-reactor, recovering beads after PCR, and
reducing the formation of bead aggregates during bead recovery. In this paper, I discuss how all
five challenges have been dealt with to allow whole genome sequencing of the Vibrio cholerae
(VC) bacteria.
         First and foremost, the size of the micro-reactors predominantly determine the overall
effectiveness of the emPCR, because the size of the micro-reactor formed through shaking
effectively determines the initial concentrations of each of the PCR components. The effective
size range of the micro-reactors I wanted was between 20μm and 30μm in diameter. Within this
range, a coverage–the ratio of nucleotides generated to the size of the reference genome–of 0.94
was achieved. In the case of micro-reactors reaching diameters in both extremes of the optimal
range–that being either below 20μm or above 30μm–the overall coverage is reduced. This is
because during PCR, either essential co-factors are missing due to the micro-reactors being too
small or polyclonal beads are produced due to the micro-reactors having more than one DNA
template. In either case the size of the micro-reactor is key to producing monoclonal templated
beads.
         The stability of the emulsion to withstand intense heat is as important as having a
consistent size of micro-reactors. If a PCR tube is not sealed properly, the heat from the PCR
machine can cause the emulsion to break. What happens is the heat causes the water molecules
to vibrate and begin to coalesce producing larger water droplets. This coalescence then causes
the two phases of oil and water to separate. In this instance, PCR components are released from
their isolated compartments and DNA templates are able to bind to other beads producing
polyclonal beads. Polyclonal templated beads will give mixed signals during sequencing.
         Apart from the size and stability of the micro-reactors, the initial concentration of DNA
template per micro-reactor can significantly impact the total coverage percentage during
sequencing. The DNA must be optimally diluted so that when amplified, each bead will have a
single DNA molecule. This along with a highly stable emulsion can yield a high percentage of
live beads, which are the beads that have been detected by the sequencing machine. Live beads
Perrott 6
contain the key pass DNA sequence “TCAG,” which is a sequence which later helps software to
determine which beads successfully had templates attached to them. A higher percentage of live
beads to total beads allows unnecessary signals to be excluded by the sequencing machine
essentially increasing the signal-to-noise ratio.
Although the previously stated challenges have proven to be the most important to
optimize in emPCR, without good bead recovery, there can be no downstream sequencing. With
a starting number of 50 million hydrogel beads per emulsion, only 1.4% of those beads are
recovered. Bead recovery starts by adding some type of alcohol (e.g, butanol) to cause the
emulsion to break. By adding twice the amount of an alcohol as the emulsion, the emulsion can
be broken and through a series of centrifugations the beads can be recovered. A good bead
recovery yields a little more than 1.4% live beads to total starting number. The reason for low
recovery is attributed to a poorly broken emulsion which causes the beads to not properly pellet.
In this instance beads still in suspension are discarded accidentally during breaking and washing.
Last, during bead recovery a common challenge is the formation of bead aggregates.
The formation of these aggregates is caused by residual oil left on the beads causing the beads to
clump, as well as the DNA entangling each other. By washing the beads several times with a
detergent, and subjecting the sample to short 30 minute bursts of sonication, these aggregates can
be minimized. Subjecting the beads for more than a 1 minute of sonication, however causes the
beads to break as well as damages the DNA. Short bursts of sonication help later on to allow the
beads to be loaded one per well on the sequencing machine.
IV. Micro-reactor size Optimization
As discussed earlier, an important challenge in emPCR is making sure the size of the
micro-reactors are consistently within the range 20μm-30μm in diameter. To determine the size
of the micro-reactors, I used a microscope to measure 1mm of a ruler at 40X magnification to
determine the scale. Using the same microscope at the same magnification, I took a picture of a
5μL sample taken from the emulsion prior to loading into the thermocycler. From that picture, I
manually measured the size of each micro-reactor using my scale. I then recorded the average
size as well as standard error for each picture. Results are averaged over 7 experiments with a
total of 35 pictures.Perrott 7 Figure 1: Optimizing micro-reactors using Raindance oil. Sample was subject to the tissuelyser at a constant 20 Hz with varying times. Image A was taken after 30 seconds of shaking. Each subsequent image was taken 30 seconds apart. As you can see above, the more time the emulsions were shaken for the more the micro-reactors become indistinguishable, meaning the micro-reactors become so disrupted that the circular shapes are not noticeable. A time between 60 to 90 seconds produced micro-reactors within range. Image F was not part of the Raindance series, but shows the size range of micro-reactors using the standard PGM shaking conditions. Average size distribution: A)26.93μm ± 7.82μm B)25.60μm ± 4.38μm C)23.02μm ± 3.35μm D)21.94μm ± 2.28μm E)Indistinguishable F)22.33μm ± 2.86μm. Images were all taken using the same lighting at 40X magnification.
Perrott 8

         The standard protocol to produce micro-reactors uses PGM oil and requires the
addition of one 3mm steel ball per reaction to introduce turbulence as well as subjecting the
samples to a tissuelyser. The tissuelyser is a machine that oscillates the reactions at high
frequencies with no control over amplitude. The standard conditions to produce an emulsion
using the tissuelyser is 10sec at 15Hz and 7sec at 17Hz. After using the tissuelyser, the 3mm ball
is discarded and the emulsion is distributed into eight PCR tubes. The average size of micro-
reactors produced using the standard PGM protocol is 22.33μm ± 2.86μm.
        Using the PGM oil as the standard, I first experimented with Raindance oil. I started out
by subjecting the sample to 5 different trials on the tissuelyser differing by time alone. I
expected that the more time used to shake the smaller the micro-reactors will be. By adding a
single 3mm steel ball and starting at a frequency of 20 Hz, Figure 1 shows the longer you subject
a sample to the tissuelyser, the more the micro-reactors shrink until they essentially become
indistinguishable to the camera. Images B & C of Figure 1 show the most promising size
distribution of micro-reactors. Shaking the sample for 60sec at 20Hz yields an average size of
25.60μm ± 4.38μm in diameter whereas shaking the sample for 90sec at 20Hz yielded an average
size of 23.02μm ± 3.35μm in diameter. Note that the images may look like the micro-reactors
are within one another. This is because a small sample taken from the reaction was put on a slide
and the micro-reactors are then able to stack on top of each other giving rise to images looking as
if the they are within one another. Nonetheless, the micro-reactors are within the range 20μm–
30μm in diameter.
         Although the average size of micro-reactors were within range, I further optimized the
conditions by initially starting the shaking slightly slower to allow more control over producing
an even distribution of micro-reactors. I used three samples; the first sample was subjected to
30sec at 15Hz, the second was the same with an additional 30sec at 20Hz, and the last was the
same with an additional 60sec at 20Hz. Limiting the frequency to 15Hz, helps to control the size
better, because any large micro-reactors initially formed will be broken down more slowly in a
more controlled fashion. Sample 1 produced some micro-reactors, yet the average size was
31.07μm ± 3.32μm. Samples 2 and 3 produced micro-reactors with an average size of 29.14μm
± 4.70μm and 27.22μm ± 5.31μm. These results are consistent with the results from image B &
C of Figure 1 as well, so I concluded that a time between 60sec and 90sec produces micro-
reactors within 20μm–30μm in diameter using Raindance oil.
Perrott 9
V. Stability of the Emulsion
The stability of an emulsion is an important aspect of emPCR to assure that monoclonal
beads are being produced. An emulsion is a thermodynamically unstable mixture, so attention to
the stability before and after PCR is critical. When an emulsion is formed, it tends to stay
emulsified for a limited time, but if the emulsion breaks prematurely during PCR, then
monoclonal products will not be produced. This is because the templates held within each
micro-reactor will be allowed to move freely in solution binding to different beads. Instabilities
commonly seen in emPCR are the following: flocculation, creaming, and coalescence 7.
Flocculation is the process by which the dispersed phase comes out of suspension in flakes,
creaming is when one of the liquids migrates to the top depending on the density, and
coalescence is when droplets form together into larger droplets. Any instabilities in the emulsion
will produce polyclonal beads–beads that have two or more different templates attached–which
will not produce useful results on the PGM. To ensure the stability of the emulsion during PCR,
I focused on two main aspects: the oil to aqueous ratio and the type of oil used.
To determine the stability of an emulsion, I used the same method described in section
IV to determine the size of the micro-reactors. I took pictures both before and after PCR and
determined the percent change. By comparing the size of the micro-reactors before and after the
PCR I could tell if the emulsion was stable throughout PCR. This is because in a stable emulsion
the micro-reactors would not have changed size, but in a broken emulsion typically larger micro-
reactors formed indicating the emulsion was undergoing coalescence. Another indication as to
whether or not the emulsion was stable was upon producing the emulsion by shaking the sample
on a tissuelyser, the emulsion looked like a creamy white homogenized mixture. After PCR, if I
was able to see two separate layers then the emulsion had broken and creaming had occurred as
seen in Figure 2.
Figure 2: Images taken from two separate samples post PCR. The image on the left is a stable
emulsion, because you can see the milky mixture still intact. The image on the right is another sample in
which the emulsion broke during PCR. The separate layers of the oil and water make it obvious that the
emulsion was unstable.Perrott 10
1. Oil to Aqueous Ratio
As described earlier in section V, the stability of the emulsion can be checked simply by
observing the color and phase separation or more closely by using a microscope to compare how
the micro-reactors change in size. In a standard emPCR, 600μL of oil and 150μL of aqueous
solution are needed to produce a stable emulsion. Using these standards, I first began by holding
one phase constant, in this case the oil phase at 600μL, and then began experimenting by
changing the volume of the aqueous phase to determine the best conditions to produce uniform
droplets. I theorized that because emulsions are biphasic systems, experimenting with different
ratios of aqueous phase may have an effect on the stability throughout the emulsion. I started
with three aqueous volumes of 150μL, 300μL, and 450μL. By using the shaking conditions
described in section IV, I was able to see how each reaction performed for both pre and post PCR
for both Raindance and PGM oil. Because the micro-reactors stayed intact in both color and size
I concluded that the stablility of an emulsion and the ratio of oil to aqueous are independant of
each other. As a result, future experiments used 600μL of oil and 150μL of aqueous solution.
2. Choice of Oil
There are two oils I have been experimenting with: PGM and RainDance. Between the
two I determined the best type to use, the one that yields the most stable emulsion. One factor I
experimented with was combining different ratios of oils together and allowing them to undergo
PCR to determine their overall stability. The standard protocol uses 600 μL of oil per emulsion.
I theorized that using different ratios of oils with different densities would yield a more stable
emulsion. The ratios I tested were 3:1, 1:1, and 1:3 of Raindance to PGM. Using the shaking
conditions described in section IV and taking microscope images, I determined the average size
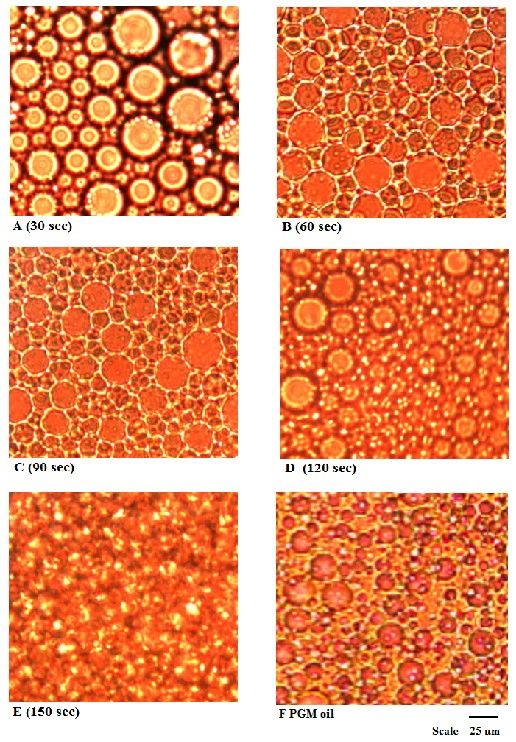
of micro-reactors produced from each ratio. Unfortunately, mixing Raindance and PGM oil
caused the oils to become very sticky so rather than forming cirular micro-reactors, more
globular forms were produced (Figure 3). This is not ideal, because rather than isolating
individual PCR components to produce monoclonal beads, the reagents are free in solution
producing polyclonal beads. Not only was mixing the oils unhelpful in stabilizing the micro-
reactors, it also made it hard to distribute the sample, as it didn't asperate well from the pipette
tip. Of the ratios tested, the PGM oil by itself worked the best produce consistent micro-reactors.Perrott 11
Figure 3: Images taken of different ratios of oils using PGM and Raindance oil. What you can see is distorted micro-
reactors forms being produced rather than circular micro-reactors. These distorted forms can inhibit emPCR by
allowing polyclonal products. Image A is a 1:1 ratio of Raindance to PGM, whereas image B is a 3:1 ratio Raindance
to PGM. The ratio 1:3 of Raindance to PGM is not shown, because the images yielded similar distorted forms.
VI. PCR Component Optimization
As in most PCR protocols, the concentrations of the components such as; buffer for
regulating pH changes from bi-products, enzyme for polymerization, MgCl2 which is required for
catalytic activity, dNTPs as the building block, primers, and template must be optimized. The
protocol describes two points that can be used to determine whether emPCR is working well
prior to sequencing. The first point is the aqueous layer which is the layer formed after breaking
the emulsion and centrifuging the sample so that the aqueous phase within the micro-reactors is
separated from the oil/butanol layer. The second point is the meltoff which is when I make the
double stranded DNA already attached to the beads single stranded and collect the strand not
fixed to the beads. A high specific meltoff band correlates well to a good sequence run, because
the meltoff in the gel is essentially showing us how templated the beads were post PCR.
I was initially given a protocol that Ion Torrent had been using for a standard emPCR.
Using these concentrations I first experimented with varying the amounts of MgCl 2. The
standard protocol uses 5mM MgCl 2. I chose to use higher concentrations of 10mM, 15mM, and
20mM. I did this because DNA polymerase requires MgCl 2 to function, so having lower
concentrations may not allow the enzyme to amplify the template well. On the contrary, it seemsPerrott 12
that the higher concentrations of MgCl2 added the less amplification there is. The gel analysis
showed that the amplification decreases as the concentration of MgCl2 increases. Because of the
high cost per emulsion, no other concentrations of MgCl 2 were tested. The standard
concentration of 5mM was determined as the best for emPCR, because higher concentrations
decreased amplification.
Moving on from the concentration of MgCl2 added, I also tested several different DNA
polymerases including AmpliTaq-Gold8, Kapa HiFi9, Kapa2G Robust10, and Titanium-Taq11. The
polymerases were all tested in conjunction with their associated buffers, because these buffers
had already been optimized for their respective enzymes. The standard amount of DNA
polymerase that the protocol used was 90units of Cesium 12 DNA polymerase. Figure 4 shows
the gel of 4 different DNA polymerase (Kapa2G Robust, KapaHiFi, Titanium-Taq, and
AmpliTaq-Gold) all used at 90units per emulsion. Out of these four DNA polymerase, Kapa2G
Robust DNA polymerase yielded the most specific meltoff. Even though some samples didn't
produce good meltoff bands, all four samples were put onto the PGM, yet all failed to produce
good results. Even the Kapa2G Robust sample which has a very specific bright band for the
meltoff produced useless results. For all the sequencing runs, the number of recovered hydrogel
Figure 4: Negative image of gel for DNA polymerase experiments. In the image, lanes 1,6,7, and 12 are 50bp ladders.
Lanes 10 & 11 are using Kapa2G DNA polymerase, lanes 8 & 9 are using KapaHiFI DNA polymerase, lanes 4 & 5 are
using AmpliTaq-Gold DNA polymerase, and lanes 2 & 3 are using Titanium DNA polymerase. Lanes 3, 5, 9, and 11
are the Aqueous layer, while lanes 2, 4, 8, and 10 are meltoff. As seen above, the most promising DNA polymerase was
Kapa2G Robust DNA polymerase (Lane 10) because it yielded the most specific meltoff band within the range I size
selected for during library preparation which was 100bp – 150bp. The sequencing results for these four emulsions were
inconclusive due to the inhibition of the DNA polymerase enzyme by the PGM oil. In all four runs, between 500,000 and
900,000 beads were successfully recovered yet of the beads recovered a maximum of 10.5% were successfully templated.
In a standard emPCR approximately 20.0% are successfully templated. By comparing the two percentages, it is clear
that these four enzymes do not improve emPCR. Percentages are determined by dividing the total number of keypass
beads as described in section III by the total number of beads present on the chip.Perrott 13
beads was between 500,000 and 900,000 beads, which is on par with the average number of
beads recovered in emPCR. This indicates that even though I managed to recovered the average
amount of beads per emulsion, the DNA polymerase tested were inadequate with the PGM oil.
The standard Cesium polymerase was used at 90units per reaction for future experiments to
produce highly templated hydrogel beads.
The primers used in my experiments were designed to be complementary to adapters
that were ligated to our library during library preparation. Standardizing the primer/adapter
sequences during library preparation is important because each 1μm hydrogel bead is coated with
the reverse primer B. This will allow for template DNA attached to adapters to hybridize to the
beads. Concentrations of both forward primer A and reverse primer B were determined to be at a
90:1 ratio (primer A to primer B). The reason for this is because primer B is already coated on
the beads, thus we only add a small amount to help initialize the PCR reaction. I did not change
the concentrations of primers due to the cost of a single reaction along with limiting reagents
supplied by Ion Torrent.
Last the concentration of DNA template must be optimized so that at least one template
is present per micro-reactor when the emulsion is formed. The standard protocol uses a final
concentration of 0.12pM of DNA template. Two dilutions of DNA template are made from a
stock sample. Because emPCR undergoes 60 cycles of amplification, a small concentration of
DNA template will assure highly templated beads. I determined the number of DNA library
molecules per bead by quantifying the DNA library using a bio-analyzer. I then multiplied the
average DNA fragment size and molecular weight to determine the number of library molecules
in grams per mole (Equation 1). Using the concentration of DNA converted to gram per
microliter, I divided by the total DNA library (g/mol) to get the DNA concentration in moles per
microliter (Equation 2). Finally using equation 3, I determine the number of DNA copies per
bead. By using the series of equations the standard PGM protocol uses 2 copies/bead.Perrott 14
With these standards, I experimented with 1 and 4 copies/bead. I predicted that due to
the variability of micro-reactors size, many beads do not become templated because they lack at
least one DNA template per micro-reactor. As stated earlier in section II, a 1mL reaction
produces 1010 micro-reactors, so by taking this number and dividing by the total number of
starting beads (50M), we get 2,000 micro-reactors/bead per emulsion. So by increasing the
number of DNA molecules per bead, the chances of having more templated beads also increases.
I chose not to go any higher than 4 copies/bead, because I did not want to risk producing
polyclonal beads, and no lower than 0.5 copies/bead due to the scarcity of DNA templates in the
emulsion. The results of the 4 copies/bead ended up producing polyclonal beads, because by
looking at the gel analysis, the meltoff was a smear, meaning that there was no specific band, so I
decided not to put the sample on the PGM. The 1 copy/bead, however increased the average
read length by 16 bases, but decreased the total reads by 36.69% (Table 1). I chose to use 1
copy/bead for future experiments, because it improved the average read length by 29.6%.
VII. Additional PCR Additives
Apart from the standard components required for a PCR reaction, some additional
components can be added to emPCR that improve the read length as well as total number of
reads on the PGM. These additional components are classified as PCR boosts. PCR boosts are
molecules that help to stabilize both the helical structure of DNA as well as the enzyme DNA
polymerase by interacting with the negative charge from the sugar-phosphate backbone.
Stabilizing the DNA strand will allow for primers to hybridize correctly allowing for high
template amplification around the hydrogel beads.
Initially I experimented with three different PCR boosts all from Biometrica Inc. For
each PCR boost, the concentrations were not given, so I tested the three boosts by starting with
0.25X, 0.5X, and 1X, while considering 1X as 15μL. All three of the PCR boosts are different
types of polymers, but the physical properties of each is proprietary. Of all the concentrations
tested, only samples using 0.25X & 0.5X Epicenter boost, 0.5X PCR boost 10, and 0.25X &
0.5X PCR boost 3 were put into the PGM. This is because by looking at the gel analysis done
post emulsion breaking, these five samples showed the highest amplification (Figure 5). Of all
the samples tested, only 0.25X Epicenter boost showed an improvement in average read length
by 3 bases, however the total number of reads decreased by 79.32% on average of all five PCR
boosts (Table 1). PCR boost 3, 10, and Epicenter were not used in later experiments.Perrott 15
Figure 5: Negative image of gel analysis for PCR boost 3, 10, and Epicenter at concentrations 1X, 0.5X, and
0.25X post emulsion breaking. The top lanes are the aqueous layer and the bottom lanes are meltoff which are both
described in section VI. Lane 11 is a 50bp ladder. Lanes 3, 4, 6, 8, and 9 showed the best amplification. Half of each
of these samples were put into the PGM machine for sequencing. The other half of each was saved for future
experiments testing with post emPCR components.
A good indication as to whether a particular PCR boost is helping is by looking at the
total number of reads, average read length, and the percent of dNTPs in the sequencing run to
determine any 'GC' or 'AT' PCR bias. To determine the percents of each nucleotide, I used a perl
script, designed by Mario Giovacchini, to count each dNTP. Table 1 summarizes the data using
different concentrations of PCR boost 3, 10, and Epicenter, while Figure 6 shows the percent of
dNTPs of each sequencing run from Table 1. Across all the runs, 'GC' rich regions were on
average 3.38% higher than 'AT' regions indicating very little if any PCR bias. I decided to
average both the 'AT' and 'GC' regions of all the sequencing runs and compare that to 'AT' and
'GC' regions of the control to see if the PCR boost are introducing bias. Because the results were
nearly identical, being within ±0.1% for both regions this indicated that the addition of the PCR
boosts did not introduce any bias.Perrott 16
Q17 Max Q17 Average
Sample Reads Total Bases
Read Length Read Length
Control (2 Copy/Bead) 131 bp 54 bp 33,231 1.79 Mbp
0.5X PCR boost 3 115 bp 50 bp 10,627 0.53 Mbp
0.25X PCR boost 3 127 bp 51 bp 2,149 0.11 Mbp
0.5X PCR boost 10 114 bp 54 bp 2,697 0.15 Mbp
0.5X Epicenter boost 119 bp 53 bp 14,016 0.74 Mbp
0.25X Epicenter boost 126 bp 57 bp 4,848 0.28 Mbp
5mM Ammonium S ulfate 120 bp 45 bp 33,441 1.50 Mbp
10mM Ammonium S ulfate 124 bp 71 bp 109,494 7.77 Mbp
100μM S permidine 121 bp 66 bp 191,800 12.66 Mbp
1 Copy/Bead 131 bp 70 bp 21,036 1.47 Mbp
Table 1: Summary of sequencing runs for PCR boosts and copy/bead experiments. These are Q17 quality score
values, meaning that each time a base is called, there is overall error rate of 3%. As seen above, PCR boosts 3,
10, and Epicenter at all concentrations didn't improve max read length, average read length, as well as total
number of reads compared to the control. The addition of 5mM Ammonium Sulfate decreased the average read
length by 9 bases and increased the total number of read by 0.63%. A concentration of 10mM Ammonium Sulfate
increased the average read length by 17 bases and the total number of reads by 229.49%. Finally the addition of
100μM Spermidine increased the average read length by 12 bases and the total reads by 477.17%.
Percent of dNTPs per Sequencing Run
30
25
20
Percent of dNTPs
% dATP
15 % dTTP
% dGTP
10 % dCTP
5
0
0.5X PCR3 0.25X PCR3 0.5 PCR10 0.5X PCR 0.25X PCR 100uM 5mM 10mM Control Average
Epicenter Epicenter Spermidine Ammonium Ammonium
Sulfate Sulfate
Sequencing Runs
Figure 6: A graph representing the composition of dNTPs per sequencing run. This data provides insight as to whether or not there
is 'AT' or 'GC' PCR bias. The results indicated that there is a 3.38% difference of 'GC' regions from 'AT' regions. In regards to the PCR
boost compared to the control run, I averaged the compositions of 'GC' regions and 'AT' regions across all the sequencing runs
excluding the control, and then compared the average to the control for both regions. This result showed that the addition of PCR boosts
didn't affect PCR bias towards 'GC' or 'AT' regions.Perrott 17
Another PCR boost I tested was ammonium sulfate. I started with concentrations of
2.5mM, 5mM, 10mM, 15mM, and 20mM ammonium sulfate. In a similar fashion as above,
using a gel analysis post emulsion breaking, I chose which samples to put on the PGM machine.
Of all the concentrations, 5mM and 10mM showed the best amplification in the gel analysis.
Table 1 shows the data of these sequencing runs. The 5mM ammonium sulfate sample actually
decreased the average read length by 9 bases but improved the total reads by 0.63%. The 10mM
ammonium sulfate sample however showed a 17 base increase in the average read length and a
229.49% increase in reads. A concentration of 10mM ammonium sulfate was used in further
experiments.
Another PCR boost that improved the average read length along with total reads was
spermidine. Spermidine works by facilitating primer hybridization. By allowing primers to
hybridize more frequently, DNA polymerase can then amplify the DNA template better. I
initially tested spermidine at very low concentrations within the micro molar range, starting with
50μM and 100μM. Looking at the gel analysis post emulsion breaking, the meltoff band for the
100μM spermidine showed a very specific band. This sample was put onto the PGM and the
results are shown in Table 1. Using 100μM spermidine, the average read length increased by 12
bases, whereas the total reads increased by 477.17%. The lower concentration of 50μM
spermidine failed to produce a very specific meltoff band on the gel analysis and was thus not
sequenced on the PGM. A final concentration of 100μM spermidine was used in future
experiments.
VIII. Post PCR Optimization
Apart from the different components used to increase the overall read length of the PGM,
if the hydrogel beads are not well recovered during emulsion breaking then no signal will be
generated during sequencing. To recover the beads, the emulsion must be broken using an
organic solvent along with a wash detergent. The standard protocol uses butanol (C 4H9OH) as
the solvent and SDS (Sodium Dodecyl Sulfate) as the wash detergent. The protocol to break an
emulsion is described in Appendix C. When breaking an emulsion, two common problems
occur: the micro-reactors will not break completely or beads will form aggregates from the DNA
entangling with other DNA fragments.Perrott 18
Initially I tested two different organic solvents (octanol and isopropanol) to see which
broke the micro-reactors better. To determine whether or not an organic solvent was working
well, I looked with the human eye to see how the color and transparency changed. When testing
these two organic solvents, I fixed the volume used to 1mL as in the standard protocol. I simply
changed the solvent and broke the emulsion following the same protocol. While testing with
octanol, the emulsion seemed to break uniformly, however it did not improve breaking the
emulsions and was thus not used in further experiments. Isopropanol on the other hand, actually
did a poor job in breaking the emulsion. I suspect that the chemical structure of isopropanol
(CH3)2CH2OH was inadequate to cause the emulsion to break. This is because molecules that
have three or less hydrocarbon chains are not similar enough to the chemical properties of the
PGM oil to cause the oil to dissolve. This explains why octanol (CH 3(CH2)7OH) worked well to
break the emulsion. In the end as described by the standard protocol, butanol was used to break
all emulsions post PCR.
Once the emulsion is successfully broken using the organic solvent, the beads must be
washed to remove residual oil to prevent the formation of bead aggregates. What happens is that
residual oil left on the beads causes the beads to clump together. This is important to prevent,
because during bead loading, if beads are clumped with each other, they will not sit nicely in the
wells of the chip. Wash detergents such as SDS or SSC (Saline-Sodium Citrate) are used to
inhibiting bead aggregates.
Improvement were based off the bead density determined by the PGM software as well as
looking at the beads after pelleting, meaning to pull down the beads using a centrifuge, and then
re-suspending with wash detergent. Upon re-suspending the beads, if micro size aggregates can
be seen with the human eye, then the beads are clumped. Cleaned beads, meaning no residual
oil, will re-suspend so that they become invisible to the human eye. The standard PGM protocol
use two washes of 0.5mL SDS. Using the standard SDS detergent, only 40% of the wells were
filled. In place of SDS, I experimented with 2X SSC and 4X SSC made from a 20X stock
solution. Using 2X SSC at the same volumes described in the standard protocol, only 32% of the
wells were filled, while using 4X SSC in fact increased the bead density to 46%. In future
experiments, 4X SSC was used in place of SDS, not only because SSC increases bead density,
but also because SDS leaves a white film layer that if not removed can cause bead aggregates.
4X SSC removes this white layer allowing for beads to re-suspend fully in solution.Perrott 19
IX. Increasing Bead Density
As important as it is to maximize the total number of templates per bead, if the beads do
not sit within the wells of the CMOS chip used in the PGM, then no signal will be generated.
One PGM sequencing chip contains 1.5 Million wells. To determine the bead density, thermal
images are taken by the PGM software. In a standard bead loading, typically 55% of the chip is
loaded with hydrogel beads per emulsion. By increasing the density of the solution containing
the beads would allow more beads to sink within the wells. I made a solution comprised 50%
glycerol and 50% PBS-Tw (Phosphate Buffer Saline-Tween). I tested using a final concentration
of 10% glycerol/PBS-Tw solution. Figure 7 shows the thermal images of the CMOS chip. By
adding the glycerol/PBS-Tw solution to the beads, 73% of the wells on the chip were loaded with
hydrogel beads. This indicates that adding glycerol/PBS-Tw to the solution increases the bead
density on the chip. A final concentration of 10% glycerol/PBS-Tw was added to samples prior
to loading onto the CMOS chip.
Figure 7: Images A and B are thermal images of the CMOS chip taken by the PGM software. As you can see by
adding 10% glycerol/PBS-Tw solution to the beads prior to loading onto the chip, there was an increase in bead
density from 55% to 73%.
X. Summary of Results
The expected results were to see an increase in the average read length as well as total
reads on the PGM. Results are based off 21 sequencing runs done on the PGM along with 83
emPCR reactions (Supplemental Figure 1). Through these experiments I have been able toPerrott 20
increase the average read length of the PGM from a 54bp to 71bp along with the total reads from
33,231 reads to 191,800 reads by determining optimal amounts of PCR reagents such as having 1
DNA copy/bead, along with using several new components including: 10mM Ammonium
Sulfate, 100μM spermidine, 10% glycerol/PBS-Tw. Not only has the addition of new PCR
reagents helped to increase both the average read length and total reads, but changing wash
detergents from SDS to 4X SSC improves bead density and reduces the formation of bead
aggregates. All of these components combined have shown to increase the average read length
along with total number of reads done by Ion Torrent's PGM helping to steadily decrease the
costs for personal genomics.
XI. Discussion
My results indicate that the addition of ammonium sulfate and spermidine along with
using SSC wash detergent and glycerol had improved the average read length along with the
throughput of Ion Torrent's PGM. The use of ammonium sulfate works in a way that helps to
stabilize both the helical structure of DNA as well as DNA polymerase itself allowing for high
amplification of template fragments around the hydrogel beads. Spermidine on the other hand
helps to facilitate primer hybridization. It can be inferred that the two PCR boosts in conjunction
with each other will yield a synergistic affect to improve the average read length. Because the
average read length is proportional to the template amplification around the beads, a net increase
in signal intensity is produced during sequencing yielding an overall increase in the average read
length.
SSC wash detergent also greatly impacted emPCR. Due to the high salt concentration of
SSC, the hydrogel beads do not form immediate aggregates during emulsion breaking. This is
important for bead recovery because bead aggregates will not pellet after centrifugation and are
then lost through several steps of washings. The last major component was glycerol. Glycerol
was helpful in loading the hydrogel beads into the well of the CMOS chip. Bead loading can be
troublesome due to the negative charge of the DNA repelling the negative surface charge on the
CMOS chip. By increasing the density of the solution the hydrogel beads are contained in, the
beads sink into the wells regardless of the repelling forces.Perrott 21
XII. Conclusion
In conclusion, I have determined a new optimized protocol for emPCR (Appendix C),
one that will yield an increase in the average read length along with through-put on the PGM.
This new protocol uses ammonium sulfate and spermidine in the PCR, along with using 4X SSC
for washing the beads, and finally the addition glycerol for bead loading on the CMOS chip.
XIII. Acknowledgments
I would like to thank Nader Pourmand for allowing me to work in his lab along with
operating the PGM and introducing the idea to me. I would like to thank Akram Tariq for
mentoring me in laboratory practices and helping me understand the idea along with Mario
Giovacchini who also helped me understand basic lab practice along with many useful
computational skills.
XIV. Appendix A: Supplemental Figures
Q17 Max Q17 Average
Experiment Reads Total Bases
Read Length Read Length
Titanium Polymerase 81 bp 34 bp 8750 0.29 Mbp
454 Oil Test N/A N/A N/A N/A
Kappa2G Robust N/A N/A N/A N/A
KappaHiFi N/A N/A N/A N/A
Kappa2G Robust N/A N/A N/A N/A
Titanium Polymerase N/A N/A N/A N/A
Control 93 bp 39 bp 46,811 1.83 Mbp
10mM (NH4)2 S O4 42 bp 26 bp 10,583 0.28 Mbp
5mM (NH4)2 S O4 99 bp 52 bp 12,766 0.66 Mbp
MgSO4 AMP mix 114 bp 43 bp 14,840 0.64 Mbp
0.25X Epicenter Boost 126 bp 57 bp 4,848 0.28 Mbp
PCR Boost Control 103 bp 47 bp 15,474 0.73 Mbp
0.5X Epicenter Boost 119 bp 53 bp 14,016 0.74 Mbp
0.5X PCR Boost 10 114 bp 54 bp 2,697 0.15 Mbp
0.25X PCR Boost 3 127 bp 51 bp 2,149 0.11 Mbp
0.5X PCR Boost 3 115 bp 50 bp 10,627 0.53 Mbp
10mM (NH4)2 S O4 124 bp 71 bp 109,494 7.77 Mbp
5mM (NH4)2 S O4 120 bp 45 bp 33,441 1.50 Mbp
Control 131 bp 54 bp 33,231 1.79 Mbp
100μM S permidine 121 bp 66 bp 191,800 12.66 Mbp
1 Copy/Bead 131 bp 70 bp 21,036 1.47 Mbp
Figure 1: Table of 21 sequencing runs. Experiments in which I report N/A means that they were
not good runs. In these runs, not enough data was produced from the PGM for the software to
interpret the results.Perrott 22
XV. Appendix B: Chemicals & Materials
PGM Oil
In this experiment I used a proprietary oil supplied by Ion Torrent.
10X PCR Buffer
Contains 500mM KCl, 200mM Tris-HCl (pH 8.4), and 15mM MgCl2.
Primer tA
Sequence (5' – CCA TCT CAT CCC TGC GTG TCT CCG ACT CAG – 3' ). Primer tA is
used at a 9μM final concentration.
Primer tB
Sequence (5' – CCT ATC CCC TGT GTG CCT TGG CAG TCT CAG – 3'). Primer tB is
used at a 0.1μM concentration because the 1μm hydrogel beads are coated with primer tB.
Hydrogel Beads (SNAPPs)
These beads are 1μm size hydrogel beads. These beads appear to be translucent when
pelleted together. The hydrogel beads are fabricated to be coated with oligos complementary
to primer tB.
DNA Library template
During library preparation, adapter A and B are ligated to fragmented DNA (100-150bp).
Ammonium Sulfate
Ammonium Sulfate is an inorganic salt that is used to help stabilize both the DNA helical
structure as well as DNA polymerase. The ammonium cation interacts with the negative
charge of the sugar-phosphate backbone on DNA to help stabilize the structure.
Spermidine
Spermidine is a polyamine molecule that facilitates primer hybridization. The amine
groups within the molecule also help to stabilize the helical structure of DNA as well as
stimulate some DNA polymerases.
CAC Polymerase
CAC Polymerase is a proprietary enzyme supplied by Ion Torrent.
TIPP
TIPP (Thermostable Inorganic Pyrophosphate) is a proprietary molecule that Ion Torrent has
added to emPCR.
TE-T (Tris-EDTA - 0.1% Triton)
A common detergent used to wash the hydrogel beads. Triton is added to buffer TE at 0.1%.
PBS-Tw (Phosphate Buffer Saline – 0.1% Tween)
A common annealing buffer used. It is a water-based salt solution containing 137mM NaCl,
2.7mM KCl, 10mM sodium phosphate, 2mM Potassium Phosphate monobasic and a pH of
7.4, Tween is added at 0.1%.
4X SSC (Saline-Sodium Citrate)
A high salt solution used to wash the hydrogel beads. It consists of 3M Sodium Chloride
and 300mM Trisodium Citrate (adjusted to pH 7.0 with HCl).Perrott 23
Butanol
Organic solvent used to break the emulsion. Butanol is a primary alcohol with a 4-carbon
structure and the molecular formula C4H10O.
Deoxyribonucleotide Triphosphates (dNTPs)
The single monomer unit of DNA. It is comprised of a nitrogenous base, a deoxyribose
sugar, and three phosphate groups.
XVI. Appendix C: Optimized Protocol
Bead Preparation:
1. Depending on the concentration of beads, take 50 million beads and put into 200μL
PCR tube.
2. Add 100μL of TE-Triton 0.1% (TE-T) and mix by pipetting up and down.
3. Spin Down for 1 minute at 13,000rpm.
4. Repeat steps 2 and 3 twice. On the third, leave 10μL.
Template Preparation:
1. Prepare 1st dilution by taking 1μL DNA template (10nM) and adding 299μL of MiliQ water to
have a final DNA concentration of 33pM.
2. Prepare a 2nd dilution by taking 1 μL DNA template (33pM) and adding 17μL of MiliQ water to
have a final DNA concentration of 1.85pM.
Oil Preparation:
1. Take PGM stock oil and sonicate for 30 minutes prior to use.
Prepare Aqueous Phase:
1. Together in 1.5mL Eppendorf tube mix the following:
Component Volume (μL) Final Concentration
10X PCR buffer 15.00 1X
25mM dNTPs 15.00 2.5mM
1mM MgCl2 0.50 3.5mM
100uM Primer A 13.50 9μM
10uM Primer B 1.50 0.1μM
SNAPPs (hydrogel beads 2M/μL) 10.00 50 Million
CAC Polymerase (5U/μL) 18.00 90 Units
nd
DNA template 2 Dilution 10.00 0.12pM
1M Ammonium Sulfate 0.75 5mM
1mM Spermidine 15.00 100μM
TIPP 0.30 N/A
Water 64.70 N/A
Total Volume 150μL
2. Take 600μL prepared PGM oil and add to a 2mL Eppendorf tube.
3. In the same tube add a 3mm steel ball provided by Ion Torrent.
4. Add the Aqueous phase to the 2mL Eppendorf tube containing the PGM oil.
5. Shake the sample using a Tissuelyser at the following conditions:
0:10seconds at 15Hz, 0:07seconds at 17Hz.
6. Distribute the emulsion in 8 PCR tubes filling about 80μL/tube of emulsion.
7. Use PCR conditions below:Perrott 24
Temperature Time Cycles
95°C 02:00 1
95°C 00:30
58°C 00:30 40
68°C 00:30
95°C 00:30
20
68°C 06:00
4°C ∞ 1
Emulsion Breaking:
1. With a 200μL pipette pool the emulsion into a 1.5mL tube. Save the tip and put aside.
2. With a new 200μL tip add 50μL of butanol to each PCR tube.
3. Using same tip as for pooling, clean out PCR tubes of residual emulsion and add to 1.5mL tube.
4. Vortex the pooled sample in the 1.5mL tube for 30seconds.
5. Spin down the sample at 13,000rpm for 5minutes.
6. Take off oil-butanol mix (top layer) but make sure not to disrupt the oil/aqueous interface.
7. Save 10μL aqueous (bottom layer) for gel analysis, leave the rest in the 1.5mL tube.
8. Add 1000μL butanol and vortex for 30seconds.
9. Spin down the sample at 13,000rpm for 3minutes.
10. Again remove the butanol without disturbing the pellet.
11. Add 500μL of 4X SSC wash buffer to 1.5mL tube and vortex for 30seconds.
12. Go back and mix thoroughly by pipetting up and down; the pellet may be hard to resuspend.
13. Sonicate the sample for 1minute.
14. Spin down the sample at 13,000rpm for 1minute.
15. Remove all but 40μL wash buffer.
16. Repeat steps 11 to 15 two times.
Meltoff Protocol:
1. Resuspend the pellet in the 1.5mL tube with 100μL of TE-Triton 0.1% (TE-T)
2. Transfer the sample in the 1.5mL tube to a new 200μL PCR tube.
3. Vortex the sample for 30seconds and spin down at 13,000rpm for 1minute.
4. Remove all but 20μL and add 80μL of TE-T.
5. Melt off the complementary DNA strand by incubating the sample at 95°C for 3 minutes.
6. Spin down sample at 13,000rpm for 1minute.
7. Remove all but 20μL and keep for gel analysis.
8. Add 80μL of TE-T and mix.
9. Repeat steps 6 to 8 once more.
Annealing Sequencing Primers:
1. Sonicate sample for 1minute.
2. Spin down at 13,000rpm for 1minute.
3. Remove all but 20μL and add 100μL PBS-T(0.2%).
4. Add 2μL of sequencing primers and mix thoroughly.
5. Anneal using thermocycler at conditions: 95.0°C for 2minutes, 37.0°C for 2minutes.
6. Spin down at 13,000rpm for 1minute.
7. Remove supernatant and add 150μL PBS-T(0.2%) and vortex.
8. Repeat steps 6 and 7 two times.
9. Remove all but 8μL.
10. Add 1μL of sequencing Polymerase and vortex lightly and incubate for 15minutes.
11. Add 2μL of PBS-T/Glycerol (1:1 ratio) Solution to the sample and mix.Perrott 25
XVII. References
1. Hall, Niel. "Advanced Sequencing Technologies and Their Wider Impact in Microbiology."
Journal of Experimental Biology 210 (2007): 1518-525.
.
2. Pourmand, Nader, Miloslav Karhanek, Henrik Persson, Chris Webb, Thomas Lee, Alexandra
Zahradníková, and Ronald Davis. "Direct Electrical Detection of DNA Synthesis." Proceedings of
the National Academy of Sciences 103.17 (2006): 6466-470.
3. Cohen, Stanley N., Annie C. Chang, Herbert W. Boyer, and Robert B. Helling. "Construction of
Biologically Functional Bacterial Plasmids In Vitro." PNAS 70.11 (1973): 3240-244. Proceedings
of the National Academy of Sciences. .
4. Saiki, R., D. Gelfand, S. Stoffel, S. Scharf, R. Higuchi, G. Horn, K. Mullis, and H. Erlich. "Primer-
directed Enzymatic Amplification of DNA with a Thermostable DNA Polymerase." Science
239.4839 (1988): 487-91.
5. Leamon, John H., Darren R. Link, Michael Egholm, and Jonathan M. Rothberg. "Overview:
Methods and Applications for Droplet Compartmentalization of Biology." Nature Methods 3.7
(2006): 541-43.
6. “Oil.: Wikipedia the Free Encyclopedia. . Jan. 20, 2011
7. Sjöblom, Johan. Emulsions and Emulsion Stability. 2nd ed. Vol. 132. Boca Raton, FL: CRC/Taylor
& Francis, 2006.
8. Moretti, Tamyra, Barbara Koons, and Bruce Budowle. "Enhancement of PCR Amplification Yield
and Specificity Using AmpliTaq Gold DNA Polymerase." BioTechniques 25 (1998): 716-22.
.
9. “KAPA HiFi DNA Polymerase.” KappaBiosystems.
http://www.kapabiosystems.com/public/pdfs/kapa-hifi-pcr-kits/
10. “KAPA 2G ROBUST DNA Polymerase.” KappaBiosystems
http://www.kapabiosystems.com/products/name/kapa2g-robust-pcr-kits
11. “TITANIIUM DNA Polymerase.” Clontech
http://www.clontech.com/products/detail.asp?tabno=2&catalog_id=639208&page=all
12. Kermekchiev, Milko B., Anatoly Tzekov, and Wayne M. Barnes. "Cold-sensitive Mutants of Taq
DNA Polymerase Provide a Hot Start for PCR." Nucleic Acids Research 31.21 (2003): 6139-147.You can also read