Interrelation of colouration and morphological traits in Northern Crested Newts (Triturus cristatus): towards a non-invasive tool for age ...
←
→
Page content transcription
If your browser does not render page correctly, please read the page content below
SALAMANDRA 56(1): 57–65
                                Interrelation of colouration and morphological traits in Triturus cristatus
                                                                                                            SALAMANDRA
15 February 2020          ISSN 0036–3375                                                                   German Journal of Herpetology

                       Interrelation of colouration and morphological traits
                           in Northern Crested Newts (Triturus cristatus):
                         towards a non-invasive tool for age determination

            Heiko Hinneberg1,2, Eva-Maria Riedel3, Katharina Foerster1 & Alexander Kupfer3,4

  1)
       Vergleichende Zoologie, Institut für Evolution und Ökologie, Universität Tübingen, Auf der Morgenstelle 28, 72076 Tübingen,
                                                                   Germany
                      2)
                         Hochschule für Forstwirtschaft Rottenburg, Schadenweilerhof, 72108 Rottenburg a.N., Germany
                3)
                   Institut für Zoologie, Fg. Zoologie 220a, Garbenstr. 30, Universität Hohenheim, 70593 Stuttgart, Germany
               4)
                  Abteilung Zoologie, Staatliches Museum für Naturkunde Stuttgart, Rosenstein 1, 70191 Stuttgart, Germany

                            Corresponding authors: Heiko Hinneberg, e-mail: hinneberg@hs-rottenburg.de;
                                     Alexander Kupfer, e-mail: alexander.kupfer@smns-bw.de

                                                    Manuscript received: 2 May 2019
                                              Accepted: 20 January 2020 by Stefan Lötters

         Abstract. Determining animals’ age is important for a wide range of study fields in biology. However, age determination
         is often problematic because it relies on invasive techniques. For the Northern Crested Newt (Triturus cristatus) various
         morphological traits are believed to be age-related. Quantifying interrelations among four morphological characteristics
         (snout–vent length, crest morphology, ventral colouration, tail base spot size), our study demonstrated that the traits are
         interrelated within and across populations. Both genetic and plastic adaptation to local environmental conditions unlikely
         explain the observed trait correlations. Furthermore, we found significant differences in snout–vent length and ventral
         colouration between adult and juvenile/subadult Crested Newts. Thus, there is strong evidence that the studied traits are
         age-related. Even though the ontogenetically mediated trait variation is masked by a non-age-related variability, the analy-
         sis of morphological traits serves as a powerful tool for obtaining insights into Crested Newts’ population demography in
         a non-invasive fashion.
         Key words. Amphibia, Caudata, population demography, monitoring, snout–vent length, crest morphology, belly pattern,
         tail base spot size.

                           Introduction                                  et al. 2010). In Crested Newt surveys evidence concerning
                                                                         population viability is usually based on presence/absence
Knowledge about animal population demography is crucial                  records or counts of eggs and larvae (e.g. English Nature
for species conservation (Lande 1988, Clutton-Brock &                    2001, BfN & BLAK 2015) but reproductive success can vary
Sheldon 2010). However, age determination could be dif-                  substantially among years (Kupfer & Kneitz 2000) and
ficult if it relies on non-invasive techniques and is thus of-           the number of larvae in a single breeding season is there-
ten restricted on dead individuals or premised on invasive               fore a weak indicator for population demography.
methods (Laws 1950, Klomp & Furness 1992, Hayes &                            For Northern Crested Newts, Triturus cristatus (Lau-
Wall 1999, Sinsch 2015). Skeletochronology is common-                    renti, 1768), a large variability has been reported in sever-
ly used for determining age in amphibians (e.g. Miaud et                 al morphological traits (Dolmen 1983, Arntzen & Teunis
al. 1993, Sinsch 2015). However, when individuals exceed                 1993, Malmgren & Thollesson 1999, Baker & Halli-
a certain age, precision of the estimates decreases dramati-             day 2000, Kupfer & von Bülow 2011, Palau Daval et
cally because lines of arrested growth (LAGs) may resorb                 al. 2018) and has been related to ontogeny in some of them
at a high rate (e.g. Eden et al. 2007, Sinsch 2015). Further-            (Arntzen & Teunis 1993, Baker & Halliday 2000, Kup-
more, testis lobes have been used for estimating the age of              fer & von Bülow 2011, Palau Daval et al. 2018). Princi-
male Crested Newts with some accuracy (Dolmen 1983).                     pally, body size continually increases throughout the life
As non-invasive methods for determining newt age are                     of urodeles (Kara 1994) and snout–vent length has been
lacking so far, the age structure of populations is widely               shown to be age-related among Crested Newts (e.g. Dol-
ignored in monitoring programmes although demography                     men 1983, Arntzen 2000, Sinsch et al. 2003). Howev-
is a major determinant of population viability (Griffiths                er, annual growth rates are low in adult newts (Arntzen
© 2020 Deutsche Gesellschaft für Herpetologie und Terrarienkunde e.V. (DGHT), Mannheim, Germany
Open access at http://www.salamandra-journal.com                                                                                        57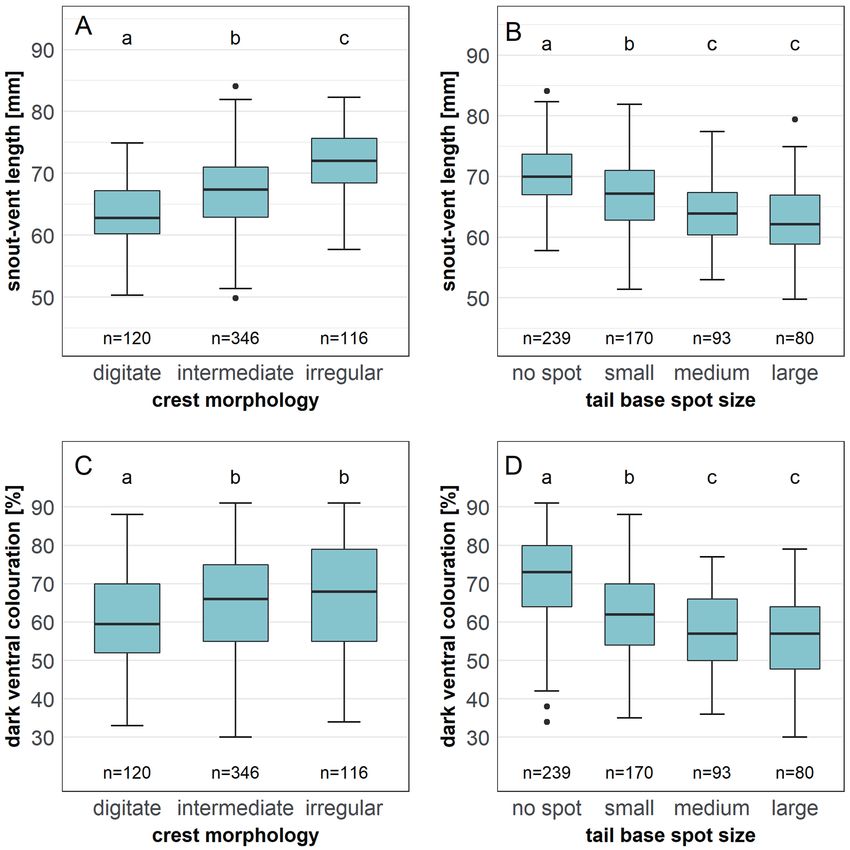
Heiko Hinneberg et al.
2000, Sinsch 2015) and can differ significantly among years the morphology of the dorsal crest (CM) was recorded vis-
and environments (Hagström 1980, Caetano & Casta- ually distinguishing three different categories of crest mor-
net 1993, Arntzen 2000). Even for newts of the same age phology, following the classification of Baker & Halliday
body sizes can differ considerably between different popu- (2000): 1 (digitate), 2 (intermediate, including dentate) and
lations (see Caetano & Castanet 1993 for T. marmoratus 3 (irregular). The belly pattern was recorded for all stages
or Meyer & Grosse 2006 for T. cristatus) and individual and sexes using digital compact cameras (Nikon Coolpix
variability in annual growth exceeds the age-related body S7000, Panasonic Lumix DMC-FX01) and a self-construct-
size variation (Sinsch et al. 2003). Thus, directly extra ed apparatus for standardized imaging (27 × 17 × 45 cm)
polating age from the body length of individuals is almost including a glass pane and a scale bar. A piece of foam
impossible. placed in top of the newts prevented specimens from verti-
Baker & Halliday (2000) drew attention to the varia- cal and horizontal movements during imaging. We meas-
tion in dorsal crest morphology for male Crested Newts of ured snout–vent length (SVL) based on the photographs
different age classes and recently Palau Daval et al. (2018) of the newts’ venters to the nearest 1.0 mm from the tip of
confirmed previous findings: a digitate crest was predomi- the snout to the posterior edge of the cloaca. For measuring
nant in the age class of first year breeders whereas an irreg- snout–vent length and to extract the belly pattern the soft-
ular crest morphology was more often observed in older ware AmphIdent was used (Matthé et al. 2008). Subse-
newts. Simultaneously, the number of crest peaks tended quently, the percentage of dark ventral colouration (DVC)
to decrease with the age of male newts but the crest area
increased relative to the body area with increasing age (Pa
lau Daval et al. 2018). Similarly, variability in the newts’
belly pattern, characterised by black spots of different size
and shape (Fig. 1), was found (e.g. Arntzen & Teunis
1993, Kupfer 1996, von Bülow 2001). Arntzen & Teunis
(1993) as well as Grosse & Günther (1996) reported an
increase in the number and size of black spots through-
out the life of Crested Newt specimens from different geo-
graphical regions. For male Northern Crested Newts, a yel-
low spot at the tail base, posterior to the cloaca, is another
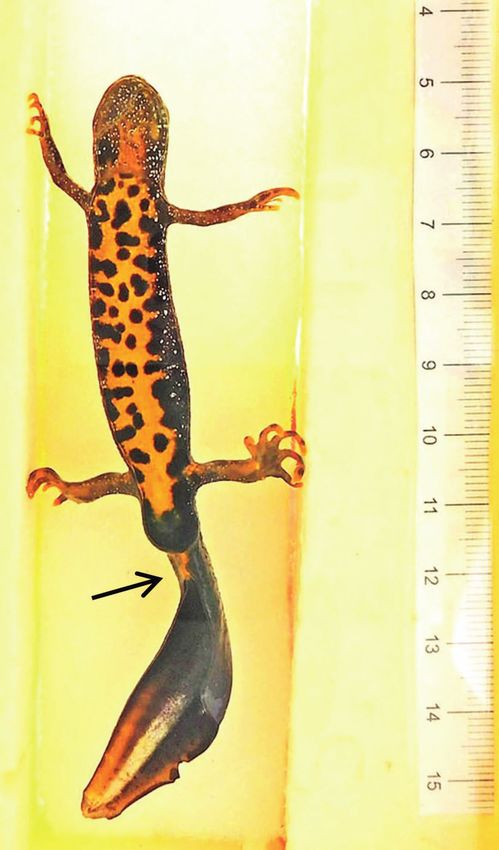
colouration feature showing strong variability (Fig. 1). The
size of the “tail base spot” apparently decreases throughout
the newts’ life (Kupfer & von Bülow 2011).
Genetic drift and both genetic and plastic adaptation to
local environmental conditions may result in trait variabil-
ity between populations and genetic diversity can promote
phenotypic diversity also within populations (Caetano &
Castanet 1993, van Buskirk 2009, Urban et al. 2014).
Nevertheless, variation in the before mentioned traits has
often been traced to ontogeny and we therefore hypothe-
sise that morphological traits are interrelated independent
of allometry. To test this hypothesis, we assess the correla-
tions of snout–vent length, crest morphology, ventral col-
ouration and the size of the tail base spot. Furthermore, we
test whether a detailed assessment of these easily accessible
morphological traits could allow insights into the popula-
tion demography of endangered Crested Newts.
Material and methods
In total, 582 adult male, 575 adult female as well as 28 juve-
nile (one hibernation, sex undetermined) and 78 subadult
(at least two hibernations, sex undetermined) individually
different Northern Crested Newts (Triturus cristatus) were
caught in the course of a population assessment at fourteen
ponds in Baden-Württemberg (south-west Germany) dur-
ing three breeding seasons from 2016 to 2018. Stages and Figure 1. Example of a male Northern Crested Newt (Triturus
sexes were distinguished based on the morphology of the cristatus) bearing a large tail base spot (indicated by the black
newts’ cloaca (e.g. Palau Daval et al. 2018). For male newts, arrow) and 59% of dark ventral colouration.
58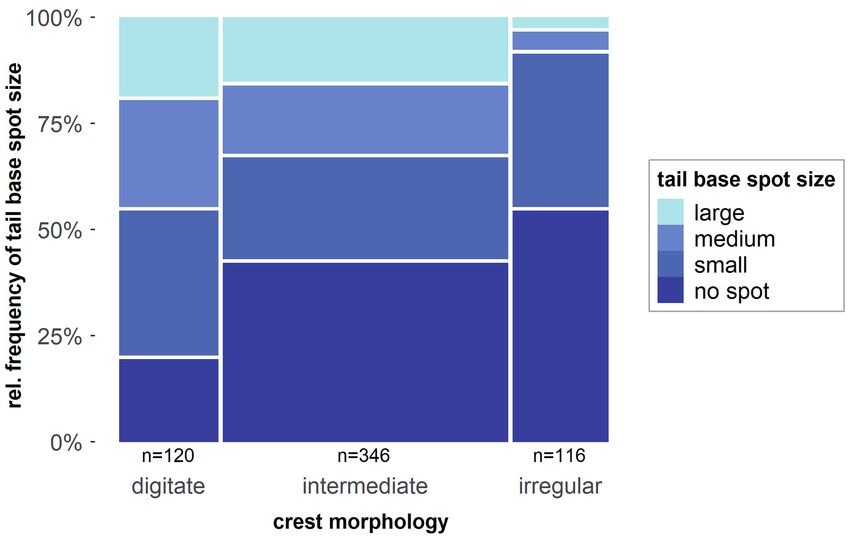
Interrelation of colouration and morphological traits in Triturus cristatus

was calculated by means of Adobe® Photoshop® CS2 and              Table 1. Snout–vent length (SVL) and proportion of dark ventral
ImageJ (Rasband, W.S. 1997–2018). According to the his-           colouration (DVC) in male Northern Crested Newts (Triturus
togram of the photographs a certain pixel value was set as a      cristatus) of different crest morphology (CM) and tail base spot
threshold to distinguish black and yellow parts of the belly      size (TBSS). Across-population estimated differences in SVL
                                                                  (mm) and DVC (proportion), t-values and Benjamini-Hochberg-
pattern. The size of the male newts’ tail base spot (TBSS)        adjusted p-values are reported. Factor levels of crest morphology
was classified visually based on the photographs of the           are: 1 (digitate), 2 (intermediate, including dentate), 3 (irregular).
newts’ venter. Four different categories were distinguished:      For the size of the tail base spot the factor levels are: A (no spot),
A (no spot), B (small), C (medium), D (large).                    B (small), C (medium), D (large).
    Statistical analyses were performed using RStudio with
R 3.5.1 (RStudio Team 2016, R Development Core Team
                                                                   response explanatory                 pairwise comparisons
2018). We used a three-step-approach for investigating the         variable variable           levels    difference   t      p-value
interrelations of different morphological traits. Using cor-
relation analyses, we studied interrelations between SVL                                        1–2        -3.77     - 6.36   < 0.001
and DVC. We performed a χ²-test to check correlations              SVL        CM                1–3        -8.48    -11.65    < 0.001
between CM and TBSS and one-way analyses of variance                                            2–3        -4.72      -7.86   < 0.001
(Anova) for investigating the interrelations between a met-                                    A–B         2.97       5.32    < 0.001
ric response and a categorical explanatory variable. Factor
                                                                                               A–C         6.03       8.88    < 0.001
levels with significant differences were identified by Tukey-
                                                                   SVL        TBSS             A–D         7.33      10.19    < 0.001
style pairwise comparisons. Benjamini-Hochberg correc-
tion was used to adjust p-values for multiple comparisons                                      B–C         3.07       4.27    < 0.001
(Benjamini & Hochberg 1995). Second, linear models                                             B–D         4.36       5.78    < 0.001
explaining snout–vent length and the percentage of dark                                        C–D         1.30       1.52      0.129
ventral colouration by population means were performed                                          1–2        -0.04     -2.71    < 0.05
and the before mentioned analyses were repeated using the          DVC        CM                1–3        -0.06     -3.25    < 0.01
residuals of the linear models as response variable. Thus,                                      2–3        -0.02     -1.27      0.204
we ensured that the observed interrelations are not simply
the result of differences between populations but also ex-                                     A–B         0.09       7.35    < 0.001
ist within populations. Third, we used linear mixed mod-                                       A–C         0.13       8.94    < 0.001
els to assess the relative strength of trait correlations and      DVC        TBSS             A–D         0.15      10.08    < 0.001
to check for additional trait-environment correlations be-                                     B–C         0.04       2.75    < 0.01
tween the four morphological characters under study and                                        B–D         0.07       4.16    < 0.001
two environmental variables: elevation and percent plant                                       C–D         0.02       1.37      0.170
cover (PC) of the newts’ breeding pond. Setting “popula-
tion” as random factor, we controlled for effects of popu-
lation membership. Model selection was based on AICc-             ance with the size of the tail base spot. The smaller the tail
values, Akaike weights (wi) and evidence ratios (Akaike           base spot, the larger snout–vent lengths were found (Ano-
1973, Wagenmakers & Farrell 2004). For the best sup-              va, F3,578 = 48.35, p-value < 0.001, Table 1, Fig. 2B). The pro-
ported models consisting only of morphological explana-           portion of dark ventral colouration differed in accordance
tory variables, we calculated marginal and conditional R²-        with crest morphology and tail base spot size. Males with
values (Nakagawa & Schielzeth 2013). R²marginal describes         irregularly shaped dorsal crests showed the highest per-
the proportion of variance which is explained by the fixed        centage of dark ventral colouration (Anova, F2,579 = 5.71, p-
effects (morphological traits), R²conditional the proportion      value < 0.01, Table 1, Fig. 2C) and the percentage of dark
that is explained by fixed plus random effects (Ruppert           ventral colouration decreased with increasing size of the
et al. 2015), i.e. by morphological traits plus the variation     tail base spot (Anova, F3,578 = 50.23, p-value < 0.001, Ta-
among populations. Finally, we tested for stage-dependen-         ble 1, Fig. 2D). Moreover, we observed a significant inter-
cy of snout–vent length and ventral colouration using lin-        relation of crest morphology and tail base spot size (χ²-test,
ear mixed models with the newts’ stage (juvenile, subadult,       χ²6 = 57.30, p-value < 0.001). Tail base spots were missing
adult) as fixed and “population” as random factor.                in 56% of male newts having an irregularly shaped dor-
                                                                  sal crest (n = 116) and in less than 7% of the newts within
                                                                  this crest shape category medium-sized or large spots were
                          Results                                 observed. By contrast, males with digitate dorsal crests
                                                                  (n = 120) had tail base spots of medium or large size in
We found clear correlations between the studied mor-              46% and none in only 20% (Fig. 3). A high proportion of
phological traits. Snout–vent length differed considera-          dark ventral colouration was related to large body sizes in
bly between male newts of all crest shape categories and          both male and female Northern Crested Newts (Correla-
was highest for individuals showing irregular crest mor-          tion analyses, r = 0.31, F1,580 = 63.41, p-value < 0.001 and
phologies (Anova, F2,579 = 68.18, p-value < 0.001, Table 1,       r = 0.37, F1,573 = 10.37, p-value < 0.001 for males and females,
Fig. 2A). Furthermore, snout–vent length varied in accord-        respectively, Fig. 4).

                                                                                                                                     59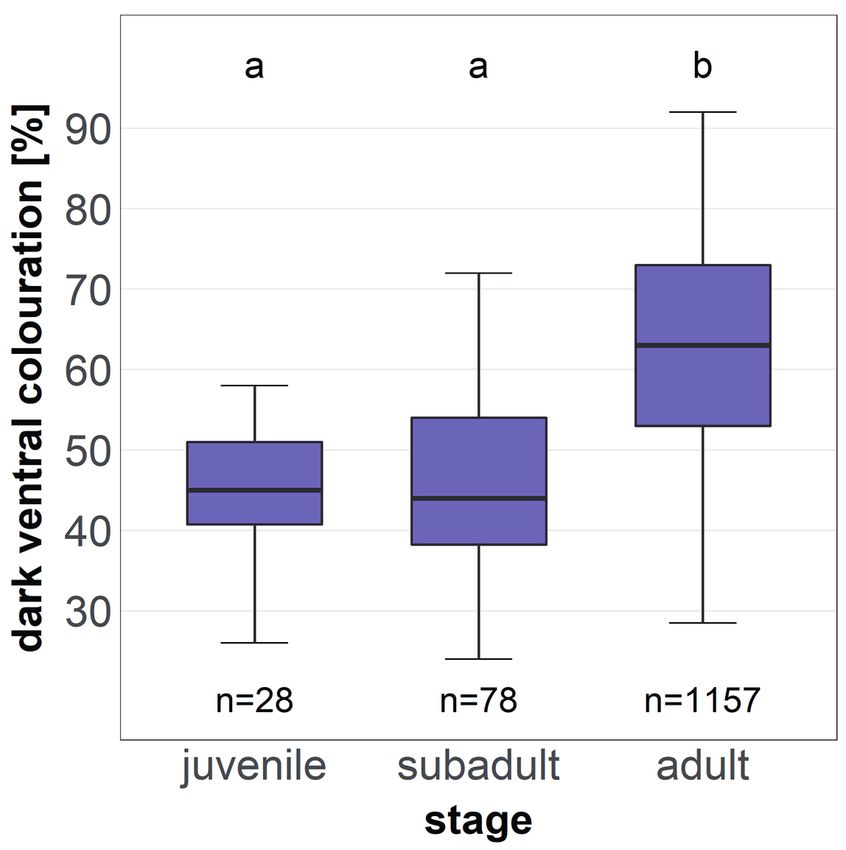
Heiko Hinneberg et al.

   Results were similar when we controlled for popula-              F1,573 = 26.63, p-value < 0.001 for male and female Crest-
tion-specific effects. We found significant within-pop-             ed Newts, respectively, Fig. 4). However, correlation co-
ulation interrelations between snout–vent length and                efficients decreased compared to the previous correlation
crest morphology (Anova, F2,579 = 65.86, p-value < 0.001)           analyses indicating that the overall trait correlation results
as well as between snout–vent length and the size of the            from both interrelations within and between populations.
tail base spot (Anova, F3,578 = 29.14, p-value < 0.001). We             Among the studied traits, linear mixed models indicat-
found the largest body sizes in male newts with irregular-          ed strongest interrelations between crest morphology and
ly shaped crests and no tail base spots (Table 2). Ventral          snout–vent length as well as between tail base spot size and
colouration was significantly related to crest morphology           ventral colouration (Table 3, Table 4). For ventral coloura-
(Anova, F2,579 = 6.18, p-value < 0.01, Table 2) and tail base       tion, the model using tail base spot size as single fixed ex-
spot size (Anova, F3,578 = 18.53, p-value < 0.001, Table 2) of      planatory variable was best supported. However, the large
male Crested Newts after controlling for variation between          difference between R²conditional = 0.52 and R²marginal = 0.08 in-
populations. The darkest belly patterns were observed in            dicated that the variability in male newts’ ventral colour-
male newts with an irregular crest morphology and with-             ation was probably larger in response to the population
out a tail base spot. Furthermore, we found a significant           membership compared to the different tail base spot sizes.
within-population correlation of snout–vent length and              Neither additional morphological nor environmental vari-
the proportion of dark ventral colouration (Correlation             ables improved model likelihood (Table 3). In contrast, all
analyses, r = 0.11, F1,580 = 6.66, p-value < 0.05 and r = 0.21,     three morphological variables (DVC, CM, TBSS) contrib-

Figure 2. Interrelations of four morphological traits in male Northern Crested Newts (Triturus cristatus). A) Median male snout–vent
length with variable crest morphologies. B) Median male snout–vent length with different tail base spot sizes. C) Proportion of dark
ventral colouration of male newts having different crest morphologies. D) Proportion of dark ventral colouration of male newts hav-
ing variable tail base spot sizes. The box indicates the median and interquartile range (IQR). Whiskers are drawn to the furthest data
point within a 1.5 × IQR from the box. Black dots indicate distant outliers of more than 1.5 × IQR and different letters denote factor
levels which differ significantly (α = 0.05) according to pairwise comparisons.

60
Interrelation of colouration and morphological traits in Triturus cristatus

uted substantial unique information to the model of male            Table 2. Snout–vent length (SVL) and proportion of dark ventral
newts’ snout–vent length (Table 4). R²conditional = 0.44 and        colouration (DVC) in male Northern Crested Newts (Triturus
R²marginal = 0.31 differ only slightly, indicating that variation   cristatus) of different crest morphology (CM) and tail base spot
in snout–vent lengths is in the first place explained by vari-      size (TBSS). Within-population estimated differences in SVL
                                                                    (mm) and DVC (proportion), t-values and Benjamini-Hochberg-
ability in the other morphological traits. Models did not           adjusted p-values are reported. Factor levels of crest morphology
improve when elevation was added as additional explana-             are: 1 (digitate), 2 (intermediate, including dentate), 3 (irregular).
tory variable (statistical information not shown here) but          For the size of the tail base spot the factor levels are: A (no spot),
models testing percent plant cover of the newts’ breeding           B (small), C (medium), D (large).
pond as additional explanatory variable were highly sup-
ported. Evidence ratios suggested that, for explaining male
                                                                     response explanatory                 pairwise comparisons
Northern Crested Newts’ snout–vent lengths, a model in-              variable variables          levels    difference   t      p-value
cluding percent plant cover of the breeding pond (model
2.5) is slightly more likely than a model containing mor-                                         1–2       -3.14      -5.85    < 0.001
phological variables only (model 2.1) and thus highlighted           SVL        CM                1–3       -7.53     -11.40    < 0.001
the potential influence of environmental factors on mor-                                          2–3       -4.38      -8.06    < 0.001
phological traits. However, model likelihood decreased                                           A–B         2.09       3.98    < 0.001
more strongly when morphological explanatory variables
                                                                                                 A–C         4.31       6.72    < 0.001
were removed. Dropping CM, TBSS or DVC from the full
model reduced model likelihood by more than factor 1021,             SVL        TBSS             A–D         5.45       8.05    < 0.001
1013 and 1.4, respectively, indicating that interrelations be-                                   B–C         2.21       3.27    < 0.01
tween the studied traits tended to be stronger than trait-en-                                    B–D         3.35       4.72    < 0.001
vironment correlations. The best supported model (model                                          C–D         1.14       1.43      0.154
2.5) suggested highest snout–vent lengths for male newts                                          1–2        0.01       0.69      0.494
that inhabit a densely vegetated pond and have no tail base          DVC        CM                1–3       -0.02      -2.33    < 0.05
spot, a dark belly pattern and an irregularly shaped dorsal                                       2–3       -0.03      -3.51   < 0 01
crest.
    Generally, our analyses revealed clear interrelations be-                                    A–B         0.02       2.67    < 0.05
tween the four studied traits both within and across popu-                                       A–C         0.05       4.92    < 0.001
lations. Whereas variability in snout–vent length was in the         DVC        TBSS             A–D         0.07       6.70    < 0.001
first place associated with variation in other morphological                                     B–C         0.03       2.58    < 0.05
traits, variation in the ventral colouration of male Crested                                     B–D         0.05       4.40    < 0.001
Newts was to a great extent associated with inter-popula-                                        C–D         0.02       1.73      0.084

Figure 3. Relative frequency of tail base spot size categories depending on male Northern Crested Newts’ (Triturus cristatus) crest
morphology (n = 582 males).

                                                                                                                                       61
Heiko Hinneberg et al.
Table 3. Linear mixed models explaining the proportion of dark ventral colouration in male Northern Crested Newts (Triturus crista-
tus). The first four models use morphological variables only to explain snout–vent length. Models 1.5 and 1.6 include plant cover
(PC) of the newts’ breeding pond.
model response explanatory explanatory AICc ΔAICc wi
variable variables (fixed) variable (random)
1.1 DVC TBSS Population -1278.01 0.00 5.78*10-1
1.2 DVC CM+SVL+TBSS Population -1251.26 26.76 8.96*10-7
1.3 DVC SVL Population -1240.15 37.87 3.46*10-9
1.4 DVC CM Population -1231.33 46.68 4.22*10-11
1.5 DVC TBSS+PC Population -1277.38 0.63 4.22*10-1
1.6 DVC PC Population -1238.36 39.65 1.42*10-9
Table 4. Linear mixed models explaining the snout–vent length of male Northern Crested Newts (Triturus cristatus). The first four
models use morphological variables only to explain snout–vent length. Models 2.5 to 2.9 include plant cover (PC) of the newts’
breeding pond.
model response explanatory explanatory AICc ΔAICc wi
variable variables (fixed) variable (random)
2.1 SVL TBSS+CM+DVC Population 3488.74 1.60 2.55*10-1
2.2 SVL CM Population 3564.25 77.09 1.03*10-17
2.3 SVL TBSS Population 3594.31 107.16 3.04*10-24
2.4 SVL DVC Population 3675.64 188.49 6.65*10-42
2.5 SVL TBSS+CM+DVC+PC Population 3487.15 0.00 5.66*10-1
2.6 SVL TBSS+CM+PC Population 3489.45 2.30 1.79*10-1
2.7 SVL CM+DVC+PC Population 3548.65 61.50 2.50*10-14
2.8 SVL TBSS+DVC+PC Population 3589.52 102.36 3.35*10-23
2.9 SVL PC Population 3693.87 206.72 7.32*10-46
tion variability. We related ventral colouration and snout– and proportions of dark ventral colouration (Linear mixed
vent length to the newts’ stage and found that snout–vent model, χ²2 = 113.66, p-value < 0.001, Fig. 5) differed be-
lengths (Linear mixed model, χ²2 = 756.97, p-value < 0.001) tween stages. Body size increased significantly from juve-
Figure 4. Correlation of snout–vent length and proportion of dark ventral colouration for Northern Crested Newts (Triturus cristatus)
A) in male (r = 0.31, p-value < 0.001) and B) in female newts (r = 0.37, p-value < 0.001). In both sexes snout–vent length and the
percentage of dark ventral colouration were positively correlated.
62Interrelation of colouration and morphological traits in Triturus cristatus
the hypothesis that the studied morphological traits are
interrelated but do also indicate that they might princi-
pally be useful for estimating the age of Crested Newts.
However, we acknowledge that our results do not indis-
putably confirm that the studied traits vary in accordance
with age within adult Crested Newts. Growth of newts
slows down after they reached maturity (Arntzen 2000)
and the darkness of the belly pattern might not increase
linearly with age.
Although Crested Newt body sizes vary geographi-
cally (Arntzen 2003) there is no consistent relationship
between body size and climatic gradients (e.g. Arntzen
2000, Krizmanic et al. 2005, Ficetola et al. 2010, this
study). Besides age and climatic conditions, genetics, food
availability, newt and predator density as well as foraging
behaviour may influence newt growth (Arntzen 2000).
Our models indicated that dense vegetation in the newts’
breeding pond may positively affect body size of Crested
Newts. Dense vegetation likely favours aquatic inverte-
brates and therefore increases food availability for larval
and mature Crested Newts (Oldham et al. 2000). Gener-
ally, snout–vent length is considered a weak indicator of
Figure 5. Percentage of dark ventral colouration in Northern amphibians’ age. Sinsch et al. (2003) drew attention to a
Crested Newts (Triturus cristatus) of different stages. The box considerable individual variation in annual growth which
indicates the median and interquartile range (IQR). Whiskers
is much stronger than the variability between different age
are drawn to the furthest data point within a 1.5 × IQR from
the box. Different letters denote factor levels which differ signifi- classes. Individuals might mature later while growing slow-
cantly (α = 0.05) according to pairwise comparisons. er and thus finally reach a larger body size than fast grow-
ing individuals – a scenario highlighted by Kuhn (1994) for
the common toad (Bufo bufo). Nevertheless, even though
nile to adult newts (Pairwise comparisons, juvenile – sub- individual snout–vent length is strongly influenced by vari-
adult: -8.86, z = -6.72, p-value < 0.001; juvenile – adult: ous factors, there is undoubtedly a general trend of increas-
-23.40, z = -20.25, p-value < 0.001; subadult – adult: -14.54, ing snout–vent length with increasing age (e.g. Arntzen
z = -20.04, p-value < 0.001) and belly patterns of adult 2000, Sinsch et al. 2003).Ontogenetic change of colour-
Crested Newts were significantly darker than that of ju- ation patterns has been observed in several salamandrids
veniles and subadults (Pairwise comparisons, juvenile – such as Salamandra corsica (Beukema 2011), Salamandra
subadult: -0.01, z = 0.30, p-value = 0.767; juvenile – adult: s. gallaica, S. s. crespoi and S. algira tingitana (Bogaerts
-0.10, z = -6.12, p-value < 0.001; subadult – adult: -0.10, 2002 cited in Beukema 2011) as well as Triturus marmora-
z = -9.16, p-value < 0.001). tus (Caetano & Castanet 1993). However, a strong en-
vironmentally mediated variation in ventral or dorsal col-
ouration pattern development was reported (Caetano &
Discussion Castanet 1993, Beukema 2011). We found considerable
variability in the ventral colouration within juvenile and
We found significant interrelations among different mor- subadult Crested Newts even though they did not differ
phological traits both in male and female Northern Crest- in age (Fig. 5). Furthermore, we found a strong effect of
ed Newts. Our results demonstrated that trait interrela- population membership on the ventral colouration of adult
tions are not simply the result of variability between popu- male Northern Crested Newts. These findings indicate that
lations but do also exist within populations. Thus, genetic the role of genetics and plasticity should not be neglected
drift as well as genetic and plastic adaptation to local en- aiming to explain variation in morphological traits. None-
vironmental conditions cannot fully account for the ob- theless, our analyses proved that the percentage of dark
served correlations. Ontogenetically mediated trait vari- ventral colouration correlates with other morphological
ation, as previously proposed by several researchers (e.g. traits and therefore suggested age-relatedness.
Arntzen & Teunis 1993, Grosse & Günther 1996, Bak- Palau Daval et al. (2018) confirmed the hypothesis of
er & Halliday 2000, Kupfer & von Bülow 2011, Palau Baker & Halliday (2000) that the morphology of North-
Daval et al. 2018), could explain the observed trait corre- ern Crested Newts’ dorsal crests varies between male newts
lations within and across populations. We found a signifi- of different age classes. Furthermore, they report a decrease
cant correlation of both snout–vent length and the dark- in the number of crest peaks with age, an increase of the
ness of the newts’ belly pattern with the stage of Northern crest area relative to the body area and an increase in size
Crested Newts. Therefore, our results do not only confirm of the reflective white spot on the side of the male newts’
63Heiko Hinneberg et al.
tails. Our results demonstrate that crest morphology varies Acknowledgements
in accordance with snout–vent length, ventral colouration
and tail base spot size. We thank the “Stiftung Artenschutz”, the “Gemeinschaft Deut-
We demonstrated that variability in each studied mor- scher Zooförderer e.V.”, the “Stiftung Landesbank Baden-
Württemberg” and the “Landesanstalt für Umwelt Baden-
phological trait can to a certain extent be explained by vari- Württemberg LUBW” for their financial support. The permits
ation in other morphological traits. As traits are interre- (55-6/8852.15-3) for studying protected Northern Crested Newts
lated within and across populations and as it appears very were kindly issued by A. Ruedel (Regierungspräsidium Tübin-
unlikely that all four morphological traits are genetically gen), P. Stocks (Regierungspräsidium Freiburg) and M. Frosch
linked on the level of individuals, we found high evidence (Regierungspräsidium Stuttgart). We thank N. and M. Kacz-
for an ontogenetically mediated variability in snout–vent marek, K. Teltscher and H. Hinneberg for their aid in carry-
length, ventral colouration, crest morphology and tail base ing out the fieldwork as well as M. Waitzmann for his generous
spot size in Northern Crested Newts. Thus, the studied logistic support. An anonymous reviewer kindly provided critical
traits are principally useful for assessing the age of North- comments on an earlier version of the manuscript.
ern Crested Newts and likely their close relatives. At least
for the Italian Crested Newt (Triturus carnifex) the inves-
tigated traits seemed to be interrelated in a similar fash- References
ion (H. Hinneberg unpubl. data). However, as indicated
for snout–vent length and ventral colouration, correla- Akaike, H. (1973): Information theory and an extension of the
maximum likelihood principle. – pp. 267–281 in: Petrov, B.
tions among morphological traits, and likely correlations
N. & F. Csaki (eds): Second International Symposium on In-
between traits and age, are to a varying extent masked by formation Theory, Akadémiai Kiadó, Budapest. – Akadémiai
non-age-related variability (for SVL see also Sinsch et al. Kiadó, Budapest.
2003). Furthermore, the age indication of different traits Arntzen, J. W. (2000): A Growth Curve for the Newt Triturus
was not always consistent on the level of a single individ- cristatus. – Herpetological Journal, 34: 227–232.
ual. As an example, a male Crested Newt showing an ir-
Arntzen, J. W. (2003): Triturus cristatus superspezies – Kam-
regular crest morphology and large body size (indicating molch-Artenkreis. – pp. 421–514 in: Thiesmeier, B. & K.
old age) but a large tail base spot and only small propor- Grossenbacher (eds): Handbuch der Reptilien und Amphi-
tion of dark ventral colouration (indicating young age) was bien Europas: Schwanzlurche (Urodela) IIB. – Aula, Wiebels-
included in our study. Using morphological traits for esti- heim.
mating the age of individual newts does therefore not ap- Arntzen, J. W. & S. F. M. Teunis (1993): A six year study on the
pear to be sensible on the basis of our current knowledge. population dynamics of the crested newt (Triturus cristatus)
However, we suggest that estimating population age struc- following the colonization of a newly created pond. – Herpe-
ture based on morphological traits is feasible if the number tological Journal, 3: 99–110.
of newts caught is sufficient, and if information on multiple Baker, J. M. R. & T. R. Halliday (2000): Variation in dorsal crest
age-related traits is combined. In our study, we sampled 113 morphology and tail height with age in great crested newts
individually different male Crested Newts from the same (Triturus cristatus). – Herpetological Journal, 10: 173–176.
population. The median snout–vent length for this popu- Benjamini, Y. & Y. Hochberg (1995): Controlling the false dis-
lation (63 mm) was significantly smaller than the median covery rate: a practical and powerful approach to multiple
snout–vent length across all studied populations (67 mm) testing. – Journal of the Royal Statistical Society, Series B
and the median percentage of dark ventral colouration was (Methodological), 57: 289–300.
50% compared to 64% across all populations. In this par- Beukema, W. (2011): Ontogenetic pattern change in amphibians:
ticular population, male newts with a digitate crest mor- the case of Salamandra corsica. – Acta Herpetologica, 6: 169–
phology were much more abundant (32%) than across all 174.
populations (21%), and males having large or medium- BfN & BLAK (2015): Bewertung des Erhaltungszustandes der Ar-
sized tail base spots occurred frequently (54% compared ten nach Anhang II und IV der Fauna-Flora-Habitat-Richt-
to 30% across all sampled populations). Thus, we conclude linie in Deutschland: Bewertungsbögen der Amphibien und
Reptilien als Grundlage für ein bundesweites FFH-Moni-
that young individuals had a high proportion in this popu- toring. 2. Überarbeitung, Stand: 08.06.2015. – Bundesamt für
lation. Ntaurschutz, Bonn.
Assessing different ontogenetically mediated traits to-
Caetano, M. H. & J. Castanet (1993): Variability and microevo-
gether has the potential to provide insight into the popula- lutionary patterns in Triturus marmoratus from Portugal: age,
tion demography of Crested Newts, even though each trait size, longevity and individual growth. – Amphibia-Reptilia,
might show considerable non-age-related variation. Future 14: 117–129.
research focusing on the interrelations of various morpho- Clutton-Brock, T. & B. C. Sheldon (2010): Individuals and
logical traits with age could contribute to support exter- populations: the role of long-term, individual-based studies of
nal morphological traits as a reliable and very powerful animals in ecology and evolutionary biology. – Trends in Ecol-
non-invasive tool. Trait analysis could be easily applied in ogy & Evolution, 25: 562–573.
monitoring programmes (e.g. von Bülow & Kupfer 2019) Dolmen, D. (1983): Growth and size of Triturus vulgaris and
when information about the demography of Crested Newt T. cristatus (Amphibia) in different parts of Norway. – Eco
populations is desired. graphy, 6: 356–371.
64Interrelation of colouration and morphological traits in Triturus cristatus
Eden, C. J., H. H. Whiteman, L. Duobinis-Gray & S. A. Wissin Matthé, M., T. Schönbrodt & G. Berger (2008): Computer-
ger (2007): Accuracy assessment of skeletochronology in the gestützte Bildanalyse von Bauchfleckenmustern des Kamm-
Arizona Tiger Salamander (Ambystoma tigrinum nebulosum). molchs (Triturus cristatus). – Zeitschrift für Feldherpetologie,
– Copeia, 2007: 471–477. 15: 79–88.
English Nature (2001): Great crested newt mitigation guidelines. Meyer, S. & W.-R. Grosse (2006): Zur Morphometrie und Al-
Version: August 2001. – English Nature, London. tersstruktur des Kammmolchs (Triturus cristatus) im Raum
Ficetola, G. F., S. Scali, M. Denoël, G. Montinaro, T. D. Vu- Halle (Saale) und Ostharz. – Hercynia N. F., 39: 269–281.
kov, M. A. L. Zuffi & E. Padoa-Schioppa (2010): Ecogeo- Miaud, C., P. Joly & J. Castanet (1993): Variation in age struc-
graphical variation of body size in the newt Triturus carnifex tures in a subdivided population of Triturus cristatus. – Cana-
comparing the hypotheses using an information-theoretic ap- dian Journal of Zoology, 71: 1874–1879.
proach. – Global Ecology and Biogeography, 62: 485–495. Nakagawa, S. & H. Schielzeth (2013): A general and simple
Griffiths, R. A., D. Sewell & R. S. McCrea (2010): Dynam- method for obtaining R² from generalized linear mixed-ef-
ics of a declining amphibian metapopulation: Survival, disper- fects models. – Methods in Ecology and Evolution, 4: 133–142.
sal and the impact of climate. – Biological Conservation, 143: Oldham, R. S., J. Keeble, M. J. S. Swan & M. Jeffcote (2000):
485–491. Evaluating the suitability of habitat for the great crested newt
Grosse, W.-R. & R. Günther (1996): Kammmolch – Triturus cri- (Triturus cristatus). – Herpetological Journal, 10: 143–155.
status (Laurenti, 1768). – pp. 120–141 in: Günther, R. (ed.): Palau Daval, N., V. Gardette & P. Joly (2018): Age, courtship
Die Amphibien und Reptilien Deutschlands. – Gustav Fischer, and senescence: sexual ornaments are larger in older great
Jena. crested newts. – Journal of Zoology, 306: 156–162.
Hagström, T. (1980): Growth of newts (Triturus cristatus and R Development Core Team (2018): R: A language and environ-
Triturus vulgaris) at various ages. – Salamandra, 16: 248–251. ment for statistical computing. R Foundation for Statistical
Hayes, E. J. & R. Wall (1999): Age-grading adult insects: a review Computing. – R Development Core Team, Vienna.
of techniques. – Physiological Entomology, 24: 1–10. Rasband, W. S. (1997–2018): ImageJ. – U. S. National Institutes of
Kara, T. C. (1994): Ageing in amphibians. – Gerontology, 40: Health, Bethesda, Maryland, USA.
161–173. RStudio Team (2016): RStudio: Integrated Development for R. –
Klomp, N. I. & R. W. Furness (1992): A technique which may al- RStudio, Boston.
low accurate determination of the age of adult birds. – Ibis, Ruppert, J. C., K. Harmoney, Z. Henkin, H. A. Snyman, M.
134: 245–249. Sternberg, W. Willms & A. Linstädter (2015): Quantifying
Krizmanic, I., T. D. Vukov & M. L. Kalezic (2005): Bergmann’s drylands’ drought resistance and recovery: the importance of
rule is size related in European newts (Triturus). – Herpeto- drought intensity, dominant life history and grazing regime. –
logical Journal, 15: 205–206. Global Change Biology, 21: 1258–1270.
Kuhn, J. (1994): Lebensgeschichte und Demographie von Erd- Sinsch, U. (2015): Review: Skeletochronological assessment of
krötenweibchen Bufo bufo bufo (L.). – Zeitschrift für Feldher- demographic life-history traits in amphibians. – Herpetologi-
petologie, 1: 3–87. cal Journal, 25: 5–13.
Kupfer, A. (1996): Untersuchungen zur Populationsökologie, Sinsch, U., V. Lang & R. Wiemer (2003): Dynamik einer Kamm-
Phänologie und Ausbreitung des Kammolches Triturus cri- molch-Metapopulation (Triturus cristatus) auf militärischem
status (Laurenti 1768) in einem Agrarraum des Drachenfelser Übungsgelände (Schmittenhöhe, Koblenz): 3. Altersstruktur.
Ländchens bei Bonn. – Diplomarbeit, Rheinische Friedrich- – Zeitschrift für Feldherpetologie, 10: 229–244.
Wilhelms-Universität Bonn. Urban, M. C., J. L. Richardson & N. A. Freidenfelds (2014):
Kupfer, A. & S. Kneitz (2000): Population ecology of the great Plasticity and genetic adaptation mediate amphibian and rep-
crested newt (Triturus cristatus) in an agricultural landscape: tile responses to climate change. – Evolutionary Applications,
dynamics, pond fidelity and dispersal. – Herpetological Jour- 7: 88–103.
nal, 10: 165–172. van Buskirk, J. (2009): Natural variation in morphology of lar-
Kupfer, A. & B. von Bülow (2011) Nördlicher Kammmolch. – val amphibians: Phenotypic plasticity in nature? – Ecological
pp. 376–406 in: Arbeitskreis Amphibien Reptilien NRW (ed.): Monographs, 79: 681–705.
Handbuch der Amphibien und Reptilien Nordrhein-Westfa- von Bülow, B. (2001): Kammolch-Bestandserfassungen mit
lens. – Laurenti, Bielefeld. dreijährigen Reusenfängen an zwei Kleingewässern Westfa-
Lande, R. (1988): Genetics and demography in biological conser- lens und fotografischer Wiedererkennung der Individuen. –
vation. – Science, 241: 1455–1460. RANA, 4: 145–162.
Laws, R. M. (1950): A new method of age determination in mam- von Bülow, B. & A. Kupfer (2019): Monitoring population dy-
mals with special reference to the elephant seal (Mirounga le- namics and survival of Northern Crested Newts (Triturus
onina, Linn.). – pp. 1–11 in: Falkland Islands Dependencies cristatus) for 19 years at a pond in Central Europe. – Salaman-
Survey, Scientific Reports No. 2. – Falkland Islands Depend- dra, 55: 97–102.
encies Scientific Bureau, London. Wagenmakers, E.-J. & S. Farrell (2004): AIC model selection
Malmgren, J. C. & M. Thollesson (1999): Sexual size and shape using Akaike weights. – Psychonomic Bulletin & Review, 11:
dimorphism in two species of newts, Triturus cristatus and 192–196.
T. vulgaris (Caudata: Salamandridae). – Journal of Zoology,
249: 127–136.
65You can also read