Bristol Key Facts 2021 - www.bristol.gov.uk - Bristol City Council
←
→
Page content transcription
If your browser does not render page correctly, please read the page content below
Bristol
  Key Facts 2021
  March 2021 Update

Insight, Performance and Intelligence Service
www.bristol.gov.uk
Context               1

The global pandemic has had
profound consequences for                  “Staying safe, economy and local
everyone living and working
in Bristol, but the full impact
                                           business, and mental health”
of COVID-19 is yet to be                   The three most important issues for Bristol residents as the
known. The Economic Recovery               city recovers from COVID-19 (Quality of Life Survey 2020)
Strategy, the Climate Strategy
                                          of decreasing numbers of births        to all. It has some of the most
and the Ecological Strategy will
                                          and increasing out-migration.          environmentally conscious
be instrumental in supporting
                                          Continuing trends of falling birth     residents in the UK and has a
the COVID-19 recovery in the
                                          rates and international migration,     growing reputation for sustainable
city as future plans change
                                          together with the impacts of           and plant-based food.
focus.
                                          COVID-19 and Brexit, are likely to
                                                                                 The city has a bold vision to build
In spite of this new challenge,           have significant impacts on future
                                                                                 partnerships to take on challenges
the community has come                    population change both in Bristol
                                                                                 such as poverty and hunger, public
together to support one                   and nationally.
                                                                                 health and wellbeing, education,
another like never before,
                                          Bristol is a thriving and innovative   equality, clean air and water, clean
with WeAreBristol providing
                                          global city and home to a wealth       energy, decent jobs, innovation,
links on how to join our
                                          of cultures and creative ideas.        sustainable inclusive growth,
volunteer response to the
                                          As a city of contrasts, where          climate, wildlife and habitats,
pandemic as well as how to
                                          some of the most deprived areas        justice, partnerships learning and
receive help.
                                          border the most affluent, the city     skills to ensure everyone can share
Bristol is the largest city in the        continues to wrestle with issues       in its successes.
South West and one of the                 such as congestion, environmental
                                                                                 The One City Plan sets out the city’s
11 ‘Core Cities’ in the United            pollution, and increasingly
                                                                                 commitment to work together
Kingdom. Following high rates             unaffordable house prices.
                                                                                 across different sectors as the
of population growth over the
                                          At least 91 different languages are    council’s role evolves from primarily
last decade and a half, the latest
                                          spoken by Bristol residents, and       providing services to empowering
data for Bristol shows no overall
                                          the city continues to build on its     others to collaborate to get things
population growth for the year
                                          strengths as a place welcoming         done. Everyone involved shares an
2018-19. This was mainly a result
                                                                                 aim to make Bristol a fair, healthy
 The Key Facts report is largely based on annual data published                  and sustainable city. A city of hope
 throughout the year. Whilst some data is available to start to                  and aspiration, where everyone can
 measure the impact of COVID-19 on the city it is still too early                share in its success.
 to understand the full effect.

 State2of Bristol: Key facts 2017-18 (Feb 2018)
 page                                                                             Bristol Key facts 2021 (Marchpage
                                                                                                                2021)2
Population                   2

For more information see: The population of Bristol
Bristol is the 10th largest city in the United Kingdom and one of
the 11 ‘Core Cities’3, with an estimated population4 of 463,400.
Bristol’s mid-2019 population is          ● Bristol’s 60,300 older people
estimated to be 463,400. The overall        make up just 13% of the total
                                            population (England & Wales
population number is broadly
                                            18.5%).
unchanged in the 12 months
between 2018 and 2019. Mid-
                                          Uncertain population
2019 represents a break in a recent
pattern of historically high annual
                                          trends
population change. Nationally             ● Future population trends are
the population increased by just            notoriously hard to project and
                                            COVID-19 will make official
0.5% between 2018 and 2019 - the
                                            statistics hard to collect and
slowest rate for 15 years.                  interpret for some time.
The main factors effecting Bristol’s      ● After decades of rapidly-rising
population change include the               population nationally, there is
lowest number of births for 13              mounting evidence that all three
years, alongside a large fall in net        drivers of population growth
                                            – births, deaths and migration
international migration. The effect                                                 least 91 main languages spoken.
                                            - may be shifting. Brexit and
of Brexit can be clearly seen with          COVID-19 could accelerate             ● The proportion of the population
a decline in the number of EU               these changes. Britain might            who are not ‘White British’
nationals registering for a National        be looking at a period of much          increased from 12% (2001) to
Insurance Number (NINo) in                  lower, possibly even negative,          22% (2011). with 6% White
Bristol since the EU Referendum in          population growth.                      Minority Ethnic, 6% Black, 6%
June 2016.                                ● Current projections show that the       Asian, 4% Mixed and 1% Other
                                            population of Bristol is projected      (all rounded to nearest 1%).
The Census 2021 is taking place in
                                            to increase by 69,300 people over     ● More recent data on school
March and will enable us to have            the 25-year period (2018-43) to         pupils shows that the % of pupils
more updated information on our             532,700 by 2043. This is a 15%          who are not ‘White British’ has
local population profile when data          increase and is higher than the         increased from 31% in 2011 to
becomes available.                          10% increase for England. These         38% in 20206.
                                            projections however are based
                                            on a continuation of trends in
Age profile                                 the period up to 2018. The next
                                                                                  Deprivation
● Bristol has a relatively young            set of official projections will      ● Deprivation is explained at
  age profile with more children            be 2021-based and so will take          Deprivation Bristol has 41 areas
  aged 0-15 than people aged                into account the effects of both        in the most deprived 10% in
  65 and over. The median age of            COVID-19 and Brexit and may             England, including 3 in the most
  people living in Bristol is 32.4          produce much lower numbers.             deprived 1%. The greatest levels
  years compared to 40.2 years in                                                   of deprivation are in Hartcliffe
  England and Wales.                      Diversity5                                & Withywood, Filwood and
                                                                                    Lawrence Hill.
● Bristol’s 85,900 children make up
                                          ● The population of Bristol has
  18.5% of the total population.            become increasingly diverse and       ● In Bristol 15% of residents -
                                            some local communities have             70,700 people - live in the 10%
● The growth in the number of
                                            changed significantly. There are        most deprived areas in England,
  primary school age children in
                                            now at least 45 religions, at least     including 19,000 children and
  Bristol in the last decade is one of
  the highest in the country.               187 countries of birth and at           7,800 older people.

 State3of Bristol: Key facts 2017-18 (Feb 2018)
 page                                                                              Bristol Key facts 2021 (Marchpage
                                                                                                                 2021)3
Communities & living                                      7

Bristol is a City of Sanctuary. A Refugees and Asylum Seekers Inclusion
Strategy was Council approved in 20208.
● A snapshot of Bristol Social              as a place to live, but only 49%
  Services taken at 31st March              of people in the most deprived
  20209 shows that 629 children             areas (QoL 202016. poverty in
  were in care and 292 children had         Bristol (2017).
  a child protection plan10
                                          ● 71% of Bristol residents feel
● As at July 2020, 28% of Bristol           that “people from different
  pupils (16,600 children) are              backgrounds get on well
  Disadvantaged11.                          together” in their local area
                                            (QoL 2020)16.
● 14,600 children under 16 live
  in low-income families12 in             ● 47% of residents volunteer or
  Bristol, a rate of 17%, just below        help out in their community
  the national average of 18%               at least 3 times a year (40%
  (2018/19).                                in the most deprived areas)
                                            (QoL 2020)16.
● 15% of 16-17 year olds (2018/19)
  were “not in education,                 ● Since April 2020 there have been
  employment or training”(NEET)13,          914 fully activated volunteers as
  worse than national average               part of the CanDoBristol / Covid
  (5.5%).                                   19 response. They have been
                                            allocated 4,951 actions helping
● 19,600 households were
                                            2,847 residents with tasks such
  estimated to experience fuel
                                            as shopping and telephone
  poverty in Bristol in 2018 (9.8%
                                            befriending19.
  of Bristol households, below the
  national average 10.3%)14.
● 4% of households have
                                          Crime and Safety20
  experienced moderate to severe          Total recorded crime in Bristol in
  “food insecurity15” In the last 12      2019/20 was similar to 2018/19 but
  months, rising to 13% in the 10%        lower than the two previous years.
  most deprived areas (QoL 2020)16.
                                          ● New data shows that 52,601
● Just over 96% of inspected food           crimes were recorded in 2019/20,
  premises have a hygiene rating            similar to 2018/19 (52,392)21.
  of 3 and above and are broadly
  compliant with food hygiene             ● The crime rate is 113.5 per 1,000
  regulations17.                            population (2019/20)22.
● 146 food outlets were awarded           ● Rates of people whose day to day
  a ‘Bristol Eating Better Award’ in        life is affected by fear of crime
  2019/20 helping Bristol become            is 16%, increasing to 33% in the
  a healthier and more sustainable          most deprived areas of the city
  food city18.                              (QoL 2020)16.
                                          ● Recorded hate crime in 2019/20
Community cohesion                          (1,902 crimes) was similar to
● 63% of residents “feel they belong        the previous three years but
  to their neighbourhood” but               has increased by 177% since
  only 39% of people in the most            2012/1323
  deprived areas (QoL 2020)16.            ● 7% of people said they were a
● 80% of Bristol residents are              victim of racial discrimination in
  satisfied with their local area           the last year, rising to 18% in the
                                            most deprived areas (QoL 2020)16

 State4of Bristol: Key facts 2017-18 (Feb 2018)
 page                                                                             Bristol Key facts 2021 (Marchpage
                                                                                                                2021)4
Health & Wellbeing                                  23

The health and wellbeing of Bristol residents has been
adversely impacted by COVID-19. It is not yet clear what
is the full extent of the impact and the effect it has had on
health inequalities across the city. Work in the future will be
undertaken to investigate these impacts.
● Over the entire course of 2020,        ● 54.8% adults in Bristol are
  the cumulative case rate (up              overweight or obese, better than
  to end Dec) of COVID-19 per               the national average (62.3%)33.
  100,000 people in Bristol was
                                         ● 23.0% of 4-5yr olds have excess
  4,219, slightly higher than the
                                            weight, rising to 33.9% for 10-
  England rate of 4,07425, due to
                                            11yr olds 2019/2034.
  higher rates in Oct and Nov.
                                         ● 73.5% of Bristol adults are
● The mortality rate for COVID-19
                                            physically active35, significantly
  was 81.4 per 100,000 people,
                                            higher than the national average
  significantly lower than the
                                            (67.2%) and highest of all English
  England average of 134.6 (1 Mar
                                            core cities.
  20 – 1 Jan 21)26.
                                         ● The smoking rate is 18.0% (2019)
● Life expectancy27 for women is
                                            now significantly higher than the
  82.8 years and for men 78.5 years
                                            national average (13.9%). 9.6% of
  (2017-2019) both are lower than
                                            women smoke during pregnancy
  the national average.
                                            (2019/20), below the national
● The inequalities gap in life              average36.
  expectancy28 between the most
                                         ● The rate of alcohol-related
  and least deprived areas in Bristol
                                            hospital admissions in 2018/19
  is 9.8 years for men and 7.7 years
                                            was 856 per 100,000 people37,
  for women.
                                            significantly higher than the
● Bristol’s healthy life expectancy29       England average of 664.
  (years living in good health) is
                                         ● Teenage pregnancy rates have
  61.1 years for women and 60.8
                                            continued to reduce to 11.1 per
  years for men (significantly worse
                                            1,000, significantly lower than
  than the national average of 63.9
                                            the national rate of 16.7 (2018)38.
  and 63.4 years respectively).
                                         ● Over 3,315 patients are on GP
● Cancer remains the biggest
                                            Dementia registers in Bristol39
  killer in the under 75 age group30
                                            (2018/19).
  (1,337 early deaths in Bristol in
  last 3 yrs, 2017-19).                  ● The suicide rate in Bristol was
                                            11.4 per 100,000 persons (2017-
● 55,500 Bristol GP patients (12.6%)
                                            19), above the national average
  have a diagnosis of depression31,
                                            of 10.1. Rates are higher in men
  above the England average
                                            (18.3) than women (4.7)40.
  (11.6%).
                                         ● 71% of Bristol residents are
● Rates of young people admitted
                                            satisfied with life (QoL 2020), but
  to hospital due to self-harm (680
                                            only 52% of people in the most
  per 100,000) continue to increase
                                            deprived areas16.
  and are still significantly worse
  than the England average (444
  per 100,000)32.

 State5of Bristol: Key facts 2017-18 (Feb 2018)
 page                                                                             Bristol Key facts 2021 (Marchpage
                                                                                                                2021)5
Education & skills                               41

Bristol has a skilled workforce with a high proportion
of graduates and students living in the city. Due to the
pandemic, attainment data for 2020 is not available for Bristol
or nationally.
● Of the 152 schools in Bristol           ● There were 2,860 apprenticeships
                         42                 started in Bristol in 2018/19 and
  inspected by OFSTED 78.9% are
  rated as Good or Better for overall       1,170 were completed52.
  effectiveness.                          ● 51% of Bristol working age
                43
● In Early Years , 70.6% of children        residents are qualified to degree
  under 5 have a Good Level of              level or above compared to the
  Development at Foundation                 GB average of 40%53. Bristol
  Stage (2019), slightly below the          residents are more highly
  England average of 71.8%.                 qualified than all other Core
                                            Cities.
● For Key Stage 2 pupils (at 11 years
  of age) 2019 data44 shows 65%           ● In 2019/20 there were 58,100
  achieved the expected standard            students registered at the two
  in Reading, Writing and Maths             Bristol universities - 27,400 at
  combined, the same as the                 University of Bristol (UoB) and
  national average.                         30,700 at University of the West
                                            of England (UWE)54. Over the
● For Key Stage 4 (at age 16),
                                            last 5 years university student
  2019 data45shows the average              numbers have increased by 20%
  Attainment 8 score46 per pupil            (+9,800).
  is 44.7 points, down from 45.5
  points in 2018. For disadvantaged       ● Overseas students make up a
  pupils47, Bristol Attainment 8 is         quarter of all students studying
  only 33.6.                                at the University of Bristol (5%
                                            EU, 21% non-EU) and 15% of all
● Bristol’s Progress 848 score is           students at UWE (4% EU, 12%
  -0.05, marginally worse than the          non-EU).
  national benchmark (0.03 by
                                          ● Significantly fewer young
  definition). For Disadvantaged
  pupils the Progress 8 score               people in Bristol go on to Higher
  is -0.48.                                 Education55 (28.7%, compared to
                                            40.3% nationally). In South Bristol
● 38.6% of Bristol pupils49 achieved        this is 20.7%, less than half the
  a “strong pass” in both English           English rate, plus 3 of the 4 worst
  and Maths GCSE, below the                 performing neighbourhoods56 are
  national average (43.4%).                 here in Hartcliffe, Withywood &
● Post 16 data50 indicates                  Highridge.
  that pupils are consistently
  maintaining a Grade C at A-level
  (average points score of 32.69 in
  2019, from 31.57 in 2018).
● In 2019/20 (academic), 16.1%
  of Bristol pupils received Special
  Educational Need (SEN) support
  or have an Education Health &
  Care Plan (EHCP), higher than
  15.7% nationally51.

 State6of Bristol: Key facts 2017-18 (Feb 2018)
 page                                                                             Bristol Key facts 2021 (Marchpage
                                                                                                                2021)6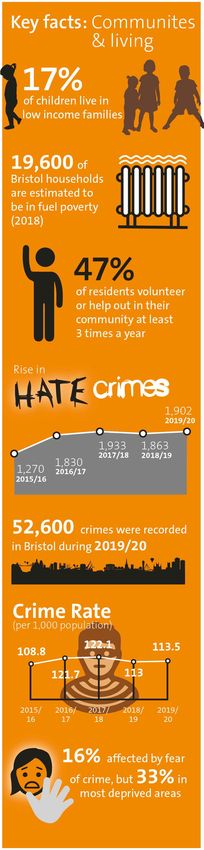
Housing               57

                                          ● As a snapshot, 35 people were
Building homes                              found sleeping rough on the
There are 203,490 homes in                  street in a single night in Bristol
Bristol58. Since 2006, 24,669               (June 2020), similar to 2014/15
new homes have been built                   levels62.
in the city, an average of                ● As at 31 Dec 2020, 543
some 1,762 a year59. Bristol                people housed in emergency
                                            COVID-19 accommodation have
City Council (BCC) has been
                                            subsequently been resettled60.
working towards ensuring
that 2,000 homes are built in             ● As at 31st March 2020 there
                                            were 728 households living in
Bristol each year, with 800 of
                                            temporary accommodation, a
those being affordable60.                   significant increase on 2019 as a
● 1,350 new homes were built in             result of coronavirus59.
  Bristol during 2019/2057.               ● During 2019/20, 499 empty
● 3,296 student units were                  private sector dwellings were
  completed between 2006 and                returned into occupation63.
  202057.
● A total of 3,557 affordable             Housing Market
  dwellings (net) have been               ● Bristol Household tenure: 53%
  completed since 200657.                   Owner occupied, 29% Private
● 84.3% of all dwellings completed          Rented, 18% Social Rented64.
  in 2019/20 were on previously           ● Average house prices: Bristol:
  developed land57.                         £309,800 England & Wales:
● As at 15th April 2020, Bristol            £261,900 (Nov 2020)65.
  City Council had 26,885 Council
                                          ● Average house prices in Bristol
  Homes under its control61.                have increased by £133,900 over
● As at 1st April 2020, there were          the last ten years, an increase
  12,750 planning permissions for           of 76%. This compares with an
  new dwellings57.                          increase of 51% for England and
                                            Wales over the same period64.
Homelessness                              ● Earnings in Bristol are similar to
                                            the national average but house
Due to the pandemic, the
                                            prices in Bristol are significantly
majority of rough sleepers in               higher, resulting in affordability
Bristol were placed in hotels               issues.
/ units as part of the national           ● This is higher than the England
‘Everyone In’ scheme and                    average of 7.83, and the highest
given access to appropriate                 of all of the English Core Cities
support services. Many have                 (who all have ratios lower than
moved on to longer term                     the national average)66.
accommodation and the
figures for rough sleeping
in the city have dramatically
decreased.

 State7of Bristol: Key facts 2017-18 (Feb 2018)
 page                                                                             Bristol Key facts 2021 (Marchpage
                                                                                                                2021)7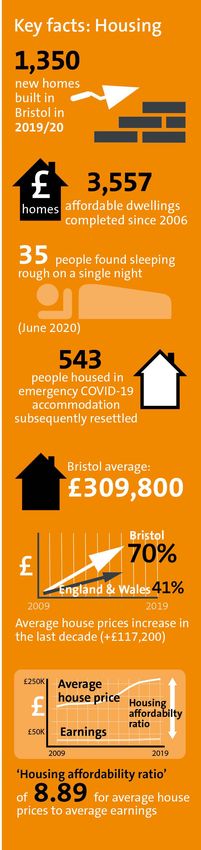
Transport                 67

The COVID-19 pandemic has enabled the city to reconsider how
it uses road space. The council has accelerated existing plans
to close the centre of Bristol to through traffic enabling more
reliable bus journeys and also safer and more attractive walking
and cycling routes.
In 2019 Bristol City Council adopted the Bristol Transport
Strategy68 that sets out our vision and ambition for transport
in the city up to 2036. This is supported by our One City Plan and
the Joint Local Transport Plan for the West of England region.
● Bristol has very high levels of
  walking and cycling compared
                                          Traffic
  to most other UK cities. In 2011        ● The average speed on local A
  more people in Bristol commuted           roads in Bristol was 15.9 mph in
  to work by bicycle or on foot             2019 slightly higher than 2018
  than in any other Local Authority         (15.3 mph)73.
  in England and Wales, at                ● 70% of Bristolians feel that traffic
  57,000 (27% of the working age            congestion is a problem in their
  population)69.                            area (56% in the most deprived
● 11.3% of people cycled to work            areas) (QoL 2020)16.
  daily in 2020, a similar level to       ● 78 people were killed or seriously
  2019 (NHT 2020)70.                        injured in road traffic incidents
● Over a quarter (28%) of                   in Bristol during 2019/20, a 29%
  Bristolians ride a bike at least          decrease compared to 2018/19
  weekly, the same as reported last         but similar to 2017/1874.
  year (21% in the most deprived          ● Children in the most deprived
  areas)(QoL 2020)16.                       areas are six times more likely
● 86% of bus users in 2019 were             to be injured in motor traffic
  satisfied with bus services in the        collisions than those in the least
  West of England area and 57% of           deprived areas75.
  all Bristol residents stated they       ● 50% of residents are satisfied
  are satisfied with the local bus          with the management of
  service, a significant year on year       roadworks in Bristol, equal to the
  rise for the last few years (QoL          national average (NHT 2020)69.
  2020)16.
● The number of bus passenger
  journeys (per head of population)
  in Bristol in 2019/20 was 87,
  a significant increase of 28%
  compared to 2013/14 (68.2). This
  compares to a national decrease
  in journeys of 16% over the same
  six year period72.

 State8of Bristol: Key facts 2017-18 (Feb 2018)
 page                                                                              Bristol Key facts 2021 (Marchpage
                                                                                                                 2021)8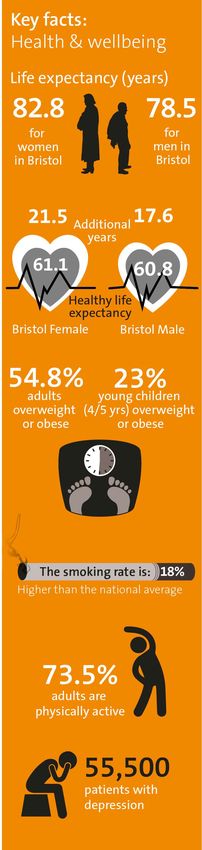
Sustainability &
 environment                        76

Bristol is committed to being             bring air pollution within legal
a carbon neutral city by 2030             limits as soon as possible.
and was named as the UK’s                 ● Despite increased numbers of
greenest city in 201977 .                   people using public transport,
                                            walking, and cycling, continued
Energy                                      levels of vehicle use (pre
                                            COVID-19) mean that reported
The council owns wind                       air pollution levels of nitrogen
turbine installations that                  dioxide still exceed the UK and
produce enough energy                       EU air quality limits82.
to power more than 6,200                  ● In 2016 it was estimated that
average UK homes78.                         approx. 300 deaths each year
● The council has reduced the
                                            in Bristol can be attributed to
  carbon emissions it measures              air pollution83. This is 8.5% of all
  from its direct (scope 1 and 2)           deaths.
  operations by 86% since 2005/06
  and plans to become a net zero          Waste
  carbon emitter by 202579. The
                                          The Clean Streets strategy84
  council is working to put together
  a City Leap Partnership that plans      continues to make Bristol
  to make the city carbon neutral         measurably cleaner.
  for all three scopes by 2030.           ● 46.8% of all household waste
● The total installed renewable             was sent for reuse, recycling and
  electricity capacity in Bristol at        composting in 2019/20, up from
  the end of 2019 was 9.5MW                 37.4% in 2009/1085.
  over 4,325 installations, an            ● 15.9% of municipal waste was
  increase of 3.45% on 2018. Actual         sent to landfill (2019/20). 129kg
  generation in 2019 was 194,950            of waste per household was
  Mwh, an increase of 2.95% in              landfilled in 2019/20, compared
  2018. Onshore wind made up                with 230kg in 2016/1783.
  42.9% of installed capacity, solar
  photovoltaic panels 30.7% and           ● 82% of residents think street
  waste 16.6%77.                            litter is a problem in their
                                            area, rising to 93% in the most
● In 2019 the average domestic              deprived areas (QoL 2020)16.
  consumption for electricity was
  3,423 kwh per household, below
  the national average of 3,770
                                          Environment
  kwh80.                                  Bristol was the first city
                                                                                     satisfied with parks and open
● Citywide carbon emissions have          to declare an Ecological
                                                                                     spaces in Bristol, but only 53%
  decreased by 40% since 2005. Per        Emergency86 and signed the                 in the most deprived areas (QoL
  capita emissions have reduced by        Glasgow Food & Climate                     2020)16.
  48%81.                                  Declaration in 202087 .                  ● Around 15% of Bristol (1,787
Air quality                               ● 86% of residents are concerned
                                            about the impacts of Climate
                                                                                     hectares) is currently protected
                                                                                     for wildlife88.
Bristol City Council is                     Change (QoL 2020)16.
                                                                                   ● Bristol has 33 conservation areas
developing a Clean Air Plan to            ● 79% of local residents are               and over 3,800 allotment plots89.

 State9of Bristol: Key facts 2017-18 (Feb 2018)
 page                                                                               Bristol Key facts 2021 (Marchpage
                                                                                                                  2021)9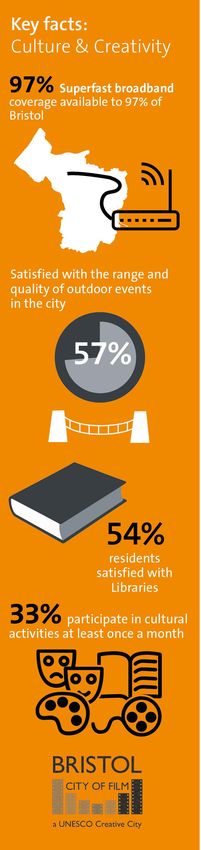
Culture & creativity                                90

COVID-19 has had a devastating effect on the culture and
creative sector; along with hospitality and leisure, the majority
of the creative economy is predicated on performance and
production, live and in-person experiences with museums,
theatres, festivals and events, film and TV production all
ceasing activity and closing their doors in mid-March 2020.
Some venues have only been able to reopen for limited periods
with reduced capacity and have lost a significant proportion of
their projected income.
Despite this huge impact, Bristol has used its creative talent
to adapt wherever possible. The successful Wildscreen Festival
- the world’s largest wildlife film and TV festival and Encounters film
festival went virtual, attracting great speakers such as Sir David
Attenborough and Greta Thunberg and launching the Lockdown
Depict short series of films.
● Bristol is a UNESCO City of Film,       ● 54% of local residents said
  and has led the design and                they’re satisfied with Libraries,
  development of the multilingual           unchanged to the previous year
  Cities of Film website which              (QoL 2020)16.
  launched in July 202091.
                                          ● 35% of people are satisfied with
● Bristol named as the UK’s most            activities for children / young
  artistic city (April 2019)92.             people (37% in 2019) (QoL
                                            2020)16.
● Superfast broadband coverage
  (>=30 mbps) is now available to
  97% of Bristol’s premises93.            Tourism
● 96% of residents have access to         ● In 2019 it was reported that the
  the internet at home, reducing            visitor economy in Bristol and
  to 92% for residents living in the        South Glos was valued at £1.4bn,
  most deprived areas (QoL 2020)16.         and accounted for over 21,650
                                            jobs (full-time equivalent). At the
● 2019/20 brought more large                time total ‘tourism supported
  productions to the Bottle Yard            business turnover’ was estimated
  Studios, including Agatha                 at £1.85bn95.
  Christie’s The Pale Horse (BBC),
  Jane Austen’s Sanditon (ITV) and        ● Bristol City Council’s Museums,
  two Netflix productions; ‘The             Galleries & Archives attracted
  One’ and ‘Industry’94.                    just over 1.06 million visitors
                                            in 2019/2096. As with all such
● 57% of residents are satisfied            locations they have been closed
  with the range and quality                for the majority of 2020/21 due
  of outdoor events in the city ,           to lockdowns but there has been
  whereas in 2019 this was 74%              a significant uptake of online
  likely reflecting the impact of           events and website visits.
  COVID-19 (QoL 2020)16.
                                          ● In 2019 Bristol City Council
● Only 33% of Bristol residents             hosted over 200 festivals and
  participate in cultural activities at     events at more than 60 locations
  least once a month, down from             welcoming over 1 million
  43% in the previous year (QoL             visitors97.
  2020)16.

 State10
 page  of Bristol: Key facts 2017-18 (Feb 2018)                                   Bristol Key facts 2021 (March 2021)
                                                                                                              page 10
Economy & Employment 98
Bristol has created one of the most vibrant and successful
economies in the UK. Nationally, among the Core Cities, Bristol has
experienced sustained growth in both population and economic
scale and has the highest productivity levels per capita, employment
and qualification rates of the major cities. Within the West of
England, Bristol is the primary economic centre with nearly half of
all the jobs (44.8%) and enterprises (40.1%).
The economic impact of Covid-19 has been an unprecedented
shock for Bristol, as for all cities around the world. While the diverse
and high skilled economy of the city has provided some protection
for our key industries and employment, the full impact of the
current economic crisis on businesses and the labour market is not
yet known.
Employment aged 16-24 years (19% of
claimants) and 3, 575 residents
● In September 2020 the aged 50 years and over (18% of
employment rate in Bristol claimants)97.
was 75.8% meaning 249,400
● National government support
working age residents were in
programmes such as the
employment. This represents
Coronavirus Job Retention Scheme
a 9% decrease compared to the
are potentially masking real levels
previous year when 274,000
of rising unemployment and
residents were in employment99.
benefit claimant rates, once these
● The employment rate in Bristol schemes end there is the risk that
is the second highest of the UK there will be increases in both
core cities and slightly above the rates. In July 2020 it was estimated
national average at 75.7%. Leeds that 30% of employee jobs were
employment rate is 80.4%97. furloughed in Bristol, which
● 11,100 working age residents equates to nearly 70,000 jobs. This
were unemployed in the 12 has reduced to 11% of employee
months ending September 2020, jobs in December 2020100.
a rate of 4.2% equal to the UK ● In 2020 average earnings in
unemployment rate (model Bristol were £31,900 a year (up
based). Bristol has one of the from £30,400 in 2019) compared
lowest unemployment rates to £30,500 in Great Britain97.
compared to the UK core cities,
● In 2020 there were 22,780
equivalent to Leeds (4.2%) and
business units in Bristol (VAT
just above Sheffield at 4.1%97.
/ PAYE registered), an increase
● In December 2020 19,615 from 22,475 in 2019. 18,560
working age residents were business units (over 81%) with
claiming out of work benefits, 0-9 employees and therefore
this represents 6.2% of the city’s classified as micro businesses.
working age population. This Just under 19% of registered
is an increase of over 11,000 businesses in 2020 were private
residents compared to March sector employers with 10-250
2020 when the rate was 2.7%97. people97. population in 2019, an increase
● The overall claimant count ● Bristol had 91.3 business start- of 3.6% since 2015, to 2,895 new
includes 3,760 young people ups per 10,000 working age enterprises101.
State11
page of Bristol: Key facts 2017-18 (Feb 2018) Bristol Key facts 2021 (March 2021)
page 11Endnotes section
1
Please note that different indicators update at different points during the year. The latest available data is
always used
Context
Further info at:
One City Plan
West of England Combined Authority (WECA)
Bristol Corporate Strategy (2018/23)
Learning City
Bristol Active City
Bristol and the UN Sustainable Development Goals
2
Population
Further info: Population of Bristol information found on the Bristol City Council website
3
10 UK Core Cities: Birmingham, Bristol, Cardiff, Glasgow, Leeds, Liverpool, Manchester, Newcastle, Nottingham
and Sheffield. Note – some indicators only use the 8 English Core Cities
4
Population: ONS Mid-2019 Population Estimates
5
Diversity: ONS Census 2011
6
BCC School Census Jan 2020
7
Communities & living
8
Bristol City of Sanctuary
9
BCC: Information and Analysis Team
10
Definition: A Child Protection Plan assesses the likelihood of the child suffering harm and looks at ways that the
child can be protected; decide upon short and long term aims to reduce the likelihood of harm to the child and to
protect the child’s welfare; clarify people’s responsibilities and actions to be taken.
Disadvantaged. Source: BCC School Census, Jan 2020, and Pupil Premium data July 2020, covering Bristol school
11
age pupils aged 5-16 yrs, in BCC schools & academies. Disadvantaged is defined as pupils who have “ever been In
Care, been adopted or been eligible for free school meals at any point in the last 6 years”
12
Child Poverty: Official experimental statistics using the Relative Poverty definition. Relative low income is
defined as a family in low income Before Housing Costs (BHC) in the reference year. A family must have claimed
one or more of Universal Credit, Tax Credits or Housing Benefit at any point in the year to be classed as low
income in these statistics. Children in low income families local area statistics 2014/15-2018/19
State12
page of Bristol: Key facts 2017-18 (Feb 2018) Bristol Key facts 2021 (March 2021)
page 12NEET (16 & 17 year olds not in education, employment or training or whose activity is not known, over 3
13
months Dec-Feb): Source: Dept. for Education, 2020
Fuel Poverty. Based on Low Income High Cost method. Source: Dept for Business, Energy and Industrial strategy,
14
2018 via Public Health Outcomes Framework 2020 (indicator B17)
15
Food insecurity is defined as “Limited or uncertain availability of nutritionally adequate and safe foods or
limited or uncertain ability to acquire acceptable foods in socially acceptable ways (e.g. without resorting to
emergency food supplies, scavenging, stealing or other coping strategies” Source: The Food Foundation
Source for all “QoL 2020” is the 2020 Bristol Quality of Life survey. Results at Qol on the Bristol City website.
16
“Most deprived areas” are the 10% most deprived LSOAs within Bristol
BCC Regulatory Enforcement & Compliance: April 2020
17
18
BCC – Public Health
19
BCC – Can Do Bristol & Covid19 Response team. Data is from April 2nd 2020 to February 22nd 2021.
20
Crime and safety
Data in this section is from Avon and Somerset Constabulary, 2019/20, other than perception data via Quality of
Life survey 2020.
21
Total recorded crime - Avon & Somerset Constabulary NB: Historic data has been recalibrated due to a change in
calculation
22
Total recorded crime per 1000 population - Avon & Somerset Constabulary
23
Number of hate crimes - Avon & Somerset Constabulary
24
Health & wellbeing
This section is taken mainly from the JSNA 2020/21 and 2019/20 updates
25
National coronavirus data
26
ONS data for registered weekly deaths
Population denominators for calculating rate are mid-2019 estimates:
ONS data for people, population and community
27
Life expectancy at birth: ONS, 2017-19, via Public Health Outcomes Framework (PHOF) 2021 (indicator A01b)
28
Life expectancy gap: Slope index of inequality, PHE, 2016-18, via PHOF 2020 (A02a)
29
Healthy Life Expectancy: ONS 2016-18, via PHOF 2020 (A01a)
30
Under 75 mortality: Public Health England (based on ONS data), 2017-19, via PHOF 2021 (E04a)
31
Depression: NHS Quality Outcomes Framework (QOF) 2019/20, via PHOF 2021. Definitions: a) Patients (18+) on
Bristol CCG GP registers recorded as having depression; all patients diagnosed from April 2006 with an unresolved
record of depression in their record. b) Patients (18+) registered with depression for the first time.
32
Self-harm: Hospital admissions due to self-harm in 10-24 year olds, 2018/19. Hospital Episode Statistics (HES)
via PHOF 2021.
33
Excess weight in adults: Active Lives survey, Sport England, 2018/19 via PHOF 2020 (C16)
State13
page of Bristol: Key facts 2017-18 (Feb 2018) Bristol Key facts 2021 (March 2021)
page 13Excess weight in children: National Child Measurement Programme 2019/20 via PHOF 2021 (C09a & C09b).
34
Note: Lower participation than usual due to the pandemic.
Physical activity: Active Lives survey, Sport England, 2018/19 via PHOF 2020. Definition: % adults (19+) that
35
have 150+ moderate intensity equivalent minutes per week.
36
Smoking: Adults is Annual Population Survey 2019, and “% of women who smoke at time of delivery”
(pregnancy) 2019/20 via PHOF 2021 (C18/C06)
Alcohol: Hospital admissions for alcohol-related conditions (narrow definition). Source: PHE, 2018/19 via PHOF
37
2020 (C21)
38
Teenage pregnancy: Rate of conceptions per 1,000 females aged 15-17, ONS 2018, via PHOF 2020
39
Dementia: NHS Quality Outcomes Framework (QOF), 2018/19 via PHOF 2020
40
Suicide: Suicide rate per 100,000 persons, 2017-19 via PHOF 2021 (4.10)
41
Education & skills
42
OFSTED ratings, Nov 20
43
Early Years, 2019 results
44
Key Stage 2 2019 results
45
Key Stage 4 2019 results
Attainment 8 is a student’s average achievement across 8 subjects, with extra weighting given to Maths and
46
English
Disadvantaged pupils are those who have “ever been In Care, been adopted or been eligible for free school
47
meals at any point in the last 6 years”
Progress 8 is a value added measure which compares how well a student does when compared to other pupils
48
with the same prior attainment at the end of Key Stage 2. Progress 8 national average is always zero.
49
GCSE “strong pass” = GCSE grade 5 or above. Source: DfE GCSE performance tables, 2018/19
50
Post 16 2019 results
51
SEN: Local area SEND report England
52
Apprenticeships data: apprenticeship- and-traineeships-annual-data
53
ONS Annual Population Survey Jan-Dec 2019
54
Graduates: Higher Education Statistics Agency 2020
55
Higher Education. Source: Higher Education Funding Council for England.
TUNDRA (tracking underrepresentation by area) is an area-based measure that uses tracking of state-funded
mainstream school pupils in England to calculate young participation. Data published in 2019, tracking students
who took GCSEs between 2010-2014). “Bristol South” is all areas south of the river
56
Neighbourhoods’ here are Middle Super Output Areas (MSOAs).
State14
page of Bristol: Key facts 2017-18 (Feb 2018) Bristol Key facts 2021 (March 2021)
page 1457
Housing
Valuation Office Agency: September 2020
58
BCC Residential Development Survey, 2020.
59
Affordable housing is social rented, affordable rented and intermediate housing, for eligible households whose
60
needs are not met by the market.
61
BCC Housing Options 2020
62
BCC Housing Options (via SPAR.net – Jan 21)
63
BCC Accessible Housing 2020
64
Building Research Establishment
ONS UK House Price Index. Contains HM Land Registry data © Crown copyright and database right 2020. This
65
data is licensed under the Open Government Licence v3.0
66
Affordability ratio: ONS Ratio of house price to residence-based earnings. By dividing the house price for a
given area by its earnings, a ratio is produced which serves as an indicator of relative affordability. A higher
ratio indicates that on average, it is less affordable for a resident to purchase a house in their local authority
district. While there are many more factors that influence affordability, the simple ratio provides an overview of
geographic differences across England and Wales.
67
Transport
A Safe Systems Approach to Road Safety in Bristol. 2015
68
Bristol Transport Strategy
69
ONS 2011 Census, via analysis by BCC Insight, Performance and Intelligence
70
National Highways and Transport survey 2019 – Bristol analysis
71
Passenger Focus Survey 2019
72
Bus passenger journeys: Local bus passenger journeys (BUS01)
73
Department for Transport Table CGN0501
74
A&S road traffic statistics. Three month data lag – Data reported in 2019/20 relates to Jan-Dec 19.
75
BCC Road Safety in Bristol: A 10 year plan 2015-2024
76
Sustainability & environment
77
Compare the market - UK’s greenest cities and towns
78
Ofgem’s decision for typical domestic consumption values 2020
79
BCC – Energy service
80
Electricity consumption: Regional-and-local-authority-electricity-consumption-statistics
81
DECC data 2005-2018
82
BCC – City Innovation and Sustainability Team
State15
page of Bristol: Key facts 2017-18 (Feb 2018) Bristol Key facts 2021 (March 2021)
page 1583
Air Pollution mortality: Health Impacts of Air Pollution in Bristol report. Air Quality Consultants (2016). The
report considered deaths attributed to exposure to both nitrogen dioxide (NO2) as well as fine particulate matter.
84
Clean Streets strategy
85
BCC – Waste strategic client
86
The Ecological Emergency - A call to action - Bristol Green Capital
87
HOME | Glasgow Food and Climate Declaration
88
One City Ecological Emergency Strategy
89
Bristol City Council Allotments, 2020
90
Culture & creativity
91
Cities of film: News
92
Premier Inn survey: Artistic Cities
93
Connecting Bristol September 2019
94
Film & TV activity. Source Bristol Film Office, 2020
95
Destination Bristol 2019
96
BCC Culture: Transformation
97
BCC Culture and Creative Industries
98
Economy & Employment
99
Nomis official labour market statistics
100
Coronavirus Job Retention Scheme statistics: January 2021 - GOV.UK (www.gov.uk)
101
Business Demography, UK 2019: Business demography, UK - Office for National Statistics (ons.gov.uk)
Compiled by the Strategic Intelligence and Performance Team, Insight,
Performance and Intelligence Service, Bristol City Council.
www.bristol.gov.uk/statistics.
Documents available in other formats:
If you would like this information in a different format please contact:
research@bristol.gov.uk or phone 0117 9222704
State16
page of Bristol: Key facts 2017-18 (Feb 2018) Bristol Key facts 2021 (March 2021)
page 16You can also read