State of Bristol Key Facts 2020 - Insight, Performance and Intelligence Service - Bristol City Council
←
→
Page content transcription
If your browser does not render page correctly, please read the page content below
State of
 Bristol
 Key Facts 2020
  June 2020 Update

Insight, Performance and Intelligence Service
www.bristol.gov.uk
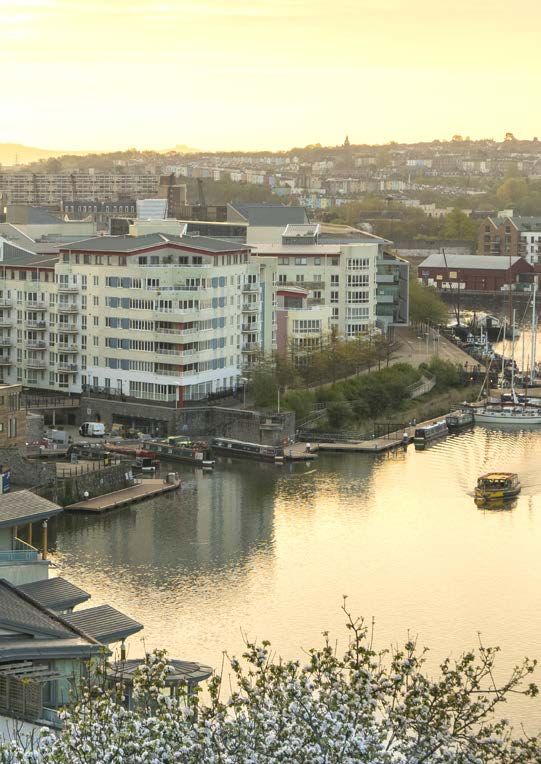
Context                     1

Bristol is a thriving and
innovative global city
                                            “Diversity”, “Culture” and “Green”
and home to a wealth                        The top 3 words used by residents to
of cultures and creative                    describe what they most enjoy about Bristol
ideas. It has a bold vision                 (Quality of Life Survey 2019)
to build partnerships to
take on challenges such                   to all, where an increasing number      commitment to work together
as connectivity, health                   of people enjoy living, working and     across different sectors to tackle
                                          studying, and with some of the          these challenges, as the council’s
and wellbeing, homes and
                                          most environmentally conscious          role evolves from primarily providing
communities, inclusive                    residents in the UK.                    services to empowering others to
economy, sustainable                                                              collaborate to get things done.
                                          Bristol is also a city of contrasts,
environment and learning
                                          where some of the most some of          This will be instrumental in
and skills to ensure                      the most deprived areas border the      supporting COVID-19 recovery in
everyone can share in its                 most affluent. The city continues       Bristol as future plans change focus
successes.                                to wrestle with issues such of          to meet this challenge that affects
                                          congestion, environmental pollution     everyone living and working in the
With a population increasing at
                                          and increasingly unaffordable house     city.
a higher rate than comparable
                                          prices.
UK cities and at least 91 different                                               This current Key Facts report is
languages spoken by residents,            The One City Plan, the second           largely based on annual data and
Bristol continues to build on its         iteration of which was published in     updates published during the year
strengths as a place welcoming            January 2020, set out the city’s        up to the end of March 2020, so in
                                                                                  most cases does not yet reflect the
                                                                                  impact of COVID-19 and subsequent
                                                                                  measures. The document is updated
 This report is a summary of key indicators                                       twice a year and will help to shape
 about Bristol at the end of 2019-20. It is                                       the journey ahead by informing
 not an assessment of the recent impact of                                        partnership work and providing a
                                                                                  snapshot of the data behind the
 COVID-19.                                                                        bigger picture.

 State2of Bristol: Key facts 2017-18 (Feb 2018)
 page                                                                       State of Bristol: Key facts 2020 (Junepage
                                                                                                                   2020)2
Population 2
Key facts: Population
mid
mid mid 2039
2019 2029
For more information see: www.bristol.gov.uk/population
Bristol is the 10th largest city in Great Britain and one of the
ten ‘Core Cities’3, with an estimated population4 of 463,400.
Bristol’s mid-2019 population Bristol’s 85,900 children make up 463,400 496,200 523,400
is estimated to be 463,400. The 18.5% of the total population.
overall population number is
broadly unchanged in the 12
The growth in the number of Diversity
y
primary school age children in Non-’White British’ White British
months between 2018 and 2019.
Mid-2019 represents a break in a
recent pattern of historically high
Bristol in the last decade is one of
the highest in the country.
22% 78%
annual population change - the last Bristol’s 60,300 older people make
time that there was no growth in up just 13% of the total population
Bristol’s population was between (England & Wales 18.5%).
2001 and 2002. Nationally the
population increased by just 0.5%
A growing city
between 2018 and 2019 - the
slowest rate for 15 years. If recent trends continue, the total
>180 countries of birth
The main factors effecting Bristol’s
population of Bristol is projected to >45 religions
population change include the
lowest number of births for 13
increase by 69,300 people over the
25 year period (2018-43) to 532,700 >91 languages
by 2043. This is a 15% increase and
years, alongside a large fall in net
is higher than the 10% increase for
international migration. The effect
England and the highest % increase More recent data on school pupils
of Brexit can be clearly seen with
a decline in the number of EU
of the other English Core Cities6. Deprivation
shows that the % of pupils who are
not ‘White British’ has increased
nationals registering for a National By mid-2031 Bristol Local Authority 16%
from 31%(73,700
in 2011people)
to 38% in 20208.
Insurance Number (NINo) in Bristol is projected to include for the first live in areas among
since the EU Referendum in June time more than half a million usual the most
2016. residents. Deprivation
deprived
Bristol has just over 357,400 10% nationally
Deprivation is explained at
registered voters5 (31st Mar 2020) Diversity 7
www.bristol.gov.uk/deprivation
New deprivation 2019 data shows
The population of Bristol has
that
% Bristol has 41 areas in the most
Age profile become increasingly diverse and White White Black
deprived 10% in Year
England, including
British British
Bristol has a relatively young age
some local communities have British
3 in the most deprived
2011 1%. The31.1%
68.9%
profile with more children aged
changed significantly. There are in levels of2012
greatest deprivation
65.4% are
34.6%in
now at least 45 religions, at least
0-15 than people aged 65 and over.
187 countries of birth and at least
Bristol& Withywood,
Hartcliffe 2013
2014
66.5% 33.5%
Filwood
65.8% 34.2%
The median age of people living in and Lawrence Hill.
91 main languages spoken. Schools 2015 64.9% 35.1%
Bristol is 32.4 years compared to 2016 63.9% 36.1%
In Bristol 15% of residents - 70,700
40.2 years in England and Wales. The proportion of the population 2017 63.2% 36.8%
people - live in the2018
10% most
62.6% deprived
37.4%
who are not ‘White British’ increased
areas in England, including 19,000
from 12% (2001) to 22% (2011).
children and 7,800 older people.
State of Bristol: Key facts 2020
2017-18
(June
(Feb
2020)
2018) page 3Communities & living 9
Key facts: Communites
& living
For more details on Bristol’s Quality ofOver 12,500
Life survey referpeople
to
received support from
17%
of children live in
www.bristol.gov.uk/qol Trussel trust foodbanks low income families
in 2016/17
● 14,600 children under 16 live in ● Bristol is a City of Sanctuary.
low income families10 in Bristol, a A Refugees and Asylum Seekers 23,000
rate of 17%, just below the national Inclusion Strategy was Council
Source: is Annual Population Survey, 2016
approved in 202020.
households
average of 18% (2018/19). are estimated
● As at July 2019, 27% of Bristol ● 79% of Bristol residents are to be in fuel
pupils (16,900
10% affected
satisfied with their local area as poverty in
bychildren) are
fear of crime, Bristol (2017)
Disadvantaged 11
.
but 25% in most a place to live, but only 50% of
deprived
(QoL 2017)
areas
● A snapshot of Bristol Social
Services taken at 31st March 2020,
people in the most deprived areas
(QoL 2019). 48% of
residents volunteer
shows that12: ● 71% of Bristol residents feel or help out in their
629 children were in care. that “people from different community at least
292 children had a child backgrounds get on well together” 3 times a year
protection plan13 in their local area (QoL 2019). )21.
78%
Over 1,230 “Children in need” R
Rise
ise
e in
● 48% of residents volunteer or help
(allocated to a Social worker)
of people out in their community at least
● 23,000 have confidence
households were estimated 3 times a year (41% in the most 1,902
in the Police
to experience Fuel poverty in deprived areas) (QoL 2019). 2019/20
Bristol in 2017 (11.7% of Bristol ● 46% of residents are satisfied with 1,933 1,863
2017/18 2018/19
households, above the national Leisure services / facilities in the 1,830
average 10.9%)14 . 1,270 2016/17
city (QoL 2019) . 2015/16
● 5% of households have
experienced moderate to severe
Crime and Safety 22 52,600 crimes were recorded
“food insecurity15 ” In the last 12 in Bristol during 2019/20
months, rising to 12.4% in the 10% Total recorded crime in Bristol in
most deprived areas (QoL 2019)16 2019/20 was similar to the previous
● Just over 96% of inspected food year and a decrease on both 2017/18
premises have a hygiene rating and 2016/17. Crime Rate
(per 1,000 population)
of 3 and above and are broadly ● New data shows that 52,601 122.1 113.5
compliant with food hygiene crimes were recorded in 2019/20, 108.8
regulations17. similar to 2018/19Crimes
(52,392)were
23
. 113
121.7
● 146 food outlets were awarded the recorded in
‘Bristol Eating Better Awards’ in
● The crime rate is 113.5 55,569
per 1,000
Bristol
population (2019/20) 24
. during 2015/
16
2016/
17
2017/
18
2018/
19
2019/
20
2019/20, helping Bristol become 2016/17
● Rates of people whose day to day
a healthier and more sustainable
life is affected by fear of crime
16% affected by fear
food city18.
increased to 16%, but is 35% in of crime, but 35%
in
● 7.7% of 16-17 year olds (2018/19) most deprived areas
the most deprived areas of the city
were “not in education,
employment or training” (NEET)19, 3,100
(QoL 2019).
worse than national average ● Recorded hate crime in 2019/20
(5.5%). (1,902 crimes) was similar to ● There have been 153,613 calls to
the previousAlcohol
three years but has
related the Police during 2019/20) very
increased byhospital stays2012/1325.
177% since similar to the previous year26.
Source: Active Lives Survey 2015/16
State4of Bristol: Key facts 2017-18 (Feb 2018)
page State of Bristol: Key facts 2020 (Junepage
2020)4Health & wellbeing 27
Key facts:
Health & wellbeing
Key facts: Communites
& living Life expectancy (years)
Bristol is an active city with many positives, however it does
perform less well on some indicators. There are also significant
17%
health and wellbeing inequalities within the city.
82.6 78.4
for for
of children live in28
Life income
● low expectancy for women is 22.2% of 4-5yr olds have excess women men in
families
82.6 years and for men 78.4 years weight, rising to 31.5% for 10-11yr in Bristol Bristol
(2016-2018), both are significantly olds (both better than nationally)
23,000
worse than the national average. 2018/19.35 21.5 Additional 17.6
However, in the past five years
households ● 73.5% of Bristol adults are years
lifeestimated
are expectancy for women has 36
physically active , significantly
to be in fuel slightly and has risen
decreased higher than the national average
61.1 60.8
poverty
slightlyinfor men. (67.2%) and highest of all English
Bristol (2017) Healthy life
● The inequalities gap in life core cities.
expectancy
48%
expectancy29 between the most
and least deprived areas of in Bristol is
● The smoking rate is 16.3% (2018)
now similar to the national average.
Bristol Female Bristol Male
9.8 years forresidents
men andvolunteer
7.7 years for
or help out in their
women. community at least
10.1% of women smoke during 54.8%
adults
22.2%
young children
pregnancy (2018/19), just below
3 times
● Bristol’s healthy lifeaexpectancy
year 30 the national average.37 overweight (4/5 yrs) overweight
or obese or obese
(years living in good health) is 61.1 ● There were 3,370 alcohol-related
R
Rise
ise
e in for women and 60.8 years for
years hospital admissions in 2018/1938.
men (significantly worse than the As a rate (856 per 100,000) this
national average of 63.9 and1,902
63.4 is consistently worse than the
years respectively). 2019/20
England average, and is worse for
● On average men live 181,863
1,933 years in men than women. The smoking rate is: 16.3%
2017/18 2018/19 Similar to national average
poor health,
1,830 women live 22 years in ● Teenage pregnancy rates have
1,270 2016/17
poor health. continued to reduce to 11.1per
73.5%
2015/16
● Cancer remains the biggest killer 1,000, significantly lower than the
adults are physically active
52,600 31
crimesearly
under 75 (1,356 weredeaths
recorded national rate 16.7 (2018)39.
Highest of Core Cities
inin Bristol
Bristol in last2019/20
during 3 yrs, 2016-18) ● Over 3,315 patients are on GP
followed by Cardiovascular disease
(686 deaths), Respiratory disease
Dementia registers in Bristol40
(2018/19).
50,300
patients with depression
(350 deaths) and Liver disease
Crime Rate
(189 deaths). ● The suicide rate in Bristol was 11
(per 1,000 population)
● 50,300 Bristol GP patients (11.8%)
122.1 113.532
per 100,000 persons (2016-18),
above the national average of 9.6, 3,370
108.8
have a diagnosis of depression , Alcohol-related hospital stays
but a significant reduction on
above121.7
the England average
113 (10.7%). 2014-16 (12.6)41. Under 75 mortality rate from all
● Rates of young people admitted cardiovascular diseases
● 75% of Bristol residents are
to hospital
2015/ 2016/ due to self-harm
2017/ 2018/ (680
2019/ satisfied with life (QoL 2019), but
88.4 85.4 82.2 76.5 80.3 78.3
16 17 18 19 20
per 100,000) continue to increase only 58% of people in the most
16%
and are still significantly
affectedworse
by fear deprived areas42. 2011/ 2012/ 2013/ 2014/ 2015/ 2016/
than the England average (444 per
of crime, but 35%
100,000).33 most deprived areas
in ● There were 276 lab-confirmed
13 14 15 16 17 18
cases of COVID-19 per 100,000 ● The mortality rate for COVID-19
● 54.8% adults in Bristol are people on 30 June 2020, was 68.8 per 100,000 people, lower
overweight or obese, better than significantly lower than the English than the England average of 81.9
the national average (62.3%)34. core cities average of 46843 (1 March - 31 May 2020)44
State of Bristol: Key facts 2020
2017-18
(June
(Feb
2020)
2018) page 5Education & skills 45
Key facts:
Education & skills
Bristol has a skilled workforce with a high proportion of graduates 70.6% of
children under 5
and students living in the city, and is committed to making have a Good Level of
apprenticeships available to all young people. Development at
Foundation Stage
● Of the 152 schools in Bristol ● In 2018/19 (academic), 15.5%
inspected by OFSTED46 78.3% are of Bristol pupils received Special National average 71.8%
rated as Good or Better for overall Educational Need (SEN) support
effectiveness. or have an Education Health & 65% of 11 year olds achieved
Care Plan (EHCP), higher than the expected standard in Reading,
● In Early Years47, 70.6% of children Writing and Maths.
15.2% nationally 55.
under 5 have a Good Level of
Development at Foundation 35,000
There were 2,860 apprenticeships
●
Stage (2019), much improved full started in Bristol
time students Bristol 56.
liveinin2018/19
from its inception in 2013 during term time
(49.5%), but slightly below the
● During 2018/19, 1,170
(up 10,100 since 2001) (Source census)
apprenticeships were completed57..
National average 65%
England average of 71.8%.
● 51% of Bristol working age
Progress 8:-0.05
● For Key Stage 2 pupils (at 11 years girls-0.02, boys -0.08
residents are qualified to degree
of age) 2019 data48 shows 65%
achieved the expected standard
level or above compared to the GB
average of 40%58. Bristol residents
38.6% of Bristol pupils
in Reading, Writing and Maths achieved a
combined, the same as the
national average.
6.7%
are more highly qualified than all
other Core Cities. NEET
“strong pass in both
English and Maths
similar to GCSE
● In 2018/19 there
core were
cities 56,000
(2014)
● For Key Stage 4 (at age 16),
students registered at the two Below National average 43.4%
2019 data49 shows the average
Bristol universities - 26,000 at
Attainment 8 score50 per pupil
University of Bristol (UoB) and
is 44.7 points, down from 45.5
points in 2018. Nationally this
30,000 at University of the West
of England (UWE)59. 78.3%
is 46.8, up from 44.5 points in of Bristol Schools rated Good or
2018. For disadvantaged pupils51, ● Over the last 5 years there has Better by OFTSED (Feb. 2020)
Bristol Attainment 8 is only 33.6.
● Bristol’s Progress 852 score is
10 years
been an increase in university
For student numbersinofa8,300 row (18%),
GCSE mainly due to an increase in full
-0.05, marginally worse than the results
time students studying at UoB.
national benchmark (0.03 by have
● The number of overseas students
56,000 students
definition) but an improvement improved at the 2 main universities
from -0.09 in 2018. Progress 8 for has more than doubled since
2001/2 and makes up 25% of
girls is -0.02, and is -0.08 for boys.
For Disadvantaged pupils the all students at UoB (5% EU, 20% 51% 40%
National average
Progress 8 score is -0.48. non-EU) and 13% of all students
at UWE (3% EU, 10% non-EU).
● 38.6% of Bristol pupils53 achieved
a “strong pass” in both English ● Significantly less young people in
and Maths GCSE, below the Bristol go on to Higher Education Bristol residents
national average (43.4%). (28.7%, compared to 40.3% for qualified to degree level
England 2010-14)60. In South Bristol
54
● Post 16 data indicates
that pupils are consistently
this is 20.1%, less than half the English 3 of the4 worst performing areas in
rate, plus 3 of the 4 worst performing the country for young people going on
maintaining a Grade C at A-level to Higher Education are in South Bristol
neighbourhoods are here in Hartcliffe, ( Hartcliffe, Withywood and Highridge)
(average points score of 32.69 in
Withywood & Highridge.
2019, from 31.57 in 2018).
State6of Bristol: Key facts 2017-18 (Feb 2018)
page State of Bristol: Key facts 2020 (Junepage
2020)6Key facts:
Housing 62
Housing
Key facts: Housing
1,799
beds available in Bristol in 201970. new homes
Building homes built in
● Between Jan and Dec 2019, 785 Bristol in
There are 201,980 homes in Bristol63.
homeless individuals were 2018/19
Since 2006, 23,319 new homes have
supported by St Mungo’s
been built in the city, an average of
some 1,793 a year64. The Bristol Local
Plan will enable the delivery of at
outreach team71.
● As at 31st March 2020 there £
homes
220
affordable homes
least 33,500 new homes in Bristol by were 728 households living in built in 2018/19
2036, including affordable to meet a temporary accommodation, a
Rough Sleeping
range of needs65. significant increase on 2019 as a
result of coronavirus72.
● 1,799 new homes were built 86 98
97 2017 2019
in Bristol during 2018/19. This ● During 2019/20, 499 empty 2015
41 82
included 301 student housing private sector dwellings were 9 2013 74
41 2018
2012 2016
units, providing 623 bedspaces 66. returned into occupation73. 2014
● During 2018/19 there were 220
affordable homes built66.
Housing Market 618
● Bristol Household tenure: 53% homeless households
● As at 15th April 2020, Bristol in 2019/20
Owner occupied, 29% Private
City Council had 26,885 Council
Rented, 18% Social Rented74. Private rented sector
Homes under its control67.
has grown
● Average house prices: Bristol: from
● As at 1st April 2019, there were
11,066 planning permissions for
£285,300. England & Wales: 12% in
£242,50075 (Jan 2020) 2001 to
new dwellings 64.
● Average house prices in Bristol 29% in 2007
Homelessness have increased by £117,200 over
the last ten years, an increase Bristol average:
Data on homelessness may only
show the tip of the iceberg, and
of 70%. This compares with an
increase of 41% for England and
£285,300
doesn’t include people sleeping in
Wales over the same period76.
unsafe buildings or sofa-surfing Bristol
etc. The vast majority of homeless
people will sleep rough only when
● Earnings in Bristol are similar to the
national average but house prices £ 70%
they have no other options. in Bristol are significantly higher, England & Wales 41%
resulting in affordability issues. 2009 2019
● Latest figures found 98 people Average house prices increase in
sleeping rough68 on the street in a ● In 2019 Bristol had a ‘housing the last decade (+£117,200)
single night in Bristol (Nov 2019), affordability ratio’ of 8.89, which
a rapid rise over the last 7 years means that the average house £250K Average
(9 in Nov 2012). price is almost 9 times higher
than average earnings. This is £ house price Housing
affordabilty
ratio
● As at 31st March 2020 there were £50K Earnings
higher than the England average
618 homeless households that
of 7.83, and the highest of all 2009 2019
Bristol council had a statutory
of the English Core Cities (who ‘Housing affordability ratio’
duty to house69.
● There were over 1,440 Night
all have ratios lower than the
national average)77.
of 8.89 for average house
prices to average earnings
Shelter and Supported Housing
State of Bristol: Key facts 2020
2017-18
(June
(Feb
2020)
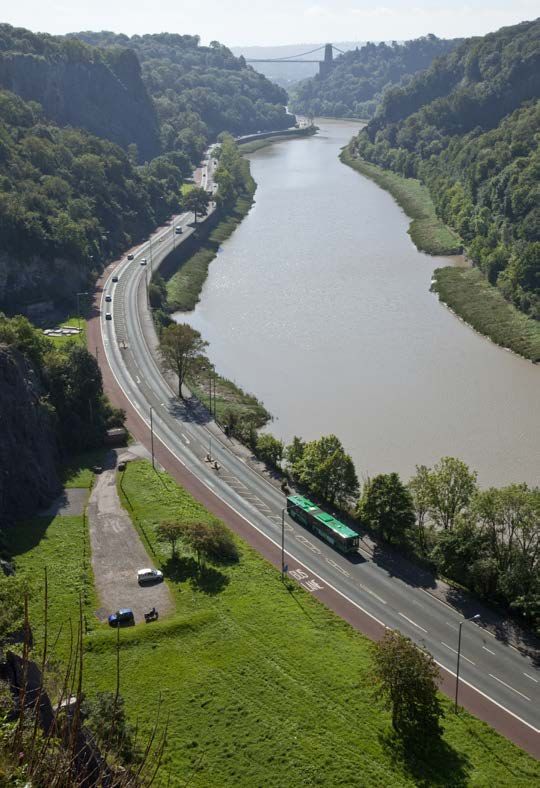
2018) page 7Transport 78
Key facts: Transport
In 2019 BCC adopted the ● 86% of bus users in 2019 were
Bristol Transport Strategy79 satisfied with bus services in the 57,000
that sets out our vision and West of England area85. Walk or cycle to work - highest in
England & Wales
ambition for transport in ● The number of bus passenger
the city up to 2036. This is journeys (per head of population) Number of
people
supported by our One City Plan in Bristol in 2018/19 was 92.3,
cycling to
and the Joint Local Transport a significant increase of 35% work
Plan for the West of England compared to 2013/14 (68.2). This increased to
compares to a national decrease in
region.
journeys of 11% over the same five 11.35%in 2019 compared
year period86. to 10% in 2018
Less than half of Bristol residents
● In 2011 there were 190,000 cars
travel to work by car, with the
majority travelling by public in Bristol, a rise of 25,200 in the 190,000
transport, walking, cycling or decade before. Car ownership cars (up 25k
levels are 2nd highest in Bristol since 2001)
working from home, and around
of the British Core Cities, but
a third of households do not have 20 30 40
access to a car80. People in the most
the average number of cars per
household is 1.04, lower than the
10
0
50
60 15.9
deprived areas of Bristol are far less
likely to own and drive a car, and far
England and Wales average of
1.1787.
mph
mph
more likely to walk or get the bus average speed on Bristol roads
In 2019
than people in the least deprived In 2015 it was 16 mph
areas81. Traffic
● Despite improvements in air ● The average speed on local A 77%
quality, NO2 levels are still above roads in Bristol was 15.9 mph in feel traffic
EU limits in central areas and on 2019 slightly higher than 2018 congestion is a problem in
main radial roads. (15.3 mph)88. their area
● Bristol has very high levels of ● 77% of Bristolians feel that traffic People killed or seriously
walking and cycling compared congestion is a problem in their injured in road traffic incidents
to most other UK cities. In area (64% do in the most deprived in Bristol
2011 more people in Bristol areas) (QoL 2019).
commuted to work by bicycle or
● 78 people were killed or seriously
on foot than in any other Local
injured in road traffic incidents
Authority in England and Wales,
in Bristol during 2019/20, a 29%
at 57,000 (27% of the working age 2014 2015 2016 2017 2018 2019
decrease compared to 2018/19 /15 /16 /17 /18 /19 /20
population)82.
but similar to 2017/1889.
● The number of people cycling
● Children in the most deprived Bus Passenger journeys
to work in Bristol increased to (per head of population)
areas are six times more likely
11.35% in 2019, up from 10% in 63.7 68.2 73.8 79.5 87.8 92.1 92.3
to be injured in motor traffic
201883.
collisions than those in the least
● Over a quarter (27%) of Bristolians deprived areas90.
now ride a bike at least weekly
● 49% of residents are satisfied with
(19% in the most deprived areas)
the management of roadworks 2012 2013 2014 2015 2016 2017 2018
(QoL 2019)84. /13 /14 /15 /16 /17 /18 /19
in Bristol, compared to 52%
nationally83.
State8of Bristol: Key facts 2017-18 (Feb 2018)
page State of Bristol: Key facts 2020 (Junepage
2020)8Sustainability Key facts: Environment
300 deaths
& environment 91 each year
in Bristol estimated as attributed
to air pollution. 8.5% of all
deaths
Bristol is committed to being a carbon neutral city by 2030.
88% of residents are
● Despite increased numbers of concerned about the impacts of
Energy people using public transport, Climate Change
The council owns wind turbine
installations that produce enough
walking and cycling, continued
levels of vehicle use (pre 81% of residents
think street litter
energy to power more than 5,500 COVID-19) mean that reported
is a problem
average homes. air pollution levels of nitrogen
in their area
dioxide still exceed the UK and
● The council has reduced the carbon
emissions it measures from its
EU air quality limits96.
● In 2016 it was estimated that
46.8% of all
household waste was
direct operations by more than
77.4% since 2005/06, and plans approx. 300 deaths each year in sent for reuse, recycling
Bristol can be attributed to air and composting (2020)
to become a net zero carbon
pollution97. This is 8.5% of all from 37.4% in 2009/10
emitter by 202592. The council is
deaths.
working to put together a City Leap
Partnership that will deliver large Waste
129kg ofhousehold
waste per
was
scale citywide carbon reductions landfilled in
during the next decade. The Clean Streets strategy98 2019/20
continues to make Bristol
● The total installed renewable
electricity capacity in Bristol at measurably cleaner .
the end of 2018 was 87.4MW, compared with 230kg in 2016/17
● 46.8% of all household waste
an increase of 32% in the last
five years. Actual generation has
was sent for reuse, recycling and
composting in 2019/20, up from 87 MWe (MegaWatt Equivalent)
renewable energy produced
increased by 46% in the same 37.4% in 2009/1099.
time. 36.4MW is from onshore locally (2017/18)
● 15.9% of municipal waste was
wind turbines, and 27.2MW is
from solar photovoltaic panels93. sent to landfill (2019/20). 129kg 36 MWe
from onshore wind turbines
of waste per household was
● In 2018 the average domestic
consumption for electricity was
landfilled in 2019/20, compared
with 230kg in 2016/17100. 27 MWe
3,432 kwh per household, below
the national average of 3,799 kwh94. ● 81% of residents think street
litter is a problem in their
from solar
15 MWe
from waste
● CO2 emissions have decreased area, rising to 93% in the most plants
by 33% since 2005. Per capita deprived areas (QoL 2019)101.
emissions have reduced by 45%95. ● 72% of local residents are satisfied
Environment with parks and open spaces in
Bristol, but only 53% in the most
Air quality ● Bristol was named as the UK’s deprived areas (QoL 2019)
greenest city in 2019102.
Bristol City Council is developing a ● Bristol’s Wildlife network is 3,000
● 88% of residents are concerned hectares protecting 27% of the
Clean Air Plan to bring air pollution
about the impacts of Climate land area in the city.
within legal limits as soon as possible.
Change (QoL 2019).
● Bristol has 33 conservation areas
and over 3,800 allotment plots103.
State of Bristol: Key facts 2020
2017-18
(June
(Feb
2020)
2018) page 9Culture & creativity 104
Key facts:
Culture & Creativity
Culture is a key component in events in the city, but only 67% 10,220 residents
in the most deprived areas (QoL employed in
Bristol’s economy, providing the creative
2019)109.
jobs and businesses that are and digital
industries
helping the city to thrive. This ● Only 43% of Bristol residents
is a city that combines world- participate in cultural activities at
least once a month (32% in most
renowned festivals, a thriving
deprived areas) (QoL 2019).
Over 47,000
music scene, an amazing students and
pupils visited
architectural and engineering ● 54% of local residents said they’re Bristol museums
heritage, and a burgeoning satisfied with Libraries (QoL 2019) in 2018/19
creative and media sector compared to 60% in 2015.
within an extraordinarily
diverse landscape. Tourism 97% Superfast broadband
coverage available to 97% of
Bristol
In Bristol, culture is at home, on ● There were 13.5m “day visitors”
the streets and across every to Bristol in 2018, 1.8m domestic
neighbourhood. It has been a catalyst staying trips (spend £303m) and
for economic diversification and and 598,000 overseas staying
growth; for talent attraction and trips110.
retention; for inward investment ● The visitor economy in Bristol and
and tourism; and for innovation and South Glos was valued at £1.4bn, Satisfied with the
competitiveness. range and quality
and accounts for over 21,650 jobs
● Approximately 10,220 people
(full-time equivalent). Total tourism
of outdoor events
in the city 74%
supported business turnover is
in Bristol are employed in the
estimated at £1.85bn111.
Creative and Digital industries105.
● Bristol was named Museum
● Bristol named as the UK’s most
artistic city (April 2019)106.
Destination of the Year 2018112. 43% participate in cultural
activities at least once a month
● More than 8.9 million passengers
● Superfast broadband coverage
used Bristol Airport in 2019, flying
(>=30 mbps) is now available to
direct to 125 destinations113.
97% of Bristol’s premises, up from
93% in May 2017107. ● Bristol City Council’s Museums,
Galleries & Archives attracted just
● 2019/20 brought more large
over 1.06 million visitors in 13.7m
productions to the city, including
2019/20114.
Agatha Christie’s The Pale Horse “day visitors” to Bristol
(BBC), Jane Austen’s Sanditon ● Just over 47,100 pupils and
(ITV)and two Netflix productions; students visited Bristol museums
‘The One’ and ‘Industry’. Sanditon
built a whole Georgian street on
in 2018/19, with 95% of all
Bristol schools having visited
125
the Bottle Yard’s backlot, and also or participated in museum-led Bristol Airport
destinations
used the Georgian House Museum activities at least once in the last
which was a major piece of work three years115.
for both the Film Office and ● In 2019 Bristol City Council hosted
Museum teams108. over 200 festivals and events at
● 74% of residents are satisfied with more than 60 locations welcoming
the range and quality of outdoor over 1 million visitors116.
State10
page of Bristol: Key facts 2017-18 (Feb 2018) State of Bristol: Key facts 2020 (June 2020)
page 10Economy & Key facts: Economy &
employment
employment 117
Bristol GVA contributes
£15bn
to the UK econony
Economy people, growing 10% between
Bristol is one of the most
successful cities in the UK,
2015 and 2019.
Employment
£ (2018)
with a higher employment Economic activity
● In 2018, 274,000 people were in 3.9%
rate than other Core Cities. (Jan-Dec
However, Bristol’s prosperity
employment in Bristol, which
2019) 3.9%
represents a growth of 4% since
is not shared by all its citizens 2016. Amongst the British Core
and many areas experience Cities only Leeds (8.4%) and 75.8% 21.1%
multiple deprivation. Manchester (5.0%) grew more
quickly over the same period123. 19.7%
● Bristol contributed £15bn in 76.7
output to the UK economy in ● In December 2019 the %
2018 (inflation adjusted Gross employment rate in Bristol
RISTO
L
B
Value Added, GVA, balanced was 76.7% meaning 245,000
approach) up from £14.6bn118. residents (of working age) were in
RE I
N
G
● The West of England Local employment. The employment AT B R I TA
Source: ONS 2016
Economic Partnership (WoE rate in Bristol is the highest of
LEP) area is amongst the top 5 British Core Cities and 1% above % in employment
enterprise regions with inflation the national average124. % unemployed
adjusted GVA growth rate of ● 10,100 working age residents % economically inactive
1.5% per year over the 10 year were unemployed in the 12 Employment in Bristol (2018)
period 1998-2018119 and has months ending December 2019,
remained one of the most a rate of 3.9% which is the same 10,000 jobs in Manufacturing
productive (GVA per filled job). as the UK level and lowest of the 12,000 jobs in Construction
However, between 2015 and British Core Cities125. 31,000 jobs in Retail & Wholesale
2018 the economy of the WOE 18,000 jobs in Accommodation
● The “Claimant Count” for & Food
LEP grew 7%; in line with LEP
Bristol in March 2020 was 8,520 6,000 jobs in Arts, Entertainment
areas for London and Manchester
residents, including 1,500 & Leisure
and ahead of other core cities
young (16-24 years) people 24,000 jobs in Education
apart from Birmingham120.
(18% of claimants) and 1,815 42,000 jobs in Health & Social Care
● Bristol had 79.7 business start- older (aged 50+) people (21% of
ups per 10,000 working age
population in 2018, slightly
claimants)126.
22,500
● In 2019 average earnings were VAT/PAYE registered
below the core city UK average121.
£30,400 a year in Bristol, and business units
Between 2016 and 2018 the
£30,500 in Great Britain 127. in Bristol
number of start-ups fell by 13.2%
2019
to 2,535. ● In 2018 the Low Carbon Environ-
mental Goods and Services (LCEGS) Average earnings(2018)
● There are 22,500 business units
sector supported about 14,600
in Bristol (VAT / PAYE registered,
employee jobs in Bristol and about £30,500
2019), up from 20,600 in 2015122. £30,400
40,000 in the West of England128.
Around 16% of the registered
businesses in 2019 were private
sector employers with 10-250 Bristol UK
State of Bristol: Key facts 2020
2017-18
(June
(Feb
2020)
2018) page 11Endnotes section
Industrial strategy, 2017 via Public
1
Please note that different 9
Communities &
indicators update at different points Health Outcomes Framework 2020
living (indicator B17)
during the year. The latest available
10
data is always used. Child Poverty: Official 15
Food insecurity is defined as
experimental statistics using the
“Limited or uncertain availability
Context Relative Poverty definition. Relative
of nutritionally adequate and
Further info at: low income is defined as a family in
safe foods or limited or uncertain
One City Plan: low income Before Housing Costs
ability to acquire acceptable foods
www.bristolonecity.com (BHC) in the reference year. A family
in socially acceptable ways (e.g.
must have claimed one or more
West of England Combined without resorting to emergency
of Universal Credit, Tax Credits or
Authority (WECA): food supplies, scavenging, stealing
Housing Benefit at any point in the
www.westofengland-ca.gov.uk or other coping strategies” Source:
year to be classed as low income in
The Food Foundation
Bristol Corporate Strategy these statistics.. Source: www.gov.
16
(2018/23): uk/government/statistics/children- Source for all “QoL 2019” is the
www.bristol.gov.uk/corporate- in-low-income-families-local- 2019 Bristol Quality of Life survey.
strategy area-statistics-201415-to-201819 Results at www.bristol.gov.uk/qol
(published 26 March 2020). “Most deprived areas” are the 10%
Learning City
11
most deprived LSOAs within Bristol
www.bristollearningcity.com Disadvantaged. Source: BCC
17
School Census, Jan 2019, and Pupil BCC Regulatory Enforcement &
Bristol Active City
Premium data July 2019, covering Compliance: April 2020
www.bristolactivecity.org.uk/
Bristol school age pupils aged 5-16 18
BCC – Public Health
yrs, in BCC schools & academies.
Population
2
Disadvantaged is defined as pupils
19
NEET (16 & 17 year olds not in
education, employment or training
Further info: who have “ever been In Care, been
or whose activity is not known, over
www.bristol.gov.uk/population adopted or been eligible for free
3 months Dec-Feb): Source: Dept.
3 school meals at any point in the last
10 UK Core Cities: Birmingham, for Education, 2019.
6 years”
Bristol, Cardiff, Glasgow, Leeds, 20
12 Source for all “QoL 2018” is the
Liverpool, Manchester, Newcastle, BCC: Information and Analysis
2018 Bristol Quality of Life survey.
Nottingham and Sheffield. Note Team
Results at www.bristol.gov.uk/qol
– some indicators only use the 8 13
Definition: A Child Protection “Most deprived areas” are the 10%
English Core Cities
Plan assesses the likelihood of most deprived LSOAs within Bristol.
4
Population: ONS Mid-2019 the child suffering harm and 21
Different backgrounds (eg race,
Population Estimates looks at ways that the child can
disability, sexuality)
5 be protected; decide upon short
Registered voters. Source: BCC
and long term aims to reduce the
Electoral Services
likelihood of harm to the child and
6
ONS 2018-based Sub-national
Crime and safety
22
to protect the child’s welfare; clarify
Population Projections people’s responsibilities and actions Data in this section is from Avon &
7
Diversity: ONS Census 2011 to be taken. Somerset Constabulary, 2019/20,
14 other than perception data via
8
BCC School Census Jan 2020 Fuel Poverty. Based on Low
Quality of Life survey 2019.
Income High Cost method. Source:
Dept for Business, Energy and
State12
page of Bristol: Key facts 2017-18 (Feb 2018) State of Bristol: Key facts 2020 (June 2020)
page 1223
Total recorded crime - Avon & (HES) via PHOF 2020. 1’ figures had been released.
Somerset Constabulary NB: Historic 34
Excess weight in adults: Active 44
ONS Deaths involving COVID-19
data has been recalibrated due to a Lives survey, Sport England, by local area and deprivation
change in calculation 2018/19 via PHOF 2020 (C16) (updated 12 June 2020)
24
Total recorded crime per 1000 35
Excess weight in children:
population - Avon & Somerset National Child Measurement Education & skills
45
Constabulary Programme 2018/19 via PHOF 2020 46
OFSTED ratings, Feb 20:
25
Number of hate crimes - Avon & (C09a & C09b) https://www.gov.uk-school-
Somerset Constabulary 36
Physical activity: Active Lives inspections-outcomes
26
Number of calls - Avon & survey, Sport England, 2018/19 via 47
Early Years, 2019 results: https://
Somerset Constabulary PHOF 2020. Definition: % adults www.gov.uk/early-years
(19+) that have 150+ moderate 48
Key Stage 2 2019 results: https://
intensity equivalent minutes per
www.gov.uk/key-stage-2
Health & wellbeing
27 week.
49
37 Key Stage 4 2019 results: https://
Smoking: Adults is Annual
This section is taken mainly from www.gov.uk/key-stage-4
Population Survey 2018, and “%
the JSNA 2019/20 and updates – 50
of women who smoke at time of Attainment 8 is a student’s
see (www.bristol.gov.uk/jsna)
delivery”(pregnancy) 2018/19 via average achievement across 8
28
Life expectancy at birth: PHOF 2020 (C18/C06) subjects, with extra weighting given
ONS, 2016-18, via Public Health 38 to maths and English.
Alcohol: Hospital admissions for
Outcomes Framework (PHOF) 2020 51
alcohol-related conditions (narrow Disadvantaged pupils are those
(indicator A01b)
definition). Source: PHE, 2018/19 who have “ever been In Care, been
29
Life expectancy gap: Slope index via PHOF 2020 (C21) adopted or been eligible for free
of inequality, PHE, 2016-18, via 39 school meals at any point in the last
Teenage pregnancy: Rate of
PHOF 2020 (A02a) 6 years”
conceptions per 1,000 females aged
30
Healthy Life Expectancy: ONS 15-17, ONS 2018, via PHOF 2020 52
Progress 8 is a value added
2016-18, via PHOF 2020 (A01a) 40 measure which compares how well
Dementia: NHS Quality Outcomes
31
Under 75 mortality: Public Health a student does when compared to
Framework (QOF), 2018/19 via
England (based on ONS data), 2016- other pupils with the same prior
PHOF 2020
18, via PHOF 2020 (E04a, E05a, E06a attainment at the end of Key Stage
41
Suicide: Suicide rate per 100,000 2. Progress 8 national average is
& E07a)
persons, 2016-18 via PHOF 2019 always zero.
32
Depression: NHS Quality (4.10) 53
Outcomes Framework (QOF) GCSE “strong pass” = GCSE grade
42
Source for all “QoL 2019” is the 5 or above. Source: DfE GCSE
2018/19, via PHOF 2020.
2019 Bristol Quality of Life survey. performance tables, 2018/19
Results at www.bristol.gov.uk/qol https://www.gov.uk/key-stage-4
Definitions:
“Most deprived areas” are the 10%
a) Patients (18+) on Bristol CCG 54
Post 16 2019 results: https://
most deprived LSOAs within Bristol
GP registers recorded as having www.gov.uk/a-level
43
depression; all patients diagnosed LG Inform COVID-19 Tracker; 55
SEN: https://lginform.local.gov.
from April 2006 with an unresolved data updated 2 July 2020 to
uk/reports/view/send-research/
record of depression in their record. include results from both ‘pillar
local-area-send-report
b) Patients (18+) registered with 1’ (tests carried out in NHS and
depression for the first time. PHE laboratories) plus ‘pillar 2’
33 (testing by commercial partners)
Self harm: Hospital admissions
of the Government’s mass testing
due to self-harm in 10-24 year olds,
programme. Prior to July only ‘pillar
2018/19. Hospital Episode Statistics
State of Bristol: Key facts 2020
2017-18
(June
(Feb
2020)
2018) page 1356 66
Apprenticeships data: Affordable homes. BCC Strategic While there are many more factors
https://www.gov.uk/ City Planning Team, Mar 2020.. that influence affordability, the
government/statistical- Affordable housing is social rented, simple ratio provides an overview
data-sets/fe-data-library- affordable rented and intermediate of geographic differences across
apprenticeships#apprenticeship- housing, for eligible households England and Wales.
and-traineeships-annual-data whose needs are not met by the
57 market.
Apprenticeships data:
67
Transport
78
https://www.gov.uk/ BCC Housing Options 2020
government/statistical- 68
A Safe Systems Approach to Road
Sleeping rough figures based
data-sets/fe-data-library- Safety in Bristol. 2015
on a snapshot from a single
apprenticeships#apprenticeship- 79
Bristol Transport Strategy:
night. Source: https://www.
and-traineeships-annual-data https://www.bristol.gov.uk/
gov.uk/government/collections/
58
ONS Annual Population Survey homelessness-statistics#rough- policies-plans-strategies/bristol-
Jan-Dec 2019 sleeping%2069 transport-strategy80BCC Transport
https://www.nomisweb.co.uk/ Statistics
Homeless households. Duty to
81
59
Graduates: Higher Education house under section 184 of the ONS 2011 Census, 2015 Indices of
Statistics Agency 2020 Housing Act. Source: BCC Housing Multiple Deprivation
https://www.hesa.ac.uk/ Options, 2020. 82
ONS 2011 Census, via analysis
60
Higher Education. Source: Higher 70
BCC Housing Options 2019 by BCC Insight, Performance and
Education Funding Council for 71
Intelligence
St Mungo’s - Business Insight
England (2010-2014). 83
National Highways and Transport
Team
https://www.officeforstudents. survey 2019 – Bristol analysis
72
org.uk/data-and-analysis/young- BCC Housing Options 2020
84
Source for all “QoL 2019” is the
participation-by-area/get-the- 73
BCC Accessible Housing 2020
2019 Bristol Quality of Life survey.
data/ 74
Building Research Establishment Results at www.bristol.gov.uk/qol .
“Bristol South” is all areas south of “Most deprived areas” are the 10%
75
the river ONS UK House Price Index.
most deprived LSOAs within Bristol.
61 Contains HM Land Registry data ©
Neighbourhoods’ here are Middle 85
Super Output Areas (MSOAs). Three Crown copyright and database right Passenger Focus Survey 2019
MSOAs are in the 4 lowest for 2020. This data is licensed under 86
Bus passenger journeys:
England - Hartcliffe (7.5%) (lowest in the Open Government Licence v3.0.
https://www.gov.uk/government/
England), Withywood (10.5%) (3rd 76
lowest) and Highridge (10.7%, 4th ONS UK House Price Index. statistical-data-sets/bus01-local-
lowest). Contains HM Land Registry data © bus-passenger-journeys87Source for
Crown copyright and database right all points: ONS 2011 Census
2020. This data is licensed under
Housing
62 88
Department for Transport
the Open Government Licence v3.0.
63 Table CGN0501
Valuation Office Agency 77
Affordability ratio: ONS Ratio 89
September 2019 A&S road traffic statistics. Three
of house price to residence-based
64 month data lag – Data reported in
BCC Residential Development earnings By dividing the house price
2019/20 relates to Jan-Dec 19.
Survey, 2019. for a given area by its earnings, a
90
65 ratio is produced which serves as BCC Road Safety in Bristol: A 10
Local Plan:
an indicator of relative affordability. year plan 2015-2024
https://www.bristol.gov.uk/
planning-and-building-regulations/ A higher ratio indicates that on
local-plan average, it is less affordable for a
resident to purchase a house in
their local authority district.
State14
page of Bristol: Key facts 2017-18 (Feb 2018) State of Bristol: Key facts 2020 (June 2020)
page 14Sustainability &
91
Culture & creativity
104
Economy and
117
environment 105
Calculation based on Eurostat
employment
92 118
BCC – Energy Service. Carbon Cultural Statistical release 2019 GVA. Source: ONS inflation
emissions – Most of scopes 1 and 2, Source: BCC Culture & Creative adjusted gross value added
and parts of scope 3 are measured. Industries team (chained volume measures in 2016
93 106 pounds), Dec 2019 Nominal and
BCC – Energy service Premier Inn survey:
real regional gross value added
94 Artistic Cities
Electricity consumption: (balanced) by industry (Table 3b)
107
https://www.gov.uk/government/ Connecting Bristol September 119
Source: ONS Inflation adjusted
statistical-data-sets/regional- 2019: www.connectingbristol.org
gross value added (chained volume
and-local-authority-electricity- 108
Film & TV activity. Source Bristol measures in 2016 pounds) Dec-19
consumption-statistics
Film Office, 2020 Regional GVA (balanced) by CA,
95
DECC data 2005-2017 109 CRs, LEPs and other Ent Areas of the
Source for all “QoL 2019” is the
96
BCC – City Innovation and 2019 Bristol Quality of Life survey. UK (Table B2)
Sustainability Team Results at www.bristol.gov.uk/qol 120
GVA per head. Calculated
97 . “Most deprived areas” are the 10% using GVA from Table B2: EER
Air Pollution mortality: Health
most deprived LSOAs within Bristol. CVM pounds and working age
Impacts of Air Pollution in Bristol
report. Air Quality Consultants 110
Destination Bristol 2019 populations from: Regional
(2016). The report considered 111
GVA (balanced) local authorities
Destination Bristol 2019:
deaths attributed to exposure to by NUTS1 region - Population
https://visitbristol.co.uk/
both nitrogen dioxide (NO2) as well estimates by local authority
destinationbristol/about-us/about-
as fine particulate matter. 121
Source:
the-visitor-economy
98
Clean Streets strategy: https:// 112
Business demography, UK
Luxury Travel Guides Awards 2019
www.bristol.gov.uk/clean-streets- 122
https://www.nomisweb.co.uk/ -
113
campaign Bristol Airport: Press office
UK Business Counts - local units by
114
99
BCC – Waste strategic client BCC Culture: Transformation industry and employment size band
115 123
100
BCC – Waste strategic client Bristol Museums Impact Report https://www.nomisweb.co.uk/ -
116 Business Register and Employment
101
Source for all “QoL 2019” is the BCC Culture and Creative
Survey - Open Access Data
2019 Bristol Quality of Life survey. Industries
124
Results at www.bristol.gov.uk/qol . https://www.nomisweb.co.uk/
“Most deprived areas” are the 10% - Annual Population Survey
most deprived LSOAs within Bristol. 125
https://www.nomisweb.
102
Compare the market - UK’s co.uk/ - Model Based Estimates of
greenest cities and towns Unemployment
126
103
Source: Bristol City Council Changes in methodology and
Allotments, 2020 the benefits system mean that
the most recent data pertaining to
people claiming Universal Credit
who are unemployed are not
comparable with the historic data
sets https://www.nomisweb.co.uk/
- claimant count
State of Bristol: Key facts 2020
2017-18
(June
(Feb
2020)
2018) page 15Compiled by the Strategic Intelligence and Performance Team, Insight,
Performance and Intelligence Service, Bristol City Council.
www.bristol.gov.uk/statistics.
Documents available in other formats:
If you would like this information in another language, Braille,
audio tape, large print, easy English, BSL video or CD rom or plain
text please contact: research@bristol.gov.uk
or phone on 0117 922 2704
State of Bristol: Key facts 2017-18 (April 2018) page 16You can also read