BIRMINGHAM REPORT RESIDENTIAL RESEARCH - SPRING 2015
←
→
Page content transcription
If your browser does not render page correctly, please read the page content below
RESIDENTIAL RESEARCH

BIRMINGHAM
REPORT
SPRING 2015

ECONOMIC FUNDAMENTALS   THE “BUSINESS” CASE   HOUSING SUPPLY AND DEMAND
BUILDING THE FUTURE
The UK economy bounced back
FIGURE 2
strongly last year, delivering the
Annual economic output 2014
highest level of growth seen in
any country in the G8 nations. As
the Eurozone struggles with more
fiscal uncertainty, the UK is seeing
job creation and starting to see Birmingham
wage growth, all in an ultra-low
interest rate environment. £16.8bn
“Birmingham’s mix of
regeneration, re-development The country’s economic recovery from
the financial crisis and resulting recession
and job creation, as well as
has started to spread to the regions, and
Estonia
the relatively lower entry price
for property, means that its
Birmingham, the UK’s second-biggest city £16.1bn
draw to homebuyers and
by population, has contributed with
economic output from the city outpacing
Iceland
investors will likely continue to the average seen across the UK in both £9.8bn
grow in the coming years.” 2013 and 2014 (figure 1).
This is just one of the signs that
GRÁINNE GILMORE Birmingham is enjoying a post-recession Source: UN
Head of UK Residential Research
renaissance, not only in terms of jobs and
business growth, but also in the fabric of At present, the level of new residential
the city. The Big City Plan, laid out in 2010, stock coming to the market, especially in
aims to ease the stranglehold that the City Centre, is limited. Our analysis of
infrastructure such as key roads are future housing supply in Birmingham
placing around the city centre, thereby suggests that supply will pick up from
opening up large parts of the city. next year, but that there will still be a
notable annual shortfall in our forecast
The activity in Birmingham, in economic period to 2019 (figure 8).
terms as well as public realm planning, is
also helping feed the strong demand for Birmingham’s mix of regeneration,
housing, not only from the domestic re-development and job creation, as well
population within Birmingham, but also as the relatively lower entry price for
from those from London and the South property, means that its draw to
East looking to take advantage of the price homebuyers and investors is likely to
differential on offer. continue to grow in the coming years.
FIGURE 1 FIGURE 3
Total annual output (GVA) Birmingham: Output by industry
GVA, £bn
7%
UK
FORECAST
WEST MIDLANDS 5.0 FINANCE & INSURANCE
6% BIRMINGHAM PROFESSIONAL & OTHER PRIVATE SERVICES
4.5 PUBLIC SERVICES
5%
4.0
4% 3.5
£ billions
3% 3.0
2% 2.5
2.0
1%
1.5
0%
1.0
2000
2001
2002
2003
2004
2005
2006
2007
2008
2009
2010
2011
2012
2013
2014
2015
-1%
2010 2011 2012 2013 2014 2015 2016
Source: Experian Source: Experian
2BIRMINGHAM 2015 RESIDENTIAL RESEARCH
Economic Service industries outstripped that of its “Intense competition,
Public Sector by an estimated £133 million,
fundamentals contributing around £4.4bn to the city’s
big price tags and
In terms of economic growth, Birmingham
economy last year. In fact this segment of low yields in London
has outperformed the UK and the wider
the Birmingham economy has been the star are forcing investors,
performer since the recession, growing by
West Midlands region for the past two years.
nearly 30% since 2009 (figure 3).
both domestic and
Annual Gross Value Added, a measure of
economic activity, rose by 2.3% in 2013
international, to widen
Evidence of the sustained recovery in the
and 3.3% in 2014, compared with 1.8% private sector can also be seen by net their horizons. Turning
and 2.9% respectively across the UK. business creation data – in 2009 and 2010 their back on the capital
the city lost more businesses than it gained,
The pace of economic growth in Birmingham
but in 2013 over 1,600 more companies
for regional cities that
is expected to average a more moderate
2.1% per year over the next five years were created than folded and provisional offer less competition
outperforming the wider West Midlands figures for 2014 suggest a similarly large and higher returns,
net gain (figure 4).
average (figure 1). [in particular] well-run
With a Gross Value Added (GVA), a measure major cities with good
of economic output, in 2014 of nearly FIGURE 4
£16.8bn, Birmingham’s total is currently Birmingham: Net Business Creation local government;
comparable to that of Estonia, which had a
2009 - 2014 leadership is a key
total output of £16.1bn in 2013, and some 2,000 factor impacting
ESTIMATE
£7bn more than Iceland. business prospects.
Balance of businesses created and lost
Brimingham’s strong recovery from the 1,500
This includes cities
UK recession has seen employment rise
across the city over the last few years, once 1,000 such as Birmingham.”
again outperforming the UK and regional Source: PwC “Emerging
annual growth rates in 2013 and 2014. 500
Trends in Real Estate” –
Employment is set to continue to rise
0
Europe 2015
annually by an average of 1% across the
next five years.
-500
The surprise driver behind this economic
resurgence has been the private sector – -1,000
for the first time since 2001, the output from 2009 2010 2011 2012 2013 2014
Birmingham’s Professional & Other Private Source: ONS 2013 Business Demography
CASE STUDY: DEUTSCHE BANK IN BIRMINGHAM
are, yet our teams need to be able to travel those working here can have a higher
to and from there quickly if needed. standard of living than those on the
same salary in the capital.
Paul Anderson “Birmingham was an easy choice when it
Head of Deutsche Bank came to picking a location outside “In terms of the lifestyle they
Birmingham London. The key factor is the labour can enjoy, the city is almost
market here, there’s a highly qualified unrecognisable compared to 15
Deutsche Bank has expanded its talent base – with skills that are highly years ago, it is a lively and exciting
presence in Birmingham, with front transferable. We have been able to recruit place to be. Alternatively, our staff
and back office staff all based in the highest calibre teams for compliance, can choose to live in the countryside,
Brindleyplace in the business district. technology and professional services. and still be within a reasonable
Paul Anderson, Head of Deutsche “For our graduate scheme we have commute of the office.
Bank Birmingham, shares the reasons access to many smart young graduates “We can’t discount the proximity to
behind the bank’s move, and explains from the major universities in the area. London however, and our staff can
the attraction of Birmingham for a We find that these graduates value the
be there within two hours, and
large banking business. opportunity to have a banking career
travelling there and back in a day is
without having to move to London.
“We have many roles within the Bank not arduous. We are very pleased
which do not need to be based in “The disparity in the cost of living between with our choice of Birmingham as
London, where our UK headquarters London and Birmingham means that a location.”
3FIGURE 5 Changing face of Birmingham City Centre
Private sector investment in the city is There was particularly strong occupier
FIGURE 6
becoming mainstream, with a report on activity in Birmingham city centre in
Birmingham office take-up, by
emerging trends in real estate, from PwC, the second half of last year, with take-up
sector H2 2014
ranking the city the 6th best in Europe for in Q4 alone totalling 341,164 sq ft, more
investment, four places above London, than doubling the preceding three quarters
16%
and 7th for development. (figure 7).
16 There are increasing numbers of examples Total take-up for 2014 was 713,460 sq ft,
%
of corporate investment in the city. up 7% year-on-year. Activity in
1 0% Deutsche Bank made a landmark decision these markets is being driven by the
in 2013 to further expand their operations public sector, professional services and
in Birmingham renting an additional banking & insurance sectors, which
4% building on Brindleyplace and relocating accounted for 72% of total activity in the
around 2,000 staff from London to create a second half of 2014.
3% ‘HQ Campus’ (interview page 3).
45% 3% More recently HS2 Ltd, the vehicle behind
The buoyancy of the office market, as well
as the investment confidence in
the construction of the new high-speed
2% Birmingham is perhaps captured by the
1% rail line between London and Birmingham fact that construction work has begun on
and the North of England, rented nearly
PUBLIC SECTOR
Birmingham’s most anticipated new
100,000 sq ft of office space. The decision
PROFESSIONAL SERVICES commercial development scheme – the
FINANCE / BANKING to base the headquarters of HS2 in
transformation of 17 acres at Paradise
TMT Birmingham marks a further vote of
CHARITIES Circus in the heart of the city centre.
confidence in the city.
CONSTRUCTION / ENGINEERING
RETAIL / DISTRIBUTION The £500m scheme is aimed at revitalising
OTHER
PHARMA / HEALTHCARE The “Business” Case this part of Birmingham; creating a
substantial number of jobs, office and retail
The strength of Birmingham’s economy is space and helping to attract significant
Source: Knight Frank Research echoed in the activity in its office market. commercial investment.
4BIRMINGHAM 2015 RESIDENTIAL RESEARCH
Infrastructure boost connections at the heart of the city will play
a key part in providing a long-term boost to
FIGURE 7
Sharp rise in Birmingham office
Birmingham is well positioned to attract residents and business alike.
take-up By grade (sq ft)
further investment – with the 20-year ‘Big
Opening up the city centre will bring
City Plan’ launched in 2010 aiming to
improved pedestrian and Metro access 350,000
completely revitalise and expand the city GRADE A
to the central business and retail GRADE B
centre. The plan aims to deliver change in GRADE C
districts, particularly from the Jewellery 300,000
the city centre, by breaking up the restrictive
Quarter – the city’s most vibrant
post-war urban environment, such as major
residential neighbourhood. 250,000
roads cutting through residential and
commercial areas. This will expand the city Recent residential development has focused
200,000
centre by 25% to cover 800 hectares, on rejuvenating the canalside area to the
including far-reaching improvements to the South West of the city Centre. The catalyst 10 year
average
150,000
urban environment and connectivity. for regeneration in this area began with the
Mailbox development which was completed
Key infrastructure and transport projects 100,000
in the early 2000s. More recently, The Cube
have been adding to this sense of
is the most notable residential scheme of
revitalisation and transformation. 50,000
the past five years. However focus is now
Increased connectivity is therefore at the switching to the opportunities offered by
0
centre of the plans for Birmingham’s future the Jewellery Quarter, with a number of Q2-Q4 Q1-Q4 Q1-Q4 Q1-Q4
2011 2012 2013 2014
– better links nationally, regionally and new developments and Victorian
internationally. The improved local warehouse refurbishments in the pipeline. Source: Knight Frank Research
Better connections for Birmingham
• B
irmingham International Airport offers direct access to over 100 destinations and is only
a 9 minute train journey from the city centre. However the creation of a £40 million runway
extension last year created the potential for expanding the list of long-haul destinations.
Birmingham now hosts the only direct UK to China air route outside London.
• American Airlines also announced new direct flights from New York to Birmingham would
begin in May 2015 – a decision which may be partly based on the West Midland region
having the largest trade surplus with North America of any UK region, thanks in part to
AIRPORT global brands such as JLR, JCB, Cadbury and Kraft trading both locally and in the US.
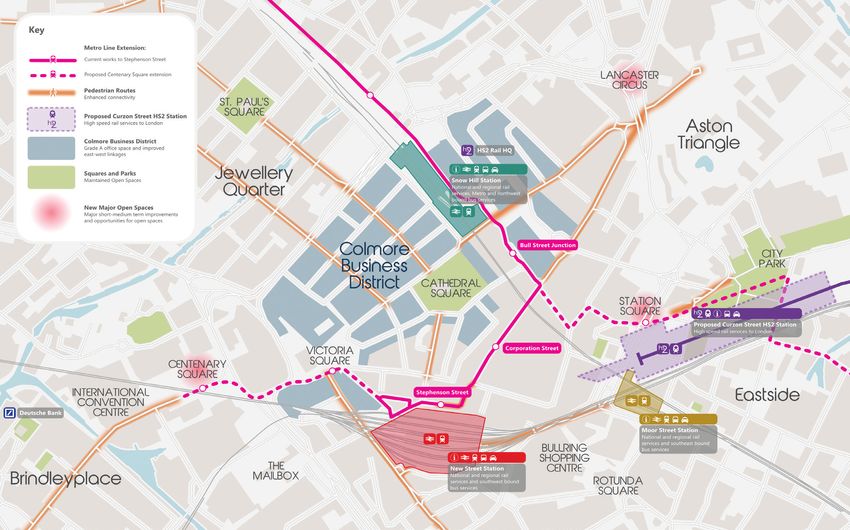
• A key plank of the long term vision of Sir Albert Bore, head of Birmingham City Council, has
been to open up the city centre and break the ‘concrete collar’ imposed on the central
business district by the 1960’s Queensway ring roads. Phase One of the extension will
extend the current Metro Line from its current terminus at Snow Hill station to Birmingham
New Street by the end of 2015 (see map). Funding for a further phase to extend the line to
Centenary Square to tie in with the Paradise Circus re-development has also been
approved with the long-term goal being for the route to run to Five Ways and/or Edgbaston.
METRO LINE • A further Metro extension eastwards to the future HS2 station at Curzon Street and
EXTENSION beyond, ultimately to Birmingham Airport and perhaps even Coventry is also in the pipeline,
with the Curzon Street extension slated for completion by around 2020.
• This high speed rail link will cut the travel time between London and Birmingham from 1hr
21 minutes to 49 minutes. Phase 1 will connect London and Birmingham, as well as going
slightly further north to Hansacre, while Phase 2 will have two “legs” going further north,
one to Manchester and one to Leeds via Nottingham and Sheffield. The construction of the
line alone, with the rail links and infrastructure around it, could create 22,000 jobs in the
West Midlands and further Birmingham’s position as the regional hub for the heart of
England. The HS2 Paving Act, authorising expenditure in preparation for the creation of the
new rail network, received Royal Asset in November 2014. A final decision on the exact
route is expected after the General Election in 2015 with the HS2 Hybrid Bill, currently at
the Commons Select Committee stage, following soon after.
• According to a KMPG / DfT 2013 Regional Impact Study, the West Midlands metropolitan
region stands to see direct productivity gains valued at between £1.5 billion and £3.1 billion
per year; equivalent to between a 2.1% and 4.2% increase in total local economic output
HS2 once HS2 is ready in 2037.
5Housing demand The shortage of stock in the city has been
BIRMINGHAM
reflected in price growth in recent years,
and supply especially as buyer confidence and
Population projections from the ONS interest started to rise in the wake of the
Education suggest that Birmingham will see organic financial crisis. Average residential
Birmingham is home to five
population growth of 3.6% between 2015 property prices rose by 7% between the
universities and over 50,000 undergraduate
and 2020; equating to just under 40,000 beginning of 2013 and the end of last
students, of which more than 6,000 are
from overseas. Two of its schools are new residents over the next five years. year according to the latest data from the
ranked among the top 15 in the country Birmingham is forecast to see a growth in Land Registry.
in terms of A-Level results. Some 38 the number of households from 422,022 in
secondary schools in the city are classed The competition to live in the centre of
2014 to 440,529 by 2019 – a rise of around town, coupled with a lack of stock
as “Outstanding” by Ofsted.
18,500 households. This equates to an availability due to lack of development
Culture average annual increase of approx. 3,680
households each year.
activity in the wake of the downturn, is
Birmingham Hippodrome is the most also reflected in rental prices, with
popular theatre in the UK with over 520,000 By looking at all the current residential average rents carrying a premium, as
visitors every year. The city also has more planning consents across Birmingham, shown in figure 11.
than 500,000 works of art in one square mile using construction timing estimates
with Birmingham Museum & Art Gallery This chimes with the findings of our
provided by Glenigan, together with the
home to the world’s largest Pre-Raphaelite Tenant Survey, the largest survey of
assumptions that; all sites with planning
collection, including some 2000 art works. its kind ever conducted in the UK.
consent as at February 2015 will be
Its music and event venues such as the
realised; that the units are made available We asked 3,000 tenants across the UK
National Indoor Arena, LG Arena and
for sale halfway through the construction about their choices when deciding on a
Symphony Hall are also world-class.
process, and; an average monthly sales rental property.
Birmingham has the most Michelin starred
restaurants of any city in the UK outside
rate of 3.5% across each site, we have
It showed that while affordability was the
London, with four restaurants boasting attempted to illustrate the annual supply
key priority, proximity to transport and
1 star. of new homes versus the predicted
place of work was particularly important
growth in households.
to younger tenants. In fact, the results
Recreation We must note that it is hard to second- showed that this was particularly true for
The city is in the top three most guess the details how and when the West Midlands.
visited places to shop in the UK. The Bullring
developers will choose to bring forward
shopping centre alone is the size of 26 Some 40% of those living in the West
their schemes, which can affect supply
football pitches. Over 400 specialist Midlands said they would choose a
timings. However, our forecast shows that
businesses in the 250 year old Jewellery
across Birmingham as a whole, the studio flat if the rent was affordable and if
Quarter are responsible for manufacturing
around 40% of the UK’s jewellery. expected supply of new homes is set to it was located in a “perfect” central
fall short of the potential growth in location, this is higher than the wider
Birmingham is also one of the greenest cities
in the UK with around 600 designated parks households by an average of nearly 2,000 country average of 36%. This rises to
and open spaces, including the Botanical a year between 2015 and 2019. 42% for those aged 35 to 44.
Gardens in Edgbaston that first opened in
1832. Famously the city also has more miles
of canal than Venice. FIGURE 9 Estimated supply/demand dynamic
2015 – 2019 Birmingham Housing Supply vs Demand
FIGURE 8
Birmingham residential sales
volumes Monthly Sales 2007-2014
DEMAND
4,000
2,000 3,500 AVERAGE ANNUAL FORECAST DEMAND
ANNUAL HOUSEHOLD GROWTH
3,000
ANNUAL ESTIMATED SUPPLY TO MARKET
1,500
2,500
AVERAGE ANNUAL
2,000 FORECAST SUPPLY
1,000 To
SUPPLY
1,500
500 1,000
500
0 0
2007 2008 2009 2010 2011 2012 2013 2014 2015 2016 2017 2018
Source: ONS 2011-based Subnational Household Growth Projections, Glenigan, Knight Frank Residential Research
Source: Land Registry
FORECAST
6BIRMINGHAM 2015 RESIDENTIAL RESEARCH
FIGURE 10 PRS: Tenant priorities – West Midlands
100%
ALL
90%
25-34
80% 35-44
70%
60%
“The Birmingham residential
50% market has matured over
40% the last eight years. As a
30%
consequence buyer profiles and
requirements have changed
20%
significantly from the ‘peak’ of
10% the market in 2007. We are
0%
seeing a trend with buyers
looking for better and larger
Affordability Close to Close to Close to Close to Close to Close space with more emphasis on
work/ shops transport friends and amenities to good quality, rather than being driven
university links family (cafes, gym etc) schools
purely by capital values.
Source: Knight Frank Residential Research
“This transformation has
gathered pace over the last
Average prices in Birmingham’s As of December 2014 (latest figures)
18 months, and is directly
residential market last peaked in July 2007 Birmingham was the local authority with
a month that saw over 1,800 transactions the sixth highest number of completed
linked to the improvement
totalling nearly £306m worth of property, equity loans under the Help-to-Buy
of infrastructure in the city
equating to an average sale price of Scheme that began in October 2013, alongside the relocation to
90%
ALL the city of businesses such as
87%
£167,607. Sales volumes hit a low in early which may have partly helped to
82%
25-34 Deutsche Bank.
2009, in the aftermath of the financial re-energise the local market in the last
35-44
crisis, with the average sale price 18 months. “Demand has grown at a time
63%
dropping to its lowest point a few months
61%
Our forecasts suggest a further 17% when supply is restricted.
55%
later in May. Volumes plateaued for the The traditional market of buy-
51%
50%
growth in prices between 2015 and
48%
50%
47%
following two years, but have started to
46%
46%
46%
2019 in the West Midlands, and we to-let investors has expanded
39%
pick up since mid-2013. Recently the
38%
to include owner-occupiers,
37%
acknowledge the potential for
33%
average sale price passed the previous
outperformance in some local markets, including many professionals
26%
2007 peak, with the pace of growth
20%
for example central Birmingham. working in the city, as well
19%
outperforming that in the West Midlands.
as homeowners looking to
downsize. We have also
FIGURE 11 FIGURE 12 seen the arrival of students
Affordability Close to Close to Close to Close to Close to Close
PRS: Average weekly
work/ asking rents transportPrice
shops change
friends and amenities to good from overseas who have
Birmingham, 2014 university links Jan 2013
family
= 100 (cafes, gym etc) schools shown a preference
for living in high-quality
£350 BIRMINGHAM 115
BIRMINGHAM INDEX residential developments.
CITY CENTRE ENGLAND & WALES INDEX
£300
(B1,B2,B3 & B4)
WEST MIDLANDS INDEX, SA “There will be challenges around
stepping up delivery of new
100% 110
homes, especially in central
Average weekly asking rent: 2014
£250 ALL
90%
25-34 Birmingham in the coming
80%
£200 35-44 years, so we expect price
70%
105 growth in this market to be
£150 underpinned by that supply and
60%
demand imbalance.”
50%
£100
100
40% MARK EVANS
£50 Head of Regional New Homes
30% Sales, Knight Frank Birmingham
20%£0 95
Studio 1-bed 2-bed 3-bed 2013 2014
10%
Source: Knight Frank Residential Research, Zoopla Source: Knight Frank Research
0%
Affordability Close to Close to Close to Close to Close to Close
work/ shops transport friends and amenities to good 7
university links family (cafes, gym etc) schoolsGLOBAL BRIEFING
For the latest news, views and analysis
on the world of prime property, visit
KnightFrankblog.com/global-briefing
RESIDENTIAL RESEARCH
Liam Bailey
Global Head of Research
+44 20 7861 5133
liam.bailey@knightfrank.com
Gráinne Gilmore
Head of UK Residential Research
+44 20 7861 5102
grainne.gilmore@knightfrank.com
RESIDENTIAL DEVELOPMENT
Mark Evans
Head of Regional New Homes Sales
+44 12 1233 6410
mark.evans@knightfrank.com
David Fenton
Head of Regional Land
+44 78 3658 7931
david.fenton@knightfrank.com
Andrew Davis
Head of Regional Residential Valuations
+44 12 1233 6432
andrew.davis@knightfrank.com
Lucy Jones
Head of Investment Lettings and
Management
+44 20 7861 1264
lucy.jones@knightfrank.com
Knight Frank Residential Research provides
strategic advice, consultancy services and
forecasting to a wide range of clients worldwide
Front cover provided by Chatham Billingham (P&M) Ltd including developers, investors, funding
organisations, corporate institutions and the
public sector. All our clients recognise the need
for expert independent advice customised to
their specific needs.
RECENT MARKET-LEADING RESEARCH PUBLICATIONS
RESIDENTIAL RESEARCH
RESIDENTIAL RESEARCH PRIME COUNTRY
HOUSE INDEX
UK RESIDENTIAL
PRIME COUNTRY HOUSE PRICES
CLIMB 3.4% IN 2014
FORECAST &
Prime country house prices rose for an eighth consecutive quarter
between October and December, the longest run of uninterrupted price
growth since 2007. Oliver Knight examines the latest figures.
RISK MONITOR
Results for Q4 2014 Price growth in the prime country house
market lost some of its momentum in the
activity in early December as prime
property buyers looked to move ahead
Prime country house prices increased latter half of 2014, with property values of the rate change. Under the new rules,
by 0.2% in the final quarter of the year, increasing by just 0.5% during the second buyers of homes valued at more than
PRE-ELECTION EDITION after a 0.3% rise in Q3 half of the year. This compares to growth of
nearly 3% over the first six months of 2014.
£937,500 face higher stamp duty charges.
FEBRUARY 2015 Annual growth for 2014 was 3.4%, The annual change in prime property prices
As a result, December 3rd, the day prior to
the new rules coming into force, was the
in line with our forecast for a 3.5% in 2014 was 3.4%, in line with our forecast busiest day of 2014 for the prime country
for the year. The countdown to the 2015 market in terms of transactions levels.
increase in prices over the course of
general election, tighter mortgage lending
the year It is possible that the prime sector of the
and the prospect of an interest rate rise, all
contributed to slower price growth in the market may take some time to absorb the
second half. changes as a result of the higher upfront
The number of prime country house
cost of moving, with harder negotiations
sales in 2014 was 3% higher than More restrained price growth in recent between buyers and vendors likely.
in 2013 months reflects what has happened in the
mainstream market, with the Nationwide Prime country house prices are still trading
House Price Index having eased for the at a large ‘relative’ discount to prices in the
Prime country house prices are forecast capital having experienced several years
fourth consecutive month in December.
to increase by 2% in 2015 of static or modest growth since the end of
Any slowdown in the wider market is likely
to have an impact on buyer sentiment in the financial crisis and prime prices remain
the prime markets. 16% below the previous market peak.
In spite of more moderate prices rises, As figure 2 shows, price performance is
market activity has remained robust. increasingly dependent on property type.
The number of prime country house sales While the average cottage increased in
© Knight Frank LLP 2015
completed by Knight Frank in 2014 was value by 6.8% in 2014, manor houses rose
3% higher than the previous year and 24% by just 1.4%.
higher than in 2012, indicating that demand
We are forecasting average price
remains strong.
growth of 2% across the prime country
Reforms to stamp duty, announced by market in 2015, but do not rule out some
Chancellor George Osborne during the areas of outperformance, especially in
Autumn Statement, sparked a flurry of key commuter towns.
This report is published for general information
FIGURE 1 FIGURE 2
Quarterly and annual prime Prime country: Annual price change
country price growth by property type
6%
KEY HOUSING OLIVER KNIGHT 4%
Residential Research
POLITICIANS SHARE
only and not to be relied upon in any way.
2%
THEIR PLEDGES WITH “The 0.2% price increase took
KNIGHT FRANK the annual change in prime 0%
property prices in 2014 to
3.4%, in line with our forecast -2%
for the year.”
-4% QUARTERLY
Follow Oliver at @oliverknightkf 1.4%
Although high standards have been used in
ANNUAL
For the latest news, views and analysis -6%
6.8% 3.4% MANOR
Q4 Q1 Q2 Q3 Q4 Q1 Q2 Q3 Q4 COTTAGE FARMHOUSE HOUSE
on the world of prime property, visit 2012 2013 2014
HOUSING POLICY UK AND REGIONAL COMPREHENSIVE DATA Global Briefing or @kfglobalbrief Source: Knight Frank Residential Research Source: Knight Frank Residential Research
ROUND-UP PRICE FORECASTS AND COMMENTARY
The Wealth Report The Private Rented UK Housing Market Prime Country House the preparation of the information, analysis,
2015 Sector 2014 Forecast Q1 2015 Index Q4 2014 views and projections presented in this report,
no responsibility or liability whatsoever can be
accepted by Knight Frank LLP for any loss or
damage resultant from any use of, reliance on
RESIDENTIAL RESEARCH
RESIDENTIAL RESEARCH RESIDENTIAL RESEARCH
RESIDENTIAL DEVELOPMENT
LAND INDEX
or reference to the contents of this document.
Knight Frank/Markit House Price Sentiment Index (HPSI) – January 2015
Household sentiment on current and future house prices moderates
GREENFIELD LAND PRICES RISE
BUILDING Key headlines for January 2015 had risen over the last month, while 3.1% reported a 2.3% IN 2014
UK TENANT
Households in all regions covered by our fall. This gave the HPSI a reading of 58.2 (see figure
As a general report, this material does not
1), the twenty-second consecutive month that the The growth in land values moderated across England and Wales in the
sentiment index perceive that prices rose in
MOMENTUM
reading has been above 50. final quarter of 2014, reflecting the movement in the wider housing market.
January
However residential development land values in prime central London
SURVEY 2014
Any figure over 50 indicates that prices are continued their strong growth, ending the year up 24%. Gráinne Gilmore
Expectations for future price growth fell back examines the latest market trends.
across the UK in January, and are well below rising, and the higher the figure, the steeper the
HOUSEBUILDING REPORT 2014 last May’s record-high
increase. Any figure below 50 indicates that
prices are falling. Key facts Q4 2014 Greenfield residential development land turn, has started to weigh on pricing as
necessarily represent the view of Knight Frank
values remained broadly static in the final while there is still sturdy competition for
PRIVATE RENTED SECTOR RESEARCH Londoners expectations for house price
growth over the next 12 months rose in
The HPSI was on a general downward trend for
Average greenfield residential
development land prices up 2.3% in
quarter of 2014, rising by just 0.1%.
This took the annual rate of growth to
good sites, it is less fierce.
Another factor weighing on greenfield land
most of the second half of 2014 (figure 1). January’s 2014, after a 5.3% rise in 2013 2.3%, well under the 7.2% rate of growth prices is the increasing cost of labour and
January reading of 58.2, the lowest in 14 months, was a seen in house prices. However it is likely materials. The industry is still gearing up
continuation of this trend and well below the land price growth will remain subdued after the recession, and recruitment of
Some 5.9% of UK households plan to buy a Prices rose by 0.1% in Q4, the most over the coming year as rising costs
average reading for last year of 61.0. modest growth since Q4 2012
new tradesmen is proving problematic in
LLP in relation to particular properties or
property in the next 12 months press on margins. many areas. It is no coincidence that the
cost of building in the UK has risen up the
In spite of the month-on-month fall, households in Activity in the land market has certainly
Land values in prime central London international rankings. It is now the 8th
Change in current house prices all 11 regions covered by the index reported that picked up over the last 12-18 months
climbed by 6.4% in Q4 2014, taking most expensive country in which to build,
Households perceive that the value of their home prices rose in January, led by Londoners (65.3) and – this is reflected in 17% rise in private
from 43 countries surveyed, according
the annual rise to 24% units under construction across the UK in
rose in January, according to the House Price households in the South East (63.0). Meanwhile, to Arcadis, the design consultancy firm –
December 2014 compared to December
Sentiment Index (HPSI) from Knight Frank and households in the North West (53.0) and Wales although the relative strength of sterling to
Land prices in prime central London 2013. There has been an increase in activity
Markit Economics. (53.9) perceived the slowest rates of price growth the Euro this year has also played a part in
projects. Reproduction of this report in whole
up 48% since September 2011 in most regions, as shown in figure 2. The
over the course of the month. this calculation.
demand for new housing is also robust
Some 19.5% of the 1,500 households surveyed across most parts of the country, with the
across the UK said that the value of their home take-up of the Government’s Help to Buy FIGURE 2
Equity Loan scheme rising to 38,052 in the Change in number of residential
20 months to November 2014, with some units on site (under construction)
83% of these being first-time buyers. December 2014 v December 2013
Fig 1: Change in current and future value of property (HPSI)
or in part is not allowed without prior written
The supply of land has also risen, with the
activities of land promoters helping boost
the pipeline of oven-ready sites. This, in
FIGURE 1
Development land values
Quarterly changes, Sep 2012 - Dec 2014
approval of Knight Frank LLP to the form
8% PCL
ENGLAND AND WALES
7%
GRÁINNE GILMORE
UK EY
Head of UK Residential Research 6%
14
20 SURV
5%
“Price growth for residential
SIVE DER
4%
development sites is likely
and content within which it appears. Knight
CLU IL S
EX SEBU SULT
to be more subdued over 3%
the coming year as rising
U RE
2%
HO construction costs press 1%
on margins.” 0%
Follow Gráinne at @ggilmorekf
-1%
Sep-12
Dec-12
Mar-13
Jun-13
Sep-13
Dec-13
Mar-14
Jun-14
Sep-14
Dec-14
Frank LLP is a limited liability partnership
For the latest news, views and analysis
on the world of prime property, visit
OUTLOOK HELP TO BUY – DEVELOPMENT WHERE ARE THE IDEAL
WHAT TENANTS WANT AFFORDABILITY VS LOCATION NB: A score of 50 equates to no change, above or below representing growth or decline respectively.
Global Briefing or @kfglobalbrief Source: Knight Frank Residential Research Source: Knight Frank Residential Research, Glenigan
FOR HOUSING DETAILED ANALYSIS ECONOMICS RENTAL PROPERTIES?
Housebuilding UK Tenant Survey House Price Sentiment Residential Development registered in England with registered number
Report 2014 2014 Index (HPSI) - Jan 2015 Land Index - Q4 2014 OC305934. Our registered office is 55 Baker
Street, London, W1U 8AN, where you may
Knight Frank Research Reports are available at KnightFrank.com/Research look at a list of members’ names.You can also read


