Doncaster Hill - Development Opportunities and Constraints
←
→
Page content transcription
If your browser does not render page correctly, please read the page content below
Doncaster Hill – Development Opportunities and Constraints
                                                                                Final Draft Report

      DoncasterPREPARED
                Hill –FOR Development
                           THE LOCAL GOVERNMENT ASSOCIATION OF
               SOUTH AUSTRALIA

      Opportunities and Constraints

      Prepared for
      Manningham City Council

      MacroPlan Australia Pty Ltd
      July 2010

      FINAL REPORT

Prepared for Manningham City Council                                                                         1
MacroPlan Australia Pty Ltd
June 2010                                                         MACROPLAN AUSTRALIA PTY LTD
                                                                     SYDNEY | MELBOURNE | BRISBANE | PERTH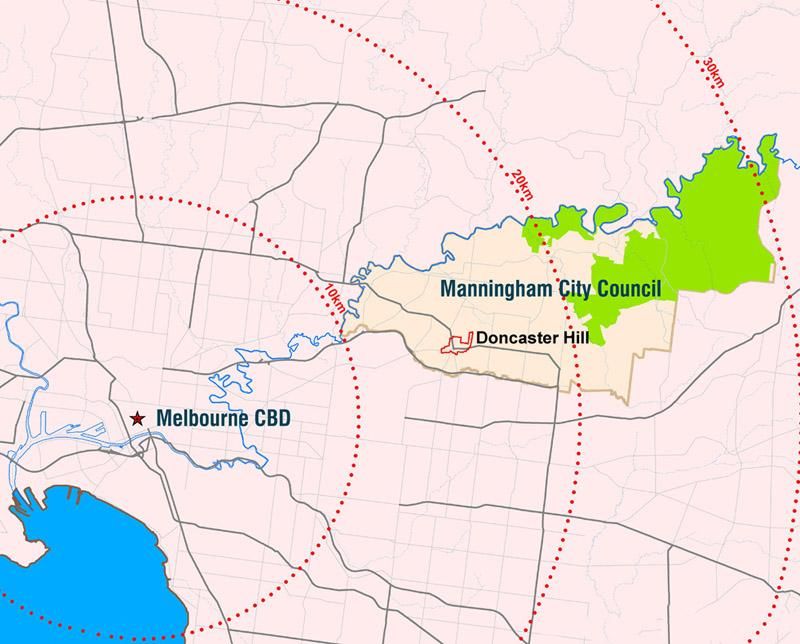
Doncaster Hill – Development Opportunities and Constraints
                                                                                                              Final Draft Report

        Project Manager
        Wayne Gersbach
        Manager
        Development Facilitation & Strategy

        CONTACT                                        Signed*
        MacroPlan Australia Pty Ltd
        Level 4, 356 Collins Street,
        Melbourne, Vic. 3000
        t 03 9600 0500
        f 03 9600 1477

        info@macroplan.com.au                          …………………………………
                                                       * This document is for discussion purposes only unless signed
                                                       and dated by the persons identified.
        www.macroplan.com.au
                                                       DATE: …………………….………2009

        © MacroPlan Australia Pty Ltd

        All Rights Reserved. No part of this document may be reproduced, transmitted, stored in a retrieval system, or translated
        into any language in any form by any means without the written permission of MacroPlan Australia Pty Ltd.
        All Rights Reserved. All methods, processes, commercial proposals and other contents described in this document are the
        confidential intellectual property of MacroPlan Australia Pty Ltd and may not be used or disclosed to any party without the
        written permission of MacroPlan Australia Pty Ltd

Prepared for Manningham City Council                                                                                                  2
MacroPlan   AustraliaAUSTRALIA
       MACROPLAN        Pty Ltd PTY LTD
June 2010
       SYDNEY | MELBOURNE | BRISBANE | PERTH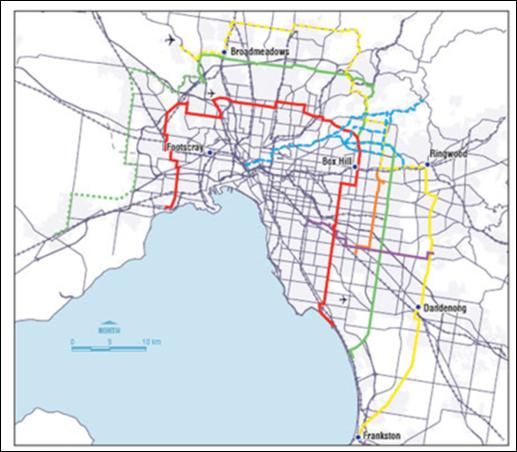
Doncaster Hill – Development Opportunities and Constraints
                                                                                                            Final Draft Report

Contents

1               EXECUTIVE SUMMARY ................................................................................. 4
2               INTRODUCTION ............................................................................................ 5
2.1             PROJECT BACKGROUND AND CONTEXT .........................................................................5
3               THE PROPERTY MARKET............................................................................. 7
3.1             MELBOURNE AND MANNINGHAM – POPULATION GROWTH...............................................7
3.2             MELBOURNE AND MANNINGHAM – HOUSE PRICE GROWTH ...........................................11
3.3             WHERE IN THE CYCLE ARE WE? ...................................................................................13
3.4             THE MANNINGHAM MARKET........................................................................................14
4               FUTURE DONCASTER ................................................................................ 19
4.1             THE DONCASTER HILL PRECINCT UPDATE ....................................................................19
4.2             THE PROPERTY DEVELOPMENT EQUATION FOR DONCASTER..........................................21
4.3             FLOOR SPACE DEMAND AND REQUIREMENTS FOR DONCASTER HILL ...............................24
5               THE NEW DONCASTER HILL VALUE EQUATION ...................................... 26
5.1             THE OUTLOOK FOR DONCASTER HILL ..........................................................................26
5.2             NEW COMPETITIVE POSITION VIZ A VIZ OTHER LOCATIONS .............................................30

Prepared for Manningham City Council                                                                                               3
MacroPlan Australia Pty Ltd
June 2010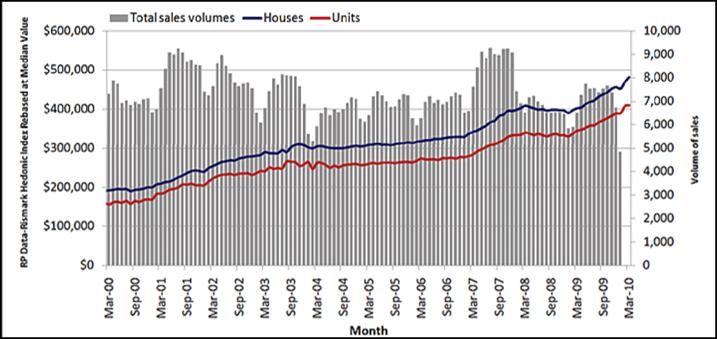
Doncaster Hill – Development Opportunities and Constraints
Final Draft Report
1 Executive Summary
Doncaster Hill is uniquely positioned in the Melbourne property market. It is:
Approximately 15 kilometres from the Melbourne CBD;
Growing at faster rate than metropolitan Melbourne; and
Identified as a Principal Activity Centre with high levels of accessibility and amenity.
Several recent development projects have occurred in Doncaster, including:
A $650 million redevelopment of the Westfield shopping centre – establishing it as a
flagship centre in Australia and expanding its market catchment draw;
The current construction of 205 apartments, with another 1,206 proposed;
A five-star $45 million hotel development (Crowne Plaza); and
A $38 million Civic Precinct Community Centre building in addition to other retail and
restaurant facilities.
Recently a property developer paid just shy of $2,000/m² for an 8,400m² bulky goods complex at
602-630 Doncaster Road (presently occupied by Officeworks and Autobarn). The site is to be
rebuilt as a $100m mixed-use village of shops, offices and apartments. Other developments are
progressing on the basis of strong pre-commitments being obtained.
Notwithstanding, there remains significant development opportunity at Doncaster Hill.
MacroPlan estimates that over 50 % of the centre’s development potential is yet to be reached.
Doncaster Hill’s primary planning document, the Doncaster Strategy, adopted in 2002, envisages
a vibrant mixed use activity centre. The strategy, and property development generally, has been
affected by recent global events. These events drastically altered property lending conditions and
development yields. Such conditions have only just begun to revert to ‘normal’ with underlying
land values on the mend, with banks beginning to unfreeze their credit policies and as property
portfolios begin to regain some of the gloss lost to share markets.
In MacroPlan’s opinion there remains significant underlying demand for the type of high-density
mixed use development envisaged by the Doncaster Hill Strategy. This demand will continue to
grow with population changes and the return of more favourable property investment
conditions.
Having out-lasted the ill effects of the global financial crisis the Strategy for Doncaster is now well
placed to attract market interest. The property fundamentals of Manningham / Doncaster as an
investment location remain strong – it has a growing population, increasing underlying land
values, distinctive locational advantages and a solid critical development mass to build from.
With these credentials MacroPlan believes that Doncaster will, particularly over the next decade,
develop into the vibrant urban community envisaged by its Strategy.
Prepared for Manningham City Council 4
MacroPlan Australia Pty Ltd
June 2010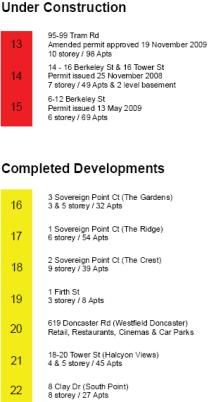
Doncaster Hill – Development Opportunities and Constraints
                                                                                                 Final Draft Report

2      Introduction
       MacroPlan has been commissioned by the Manningham City Council to provide a commentary
       with respect to the opportunities and constraints for property development at Doncaster Hill.

       Our report provides an up-to-date assessment of the changing socio-demographic profile of
       Doncaster, current house price trends and other economic trends and drivers relevant to
       Manningham and Doncaster.

       Our report confirms the potential to create a ‘state of the art’, contemporary, sustainable, high
       density mixed use village at Doncaster that enhances the social, environmental, economic and
       cultural characteristics of the centre.

            Figure 1.         Doncaster – Location and Metropolitan Setting

       Source: Manningham City Council (2010)

    2.1 Project Background and Context
       In 2004 Manningham City Council engaged MacroPlan to assess development opportunities and
       potential constraints at Doncaster Hill, with particular reference to Council’s Doncaster Hill
       Strategy.

     Prepared for Manningham City Council                                                                        5
     MacroPlan Australia Pty Ltd
     June 2010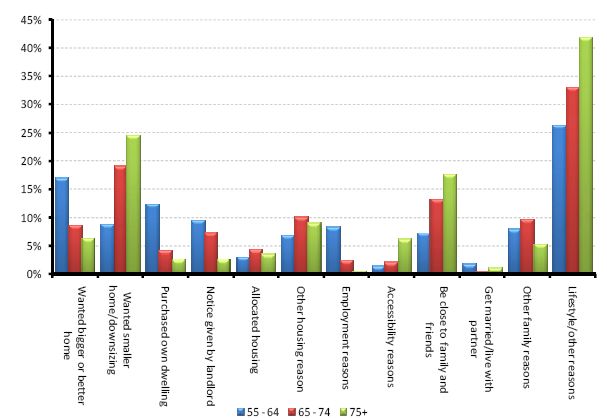
Doncaster Hill – Development Opportunities and Constraints
                                                                                          Final Draft Report

  The document examined the state of the property market, the impact of building cost increases
  and changing demographics and how these impacted upon the future development of the
  precinct.

  This report builds upon the previous 2004 work and presents information in a similar manner.

Prepared for Manningham City Council                                                                      6
MacroPlan Australia Pty Ltd
June 2010
Doncaster Hill – Development Opportunities and Constraints
Final Draft Report
3 The Property Market
3.1 Melbourne and Manningham – Population Growth
Between 2001 and 2009 Victoria grew by 640,000 people to reach a total population of
approximately 5.4 million, with greater Melbourne reaching a population of approximately 4
million.
Figure 2. Population Growth in Victoria and Melbourne
8,000,000
7,000,000
6,000,000
5,000,000
4,000,000
3,000,000
2,000,000
1,000,000
0
2001
2002
2003
2004
2005
2006
2007
2008
2009
2010
2011
2012
2013
2014
2015
2016
2017
2018
2019
2020
2021
2022
2023
2024
2025
2026
Melbourne Rest of Victoria
Source: ABS Regional Population Growth (Cat. NO. 3218.0, 2010); Victoria in Future (2009); MacroPlan Australia
(2010).
Current population growth is summarised as:
Victoria’s population is presently 5,473,300 (Sept 2009 ERP), an increase of 30,000 (0.6%)
since the June quarter
Over the same quarter, Australia's ERP grew by 110,400 (0.5%)
In 12 months Victoria's ERP increased by 117,900 (2.2%)
Victoria’s 2008-09 growth rate of 2.2% was higher than the average growth rate of 1.8%
experienced for the five years to June 2009
Over 30 years to 2036 Victoria is predicted to grow by an additional 2.3m people, with
1.8m of these expected to live in Melbourne (and almost 50% of this growth expected to
be accommodated in established areas)
Prepared for Manningham City Council 7
MacroPlan Australia Pty Ltd
June 2010Doncaster Hill – Development Opportunities and Constraints
Final Draft Report
Melbourne’s rapid population growth has been driven largely by a substantial increase in net
overseas migration and an increase in natural births over deaths. Notably also, less people are
now leaving Victoria for interstate locations.
The following figure demonstrates these state-wide trends for the period 1996-2010.
Figure 3. Victorian Population Drivers, 1996 – 2010
40,000
35,000
30,000
25,000
20,000
15,000
10,000
5,000
0
Nov-1996
Nov-2001
Nov-2006
Dec-1998
Dec-2003
Dec-2008
Oct-1999
Oct-2004
Jan-2001
Jan-2006
May-1999
May-2004
May-2009
Apr-1997
Apr-2002
Apr-2007
Feb-1998
Aug-2000
Feb-2003
Aug-2005
Feb-2008
Mar-2000
Mar-2005
Jun-1996
Jun-2001
Jun-2006
Sep-1997
Sep-2002
Sep-2007
Jul-1998
Jul-2003
Jul-2008
-5,000
Natural Increase Net Overseas Migration Net Interstate Migration Change Over Previous Quarter
Source: ABS Regional Population Growth (Cat. NO. 3218.0, 2010); Victoria in Future (2009); & MacroPlan Australia
(2010).
Melbourne’s rate of population growth is also reflected at the Manningham LGA level, as
depicted in the following graph.
Prepared for Manningham City Council 8
MacroPlan Australia Pty Ltd
June 2010Doncaster Hill – Development Opportunities and Constraints
Final Draft Report
Figure 4. Population Growth in Manningham
135,000
Estimated Residentail Population Actual
130,000
Projected
125,000
120,000
115,000
110,000
105,000
100,000
1996
2000
2004
2008
2012
2016
2020
2022
2024
2026
1998
2002
2006
2010
2014
2018
Source: ABS 3218 Estimated Residential Population, Victoria in Future 2009 and MacroPlan Australia (2010)
The LGA’s growth rate since 2006 has been 2.9%, 0.5% faster than Melbourne as a whole over
the same period (2.4%).
Manningham’s population at the time of the 2006 Census was 108,843. Its current population is
118,544 persons (ERP June 2009).
The characteristics of the Manningham population are outlined in the following table.
Prepared for Manningham City Council 9
MacroPlan Australia Pty Ltd
June 2010Doncaster Hill – Development Opportunities and Constraints
Final Draft Report
Figure 5. Doncaster, Manningham and Melbourne – Population Characteristics
Source: ABS Census 2006 & MacroPlan Australia (2010)
Manningham’s population can most readily be categorised as affluent, mature and traditional.
It has a larger percentage of persons aged 55 and over (30%) than metropolitan Melbourne
(23%). Notably, Doncaster has a higher proportion of persons aged 55 and over than both
Manningham and Melbourne (at 35%).
Manningham and Doncaster also have a higher proportion of home owners and buyers than
metropolitan Melbourne (at 85%, 82% and 73% respectively). This level of home ownership and
population ageing suggests that there is a high potential for older home-owners in Manningham
and Doncaster to cash out the family home to downsize their accommodation type or to consider
retirement living.
Prepared for Manningham City Council 10
MacroPlan Australia Pty Ltd
June 2010Doncaster Hill – Development Opportunities and Constraints
Final Draft Report
3.2 Melbourne and Manningham – House Price Growth
The table below shows that Melbourne homes had the third highest price increases in real terms
over the last five years to March 2010 of any capital city, behind only Perth and Darwin.
Figure 6. National Median House Prices
Change
Mar-05 Mar-10 %
Sydney 95.5 115.7 21.2
Melbourne 102.0 174.1 70.7
Brisbane 104.8 155.1 48.0
Adelaide 107.0 160.8 50.3
Perth 116.3 208.8 79.5
Hobart 112.5 159.8 42.0
Darwin 120.1 226.3 88.4
Canberra 100.6 147.4 46.5
Australia 101.3 148.5 46.6
Source: ABS 6146.0 2010, MacroPlan 2010
This trend is further demonstrated in the figure below, which tracks actual house price values
from 2002 to 2010.
Figure 7. National Median House Prices
600.0
500.0
Sydney
400.0
$ Thousnands
Melbourne
300.0 Brisbane
Adelaide
200.0 Perth
Hobart
100.0
Darwin
0.0 Canberra
Sep-2002
Sep-2003
Sep-2004
Sep-2005
Sep-2006
Sep-2007
Sep-2008
Sep-2009
Mar-2002
Mar-2003
Mar-2004
Mar-2005
Mar-2006
Mar-2007
Mar-2008
Mar-2009
Source: ABS House Price Indexes (March 2010) and MacroPlan Australia (2010).
This price growth has occurred notwithstanding a comparatively healthy addition to dwelling
stock across Victoria and Melbourne. It has been buoyed by the immediate post-GFC low interest
Prepared for Manningham City Council 11
MacroPlan Australia Pty Ltd
June 2010Doncaster Hill – Development Opportunities and Constraints
Final Draft Report
rate environment and further aided by recent government assistance to first and other home
buyers.
The following graphs track Melbourne’s sales volumes and dwelling prices as well as interest rate
movements.
Figure 8. Melbourne House and Unit Prices
Source: RP Data (2010)
Figure 9. Target Cash Rate – Reserve Bank of Australia
8.00%
7.00%
Cash Rate (%)
6.00%
5.00%
4.00%
3.00%
2.00%
1.00%
0.00%
May-01
May-03
May-05
May-07
May-09
Sep-06
Sep-00
Sep-02
Sep-04
Sep-08
Jan-00
Jan-02
Jan-04
Jan-06
Jan-08
Jan-10
Target Cash Rate
Source: Reserve Bank of Australia 2010; MacroPlan Australia 2010
Prepared for Manningham City Council 12
MacroPlan Australia Pty Ltd
June 2010Doncaster Hill – Development Opportunities and Constraints
Final Draft Report
3.3 Where in the Cycle are we?
An analysis of construction activity in Victoria over time shows that, generally, there are surges in
construction activity every three to five years and that the nature of building activity is often
sectoral.
At present residential activity in Victoria is strong, despite a level of residential under-building
across Australia.
Figure 10. Value of Building Work – Victoria 1985 – 2010
Source: ABS 8755.0; MacroPlan Australia 2010.
Prepared for Manningham City Council 13
MacroPlan Australia Pty Ltd
June 2010Doncaster Hill – Development Opportunities and Constraints
Final Draft Report
Figure 11. Trends in Australian Dwelling Approvals and Completions
200000
Approvals
Completions
180000 Compl.
long term
160000
140000
120000
100000
80000
Source: ABS 8731 & 8752; MacroPlan 2010
3.4 The Manningham Market
Since the early 2000s the value of the Manningham property market has increased substantially.
This increase has coincided with the release of the Doncaster Hill Strategy in 2002 and a number
of key developments in the area. In particular the Westfield shopping centre expansion has
cemented Doncaster Hill’s position as a key activity centre in metropolitan Melbourne. Westfield
Doncaster attracts over 7 million consumers a year.
Current House Prices
Median house prices at Manningham have risen by $330,000 from 2000 levels to average prices
in excess of $600,000.
Prepared for Manningham City Council 14
MacroPlan Australia Pty Ltd
June 2010Doncaster Hill – Development Opportunities and Constraints
Final Draft Report
Figure 12. Metropolitan Melbourne V Manningham Median House Prices
$700,000
Manningham
$600,000
Metropolitan Melbourne
$500,000
Median House Pirce
$400,000
$300,000
$200,000
$100,000
$0
1985
1986
1987
1988
1989
1990
1991
1992
1993
1994
1995
1996
1997
1998
1999
2000
2001
2002
2003
2004
2005
2006
2007
2008
Source: Valuer Generals (2009) and MacroPlan Australia (2010)
Doncaster has also experienced a substantial increase in housing values since 2000, particularly
over recent years.
The median house price as at the March quarter in 2010 at Doncaster was $804,500 compared to
$763,000 in the December quarter 2009.
Doncaster is not alone in its experience of meteoric house value increases. Doncaster
experienced a 37.4% annual increase in house prices to March 2010, whilst other neighbouring
suburbs within the Manningham LGA experienced growth in excess of 50%.
Importantly, this bullish market means that the construction of medium and high density
dwelling product at Doncaster and surrounding markets has become far more financially viable
than was previously the case when MacroPlan last assessed market conditions in 2004.
Figure 13. House Prices in Manningham
Upper Dec 09 Mar 09 Quarterly Annual
Lower Mar 10
Quartile Median Median Change Change
Suburb Quartile Median
Doncaster $751,500 $804,500 $839,888 $763,000 $585,500 5.40% 37.40%
Doncaster East $662,500 $738,000 $831,000 $687,500 $629,100 7.30% 17.30%
Donvale $683,750 $777,500 $966,250 $750,000 $575,000 3.70% 35.20%
Templestowe $774,225 $949,444 $1,227,750 $845,400 $677,550 12.30% 40.10%
Templestowe
Lower $690,000 $738,000 $840,000 $694,500 $541,500 6.30% 36.30%
Warrandyte $669,500 $853,750 $1,022,500 $775,000 $537,500 10.20% 58.80%
Source: Real Estate Institute of Victoria and MacroPlan Australia
Prepared for Manningham City Council 15
MacroPlan Australia Pty Ltd
June 2010Doncaster Hill – Development Opportunities and Constraints
Final Draft Report
Figure 14. Median House Price Trends – Manningham, March 2006-2010
Source: Real Estate Institute of Victoria
The Global Financial Crisis impacted on different suburbs in Manningham in different ways. At
Doncaster prices fell by $100,000 over a six month period, then recovered within a year and
subsequently increased to their current high levels.
Building Activity
As demonstrated by the below graph, residential building approvals in Manningham peaked in
2005.
The overall number of residential building approvals at Manningham declined steadily over the
three years from 2005 and then rose in 2009. The important point to note is that the decline
from 2006 to 2008 was mostly for separate houses and that the increase to 2009 was driven
mainly by higher density dwellings.
Notably, approvals of higher density dwellings have comprised about half of the dwelling
approvals over the past 5 years.
Prepared for Manningham City Council 16
MacroPlan Australia Pty Ltd
June 2010Doncaster Hill – Development Opportunities and Constraints
Final Draft Report
Figure 15. Building Approvals in Manningham
600
Separate Houses
Higher Density
500
Building Approvals - Manningham LGA
400
300
200
100
0
2004
2005
2006
2007
2008
2009
Source: ABS Building Approvals (2010) and MacroPlan Australia (2010).
The following figure tracks the value of building permits in residential and non-residential
markets from 2001.
Notably, the value of retail and commercial development has increased in Manningham over the
last five years. The strength of these sectors is encouraging and reinforces the context of
Manningham and the role of Doncaster (as the major centre in Manningham) in the Melbourne
metropolitan strategy – i.e. the LGA’s role as a key inner-urban location and Doncaster Hill’s role
as a major activity centre.
Although the total value of residential building permits issued in Manningham has declined,
MacroPlan’s investigations as to the current underlying value of residential projects suggests that
the 2003-2010 trend in building approvals may be reversed if current market conditions remain.
The recent flurry of commercial and retail development at Manningham demonstrates the
cyclical nature of activity in a mixed use market. The fact that this level of commercial and retail
development has occurred, however, has now made Doncaster a more attractive residential
investment proposition.
Further discussion on the current market appetite for retail, commercial and residential
development at Doncaster is provided in the following chapter.
Prepared for Manningham City Council 17
MacroPlan Australia Pty Ltd
June 2010Doncaster Hill – Development Opportunities and Constraints
Final Draft Report
Figure 16. Value Trends in Building Permits – Manningham
50
45
40
35
30 Retail
25
$m
Commercial
20
Residential
15
10
5
0
2001 2002 2003 2004 2005 2006 2007 2008 2009 2010
Source: Building Activity Profile – Building Commission Victoria and MacroPlan Australia (2010)
Prepared for Manningham City Council 18
MacroPlan Australia Pty Ltd
June 2010Doncaster Hill – Development Opportunities and Constraints
Final Draft Report
4 Future Doncaster
‘Melbourne @ 5 million’ sets a target for an additional 600,000 dwellings by 2030, with at least
53% or 318,000 of these expected to be provided in the established urban areas. A good deal of
this population and dwelling growth is anticipated to occur in nominated redevelopment sites
(i.e. in Principal Activity Centres and Major Activity Centres). Doncaster Hill is identified as a
Principal Activity Centre.
4.1 The Doncaster Hill Precinct Update
It is anticipated that recent State Government initiatives such as the introduction of the new
Activity Centre Zone will act to encourage further development at the Doncaster Hill centre. It is
also noted that Doncaster Hill has been selected by Sustainability Victoria as a Smart Energy Zone
and has accordingly been awarded grants of up to $2 million from Federal and State
governments to assist in the implementation of energy generation and efficiency measures.
Recently developments at Doncaster Hill include:
A $650m redevelopment of the Westfield shopping centre – establishing it as a flagship
centre in Australia and expanding its market catchment draw;
205 residential apartments under construction, with another 1,206 proposed;
A five-star $45m hotel development (Crowne Plaza); and
A $38m Civic Precinct Community Centre building, in addition to other retail and
restaurant facilities.
Also, recently an Asia-based builder has paid $16.25m for an 8,400m² bulky goods complex at
602-630 Doncaster Road (presently occupied by Officeworks and Autobarn). The site is to be
rebuilt as a $100m mixed-use village of shops, offices and apartments.
Prepared for Manningham City Council 19
MacroPlan Australia Pty Ltd
June 2010Doncaster Hill - Development Opportunities and Constraints
Final Draft Report
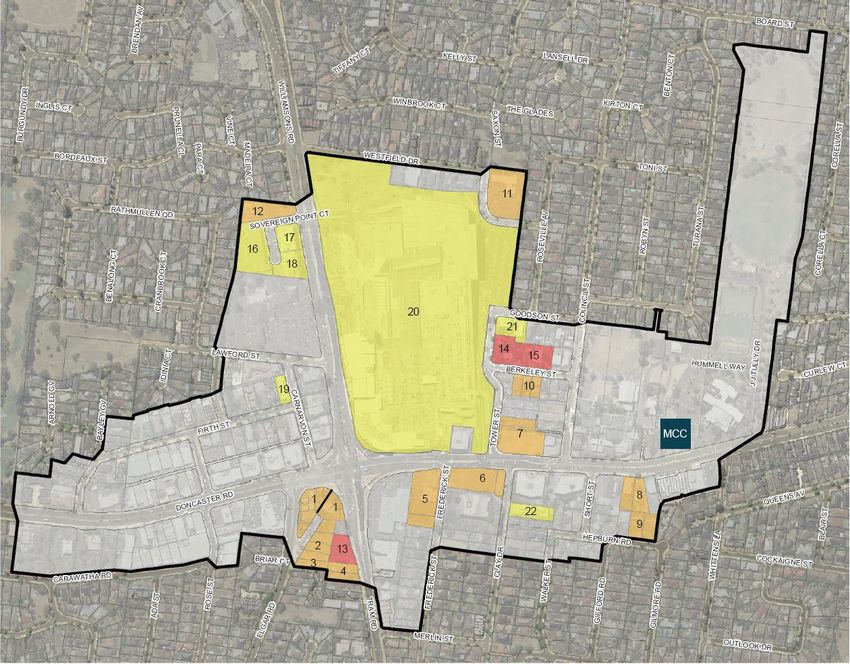
Figure 17. Recent Doncaster Hill Developments
Prepared for Manningham City Council 20
MacroPlan Australia Pty Ltd
June 2010Doncaster Hill – Development Opportunities and Constraints
Final Draft Report
4.2 The Property Development Equation for Doncaster
In order to test the relevance of the Doncaster Hill Strategy, MacroPlan has considered the
underlying value proposition for residential, commercial and mixed use (retail) development in
order to fathom the market’s potential appetite for development at the Hill.
For the purpose of this exercise MacroPlan has updated previous advice and property value
information provided in its 2004 report, i.e. it has used the same property characteristics but
updated its models based on current sales values for residential, retail and office uses.
The results of MacroPlan’s findings are summarised below:
Residential Development
Land at Doncaster is presently valued at around $50,000 per apartment.
Applying this rule of thumb value to a 200 unit development project we find that the market
could absorb a purchase price for the land of up to $10 million. In other words if the site was
purchased for $5 to $7 million, it would offer good value for high-density residential
development.
The feasible development of sites at Doncaster will obviously depend on other factors such as
trends in building costs and the cost of finance but the above rule of thumb is relevant for
comparison to other development opportunities.
Commercial and Retail Land
The equation for commercial and retail land is more complex as the feasibility of this form of
development depends not only on the price of ‘raw’ land, building costs and expected sale prices,
but also on the projected rental yield and take-up rates.
Whilst prices of up to $2,000 per square metre have been paid for ‘raw’ commercial land in the
Manningham/ Doncaster area, high construction costs (of up to $2,300 per m²), a low demand
base and a retail value of around $4,000 per m² for retail and $4,500 per m² for office space
means that commercial developments in their own right are difficult to stack up. This does not
mean, however, that commercial and retail development cannot be incorporated into mixed use
developments to support overall project viability.
Mixed Use Development Feasibility Case Study
In order to demonstrate the impact of project variables on overall feasibilities MacroPlan has
updated a demonstration case study of a hypothetical mixed use development project on a
5,000m² site on Doncaster Road. The case study compares construction and other costs and
overall potential profit levels in today’s market with the same development scenario from our
2004 report.
Prepared for Manningham City Council 21
MacroPlan Australia Pty Ltd
June 2010Doncaster Hill – Development Opportunities and Constraints
Final Draft Report
The following development approval and cost assumptions have been used:
Residential - 132 apartments @ at average size 100m² each = 13,200m²
Retail - 1,828m² including a restaurant
Office - 1,525m²
Car park - 285 spaces
Residential Construction Costs - $3,000/m²
Retail Construction Costs - $1,800/m²
Office Construction Costs - $2,300/m²
Interest Rate - 7.5%
LVR - 60%
The costs listed above represent average construction costs for suburban Melbourne and are
based on the industry-accepted Rawlinsons Australian Construction Handbook (2010). The costs
of construction for residential are 30% higher than 2004, while retail and office construction
costs have risen 10% and 7% respectively.
The development equation for each component of the development is depicted below:
Figure 18. The Residential Equation
Year 2004 Year 2010
RESIDENTIAL EQUATION - 13,200m² offer
Revenue from sales @ $6,000/m² $51,744,000 $77,616,000
Less developers 20% share of sales revenue -$10,348,800 -$15,523,200
Net sales revenue $41,395,200 $62,092,800
Construction Cost of Apartments @ $3,000/m² $30,360,000 $39,600,000
Construction Cost of Carparks @ $800/m² $6,076,000 $9,873,500
TOTAL CONSTUCTION COST -$36,436,000 -$49,473,500
Interest allowance on borrowed funds -$2,550,520 -$4,452,615
TOTAL PROJECT COST -$38,986,520 -$53,926,115
SUPER PROFIT / ADDITION TO LAND VALUE $2,408,680 $8,166,685
Prepared for Manningham City Council 22
MacroPlan Australia Pty Ltd
June 2010Doncaster Hill – Development Opportunities and Constraints
Final Draft Report
Figure 19. The Retail Equation
Year 2004 Year 2010
RETAIL EQUATION – 1,828m² offer
Revenue from sales @ $4,000/m² $5,374,320 $7,165,760
Less developers 20% share of sales revenue -$1,074,864 -$1,433,152
Net sales revenue $4,299,456 $5,732,608
Construction Cost of Retail @ $1,800/m² $2,997,920 $3,290,400
Construction Cost of Carparks @ $800/m² $1,120,000 $1,120,000
TOTAL CONSTUCTION COST -$4,117,920 -$4,410,400
Interest allowance on borrowed funds -$288,254 -$396,936
TOTAL PROJECT COST -$4,406,174 -$4,807,336
SUPER PROFIT / ADDITION TO LAND VALUE -$106,718 $925,272
Figure 20. The Office Equation
Year 2004 Year 2010
OFFICE EQUATION – 1,525m² offer
Revenue from sales @ $4,500/m² $5,230,750 $6,725,250
Less developers 20% share of sales revenue -$1,046,150 -$1,345,050
Net sales revenue $4,184,600 $5,380,200
Construction Cost of Office @ $2,300/m² $3,263,500 $3,507,500
Construction Cost of Carparks @ $800/m² $784,000 $784,000
TOTAL CONSTUCTION COST -$4,047,500 -$4,291,500
Interest allowance on borrowed funds -$283,325 -$386,235
TOTAL PROJECT COST -$4,330,825 -$4,677,735
SUPER PROFIT / ADDITION TO LAND VALUE -$146,225 $702,465
Prepared for Manningham City Council 23
MacroPlan Australia Pty Ltd
June 2010Doncaster Hill – Development Opportunities and Constraints
Final Draft Report
Overall the above analysis demonstrates that a mixed-use residential/office/retail development
providing the developer with a 20 per cent return on sales yields the following returns:
2004 2010
Total project sales revenue $49.9 million $73.2 million
(net of developers share)
Total project cost $47.72 million $58.2 million
Total addition to land value $2.155 million $9.8 million
The total addition to land value represents the profit margin above the developers’ return of 20%
on sales revenue. It can be used to assess whether the purchase price of land is feasible as part
of the overall project cost equation.
The above table reveals that the total addition to land value ($9.8 million) has increased almost
five-fold since 2004 levels.
Land at Doncaster Hill has recently sold for around $2,000/m². Using the hypothetical total
addition to land value for 2010 from the above case study of $9.8m for a 5,000m² site represents
a ‘raw’ value of $1,960. In this case, therefore, the development yield from the mixed use
development is sufficient to cover land and other costs. In 2004, under the same assumptions
but with different sales values, the hypothetical project was found to be unviable. The increase in
market values for residential, retail and commercial product has therefore helped to improve the
viability of development options at Doncaster since 2004.
Importantly, the most valuable development scenario from those tested is residential
development, with an end sale price of around $6,000 per m². This finding strongly supports the
underlying tenet of the Doncaster Hill Strategy to support and promote mixed use development
at the centre, i.e. the primary residential focus of the Doncaster Strategy is in keeping with
current market expectations and will provide a strong underpinning of mixed use developments
within the centre over the short-medium term.
MacroPlan’s development equation assessment suggests that the financial uncertainty that
dogged development projects over the last 5 years at Doncaster may have “turned a corner” as
demonstrated by current market values and the fact that the worst of the global financial crisis
has passed. As lending conditions ease and a renewed focus on property portfolios emerges, it is
likely that Doncaster’s development opportunities will be more eagerly sought in the immediate-
short term, barring any significant global relapse.
Our review has demonstrated the cyclical nature of property investment and the impact of
construction costs and retail costs, inter alia, on project viabilities. It is, accordingly, appropriate
for Council to revisit fundamental market conditions at regular intervals to test market
responsiveness or the relevance of planning and like controls at that time in the property cycle.
Commentary on these matters is provided in the following section.
4.3 Floor space demand and requirements for Doncaster Hill
In 2007 Manningham Council commissioned work by Tim Nott to consider the range of
compatible non-residential activity (e.g. local neighbourhood retailing, entertainment activities,
Prepared for Manningham City Council 24
MacroPlan Australia Pty Ltd
June 2010Doncaster Hill – Development Opportunities and Constraints
Final Draft Report
office development and community facilities) that could be supported by the predominant
residential development anticipated at Doncaster Hill.
The main findings of the ‘Neighbourhood Commercial Activities for Doncaster Hill (May 2007)’
report were:,
By 2021 new residents will create demand for 5,000-17,000 m2 of additional non-
residential uses that could be located outside of Westfield, such as local convenience
stores, newsagents, restaurants, cafes and video stores as well as community and
entertainment facilities.
If co-located with residential developments, non-residential uses would need to be
located on ground floors to capture passing trade and promote business
Planning strategies from other centres revealed that a mix of uses is essential for
successful centres, but that two different uses in the same building – office/retail,
residential/retail or residential/community – were more acceptable to the market than
three or more different uses
A further Review of Retail Floor Space (July 2008) by Tim Nott compares the implications of four
different retail floor space controls for Doncaster Hill and recommends that the existing ‘15% of
site area’ control be abandoned in favour of a ‘12.5% of building area’ control. The review
identifies that this control could deliver 46,000m² of retail space compared to an identified need
of 38,000m² by 2031..
The report notes that controls recommended by the State Government’s Priority Development
Panel (PDP), i.e. a ‘25% of building area’ control, would generate up to 97,000m² of retail space,
some 59,000m² in excess of estimated demand and potentially to the detriment of nearby
smaller local centres.
It is noted that the recent doubling in size of the Doncaster Westfield (from 51,000m² and 202
retail outlets to 111,000m2 and 400 outlets) to become the fifth largest shopping centre in
Australia has added an extra 60,000m2 of retail to the Doncaster Hill precinct, which is well above
the required 38,000m2 identified by Nott. In this context, a debate about the specific controls to
encourage more retail development in the present climate may be futile. Accordingly, the
approach recommended by Nott more realistically responds to a quantum of retail space that the
market may be prepared to deliver, although it is likely that the rate of that delivery may slow in
the immediate future.
MacroPlan’s above findings (Section 4.2) highlight the comparative attractiveness of residential
development at Doncaster Hill at this point in time of the property cycle. Council’s continued
focus on the residential potential of Doncaster is therefore supported by current market
conditions. Any undue increase in retail development capacity may serve to contradict this policy
emphasis and should therefore be avoided.
Prepared for Manningham City Council 25
MacroPlan Australia Pty Ltd
June 2010Doncaster Hill – Development Opportunities and Constraints
Final Draft Report
5 The New Doncaster Hill Value Equation
This chapter further examines what the future market opportunities at Doncaster might look like.
5.1 The Outlook for Doncaster Hill
Our outlook is influenced by the following factors:
The Manningham LGA currently has an employment self-containment level of 21.9%.
Approximately 16% of Manningham’s workforce travel to Melbourne CBD to work, while
a further 24% work in surrounding LGAs. Manningham’s self-sufficiency is about average
for similarly positioned LGAs in metropolitan Melbourne, although the strong
representation of people working in adjacent LGAs suggests that there is a capacity to
draw back some of these jobs to Manningham. Doncaster is expected to increasingly
become an employment destination of choice for the LGA’s workforce.
Elsewhere in Australia
5.0% Melbourne (C)
16.2%
Elsewhere in Victoria
32.8%
Manningham (C)
21.9%
Adjacent LGAs
24.1%
Source: ABS, Journey to Work Data, 2006
This suggests that more employment opportunities could be offered at Doncaster to
capture residents leaving the LGA for work. The strong regional availability of jobs also
suggests that Doncaster, with its strong public transport (bus) linkages, could perform
the role of an origin centre providing a residential base for resident workers travelling
elsewhere in the region for work.
New housing products will be required to meet expected demand generated from
Manningham’s continued population growth. Changing household structures, including
an increase in sole person households and an increasing proportion of residents born
overseas, will drive demand for a higher density accommodation offer.
Melbourne’s increasing remote and mobile workforce and the increased level of wealth
that this brings will also drive a demand for low-maintenance higher density dwellings.
Prepared for Manningham City Council 26
MacroPlan Australia Pty Ltd
June 2010Doncaster Hill – Development Opportunities and Constraints
Final Draft Report
This increased wealth is expected to drive a demand for high end products/premium
locations in the Manningham area and an increased demand for multiple dwelling
buildings as more people seek to take advantage of the LGA’s offerings.
Manningham’s and Doncaster’s attractiveness compared to other centres an equal
distance from Melbourne CBD is such that new development is likely to attract residents
from both neighbouring localities and localities further afield. Manningham is well
serviced by the M3 Eastern Freeway and orbital bus links and there is a genuine lack of
similar sized and similarly located centres with sufficient underlying land value to attract
investors and developers.
Manningham’s ageing population will further ensure a demand for higher density or
multiple dwelling accommodations as cashed-up retirees look to downsize their housing
type
Figure 21. Reasons for Moving Houses – 55 – 75 Age Brackets
Source: ABS & MacroPlan (2010)
Melbourne’s ageing population more generally is likely to result in a new wave of capital
city re-urbanisation, as the elderly seek to locate close to city facilities, particularly those
related to health services.
Manningham and Doncaster are well positioned to respond to this housing demand,
especially given its proximity to services such as the Box Hill Hospital and its attractive
green suburban hinterland within close proximity to Melbourne CBD. Also, as shown
earlier in this report, the underlying housing values in the LGA are such that the
downsizing of housing types for ageing residents is financially possible.
Prepared for Manningham City Council 27
MacroPlan Australia Pty Ltd
June 2010Doncaster Hill – Development Opportunities and Constraints
Final Draft Report
MacroPlan anticipates that the provision of vertical housing product to suit ageing
residents is a prime candidate for the Doncaster mixed use centre, offering a high quality
residential setting close to city services and modern retail facilities.
Figure 22. Victoria’s Ageing Population
2009 2026 Increase
55 - 74 year olds 986,731 1,401,524 414,793
Source: Projected Resident Population ABS
A strong feature of current metropolitan and local planning policies is the linking of
population densities to urban services, especially transport services. The consolidation
of Melbourne’s population is expected to accommodate almost 50% of Melbourne’s
population growth to 2030.
Improved public transport connections to and from Doncaster – the Red (Mordialloc to
Altona) and Green (Chelsea and Airport West) Orbital SmartBus services commenced in
April 2010. The SmartBus system offers more frequent services and greater reliability.
The Yellow orbital bus service is anticipated to commence operations in early 2011. Also,
the DART (Doncaster Arterial Rapid Transit) service is due to commence in early 2011,
which will increase the number, frequency and times available of bus services running
through Doncaster Hill.
Prepared for Manningham City Council 28
MacroPlan Australia Pty Ltd
June 2010Doncaster Hill – Development Opportunities and Constraints
Final Draft Report
Figure 23. SmartBus Orbital Bus Routes
Source: Metlink, Victoria 2010
Doncaster is also well serviced by the M3 Eastern Freeway, providing good access to the
Melbourne CBD for both motorists and bus-commuters.
Apart from Box Hill, Doncaster is the only other activity centre identified within the
north-east sector of Melbourne. Doncaster is identified as a Major Activity Centre with
Box Hill identified as a Central Activity District under the Melbourne 2030 strategy. These
two centres will vie for development activity within the corridor. There are no other
centres within the corridor capable of meeting long term housing and employment
requirements. Eltham is ageing and Greensborough is not ready. Despite some locational
advantages of Box Hill over Doncaster (mainly its rail connection and its health and
tertiary education facilities) the surrounding catchments are sufficiently wealthy and
amenable to support both activity centres.
MacroPlan anticipates that future Transit Orientated Development (TOD) opportunities
at Doncaster will reinforce its role as the primary activity centre in the LGA and help to
develop the functioning of the centre as both a residential origin and as an employment
destination centre.
Whilst Melbourne’s great competitive strength at present is the ability to produce
housing at relatively affordable prices to other mainland capitals, its ability to continue to
Prepared for Manningham City Council 29
MacroPlan Australia Pty Ltd
June 2010Doncaster Hill – Development Opportunities and Constraints
Final Draft Report
expand the city is and will continue to be tested. Whilst Melbourne’s recent competitive
advantage has been in the delivery of inexpensive, quality suburban development this is
expected to shift over the course of the next decade to an emphasis on quality infill
development.
Both Manningham and Doncaster are well placed to reap of the benefits of this shift in
housing opportunities. Its green suburbs and strong transport linkages make Doncaster a
prime target for the new wave of green office buildings (in response to recent federal
laws requiring the disclosure of office building energy performances).
Doncaster is also well placed to attract the provision of new forms of affordable housing
as the market increasingly responds to government initiatives and incentives to increase
the supply of affordable housing stock. New trends in affordable housing provision for
seniors, modelled on the Dutch Humanitas approach (‘apartments for life’) are also
suited to the Doncaster centre. The ‘apartments for life’ approach is based on providing
a suitable form of accommodation for ageing Australians where the active elderly are
able to integrate with the broader community, both on a business and private level. The
program is gaining market recognition in New South Wales following a recent Court
approval at Bondi. It is being investigated for broader roll-out by Housing NSW. The
initiative is based on an apartment offer above a ground level retail or commercial
component and is therefore well suited to the mixed use rationale of the Doncaster
Strategy.
5.2 New Competitive Position viz a viz Other Locations
Based on MacroPlan’s findings with respect to the current development climate for residential,
commercial and mixed use projects at Doncaster and our understanding of future development
drivers, MacroPlan has identified the following gaps/opportunities for Doncaster:
Apartment Living – Doncaster is a high quality location and has a strong long term
investment potential for this development form, appealing to various household types –
empty nesters, sole persons, couple families without children and the aged (e.g. vertical
retirement). The broad range of market segments that this type of housing is suited to at
Doncaster underlies the importance of meeting the full variety of demand across a
variety of price points. Not all apartment products at Doncaster need to be targeted to
the premium end of the market.
Doncaster is under-employed and offers potential to grow its employment base. Given
its transport linkages and proximity to educational services (e.g. Box Hill TAFE) it is able
to be developed for business people – SME / proximity to airport
Transit Oriented Development opportunities focusing on mixed use developments with a
core residential component
Health-related services building on the ageing population characteristic and the potential
for value-add services to capture this emerging market
A developing night-time economy, catering for expected an increasing local population,
possibly including new ‘club of the future’ formats offering facilities for all ages and
strong community networks.
Prepared for Manningham City Council 30
MacroPlan Australia Pty Ltd
June 2010Doncaster Hill – Development Opportunities and Constraints
Final Draft Report
Importantly, in advancing the future development of the Doncaster Hill centre it is vital that the
broader community be engaged. The Westfield shopping centre is a ‘favourite’ location,
attracting over 7 million visitors per year. Westfield provides a critical mass around which to
develop other retail, office and residential uses. Its anchor role is expected to be shared by the
new Crowne Plaza hotel project. It will be important to consolidate the social networking
opportunities that these developments offer and to ensure that other new developments
address the need to incorporate appropriate ‘people space’. The new Council offices provide an
opportunity for such meeting places.
Public meeting places, either separately provided or incorporated into private developments, are
expected to take on an increased importance as Doncaster develops as a compact living
environment/mixed use centre. The provision of such space will help to dispel any public
misgivings about higher density forms of housing. As the centre matures this need will be
replaced, to some extent, by the commercial provision of meeting spaces – e.g. in the form of on-
street restaurants and cafes etc.
It is also important that Council embrace the current commercially-driven trend of ‘greenifying’
buildings. This should be done in concert with industry and with community expectations,
offering an opportunity to signify Doncaster’s commercial presence in a distinctive manner. This
will help to ensure that a suitable offering of A-Grade commercial stock is made available at
Doncaster, as is presently required by the market (including government uses). The strong desire
for high-rated environmentally performing building stock is partly driven by the onset of new
national regulation which requires the disclosure of energy usage by commercial tenancies.
In MacroPlan’s opinion Doncaster is unique. It is ‘green and suburban’ but closely linked
regionally and to the Melbourne CBD through excellent private and public transport services.
Whilst green areas are not typically associated with higher density built forms, Doncaster’s
location as the primary activity centre at the head of Melbourne’s north-eastern corridor means
that it is well positioned to take advantage of its activity centre status.
Having out-lasted the ill effects of the global financial crisis the strategy for Doncaster is now well
placed to attract market interest. The property fundamentals of Manningham / Doncaster as an
investment location remain strong – it has a growing population, increasing underlying land
values, distinctive locational advantages and a solid critical development mass to build from.
With these credentials MacroPlan believes that Doncaster will develop into the vibrant urban
community envisaged by the Doncaster Hill strategy.
Prepared for Manningham City Council 31
MacroPlan Australia Pty Ltd
June 2010You can also read