The Medical Journal of Australia - Accepted Article - 6 September 2021 - The Medical Journal of ...
←
→
Page content transcription
If your browser does not render page correctly, please read the page content below
The Medical Journal of Australia - Accepted Article - 6 September 2021

Modelling direct and herd protection effects of vaccination against the SARS-CoV-2
Delta variant in Australia

Emma McBryde
Professor of Infectious Diseases Modelling and Epidemiology
James Cook University
Australian Institute of Tropical Health and Medicine
Townsville, Queensland, Australia

Michael Meehan
Research Fellow
James Cook University
Australian Institute of Tropical Health and Medicine
Townsville, Queensland, Australia

Jamie Caldwell
James Cook University
Australian Institute of Tropical Health and Medicine
Infectious Diseases Modelling and Epidemiology
Townsville, Queensland, Australia

Adeshina Adekunle
Research Fellow
James Cook University
Australian Institute of Tropical Health and Medicine
Townsville, Queensland, Australia

Samson Ogunlade
James Cook University
Australian Institute of Tropical Health and Medicine
Townsville, Queensland, Australia

Abdul Kuddus
James Cook University
Australian Institute of Tropical Health and Medicine
Townsville, Queensland, Australia

Romain Ragonnet
Research Fellow
Monash University
School of Public Health and Preventive Medicine
Melbourne, Victoria, Australia

Pavithra Jayasundara
Monash University
Department of Epidemiology and Preventive Medicine
Melbourne, Victoria, Australia
The Medical Journal of Australia - Accepted Article - 6 September 2021

James M Trauer
Head, Epidemiological Modelling Unit
Monash University
School of Public Health and Preventive Medicine
Melbourne, Victoria, Australia

Robert C Cope
Australian National University
Biological Data Sciences Institute ANU College of Science
Canberra, Australian Capital Territory, Australia

Corresponding author:
Professor Emma McBryde
emma.mcbryde@jcu.edu.au

Competing interests: No relevant disclosures

Funding:
ESM would like to acknowledge funding from an NHMRC investigator grant #1195102
JMT would like to acknowledge an NHMRC early Career Fellowship #1142638
and funding from MRFF Rapid Response Digital Health Covid RRDHI000027
PJ would like to acknowledge salary support from MRFF Rapid Response Digital Health
Covid RRDHI000027
MM would like to acknowledge ARC support for a Discovery Early Career Fellowship

 This article has been accepted for publication and has undergone full peer review but has
 not been through the full structural and scientific editing, typesetting, pagination and
 proofreading processes which may lead to differences between this version and the Version
 of Record. Please cite this article as doi: 10.5694/mja2.51263

The Medical Journal of Australia - Accepted Article - 6 September 2021

Abstract
Objectives: To analyse the direct and indirect effects of vaccination by vaccine type, age-
strategy, and coverage on Australia’s Coronavirus Disease 2019 epidemic.
Design: Our model incorporates age-specific mixing, infectiousness, susceptibility and
severity to assess the final size of the epidemic under different public health intervention
scenarios in Australia.
Main Outcome measures: The model predicts the final infected population, cumulative
hospitalizations, deaths and years of life lost following an epidemic wave, taking into account
vaccination and additional mitigation measures.
Results: Assuming a pre-vaccination effective reproduction number for the Delta variant of 5,
we show that the current “Mixed” program (vaccinating over 60s with AstraZeneca and
under 60s with Pfizer) would not achieve herd immunity, unless 85% of the population is
covered (including many 5-16 year-olds).
At a lower effective reproduction number of 3, the Mixed program can achieve herd
immunity at 60-70% coverage without vaccinating 5-15 year-olds. An effective reproduction
number of 7 precludes achieving herd immunity with existing vaccines, however vaccination
still prevents over 85% of deaths compared with no vaccination.
Conclusion: Vaccinating the vulnerable first is the optimal policy at low coverage, but
vaccinating high transmitters becomes more important in settings where reproduction
numbers are lower and coverage is higher. Vaccinating over 85% of the population including
children would likely be needed to achieve herd immunity at the most plausible effective
reproduction number of 5. Even without herd immunity, vaccines are highly beneficial at
reducing deaths.
Summary box
The known: Severe Acute Respiratory Syndrome Coronavirus-2 (SARS CoV-2) variants are
known to be more transmissible than the original Wuhan strain, making herd immunity
challenging.
The new: We find that prioritising the older-vulnerable leads to fewer deaths and is the
optimal strategy when vaccine coverage is under 70%. Herd immunity is unlikely unless
children 5-15 are vaccinated, but current vaccine targets are expected to prevent substantial
numbers of deaths.
The implications: Australia is unlikely to achieve herd protection unless vaccination is
extended to younger ages or combined with other measures. Australia should now prioritise
delivering Pfizer vaccine to 12-40 year-olds.
The Medical Journal of Australia - Accepted Article - 6 September 2021

On 2nd July 2021, the Australian National Cabinet announced a four-step plan to transition
from a strategy for Corona Virus disease 2019 (COVID-19) control to a re-opening and
return to normal life (1). To move to a more liberal setting (increasing international arrivals,
reduced lockdowns and simplified quarantine for vaccinated people (1)) requires vaccinating
a 70% of adult Australians to limit hospitalisations and deaths from COVID-19– by either
direct protection or herd protection. However, herd immunity has become more difficult to
achieve with the more infectious Delta variant raising the immunity threshold (2). Further,
currently available vaccines are slightly less effective at reducing symptomatic infection from
the Delta variant (3-5).
We previously investigated herd immunity thresholds and estimated optimised vaccine
distribution around the world for the original Wuhan strain (6), and here update this analysis
for the Delta variant in Australia.
The Delta variant is approximately twice as infectious as the original Wuhan strain (7);
however, given the pervasive implementation of mitigation measures, the exact value of its
pre-vaccination reproduction number (expected number of new cases caused by a typical
infected case in the absence of vaccination), which we denote eff ̅ , remains unclear.
For our primary analysis, we assume eff ̅ equals 5, which is at the lower end of estimates
used by Blakely et al. (8), the central value used by the Grattan report (9) and higher than that
used by the Doherty report (10).
Model outcomes (and resulting conclusions) are especially sensitive to eff ̅ . This value is
highly uncertain as it incorporates ever changing mitigation strategies including contact
tracing, mask use and mobility changes, along with viral evolution. We therefore consider
outcomes ranging from eff ̅ = 3 to eff ̅ = 7. Additionally, we developed a flexible online
tool, which allows the user to vary model parameters as new evidence emerges, including:
 eff ̅ ; the choice of vaccine; and the extent of pre-existing population immunity due to natural
infection, reflected by seroprevalence.
Age-specific vaccine strategies have been a large part of the COVID response in Australia
(11). Published age-specific contact matrices show that young adults are more sociable than
other groups in Australia, with a marked decline in contacts above age 55 (12), whereas
estimated COVID-19 infection fatality rates show that older people make up the most
vulnerable group. Hence, we investigate two alternative strategies for vaccine distribution
given fixed, limited supply: the first focuses on vaccinating the vulnerable (≥55), and the
second prioritizes vaccinating the most infectious (
The Medical Journal of Australia - Accepted Article - 6 September 2021

Following the vaccine availability in Australia, we consider three vaccine program
possibilities:
 (1) All vaccinations being Pfizer
 (2) All vaccinations being AstraZeneca
 (3) Mixed: Pfizer for
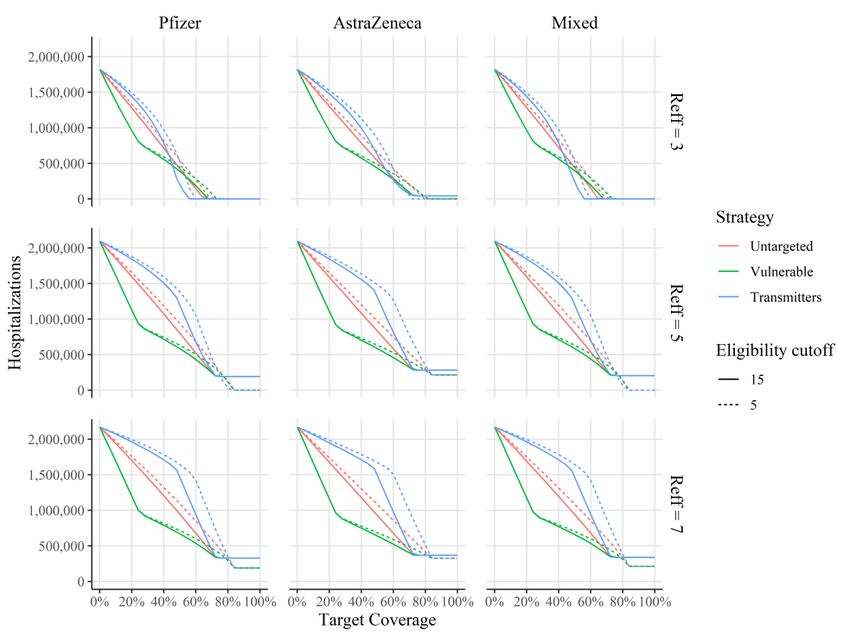
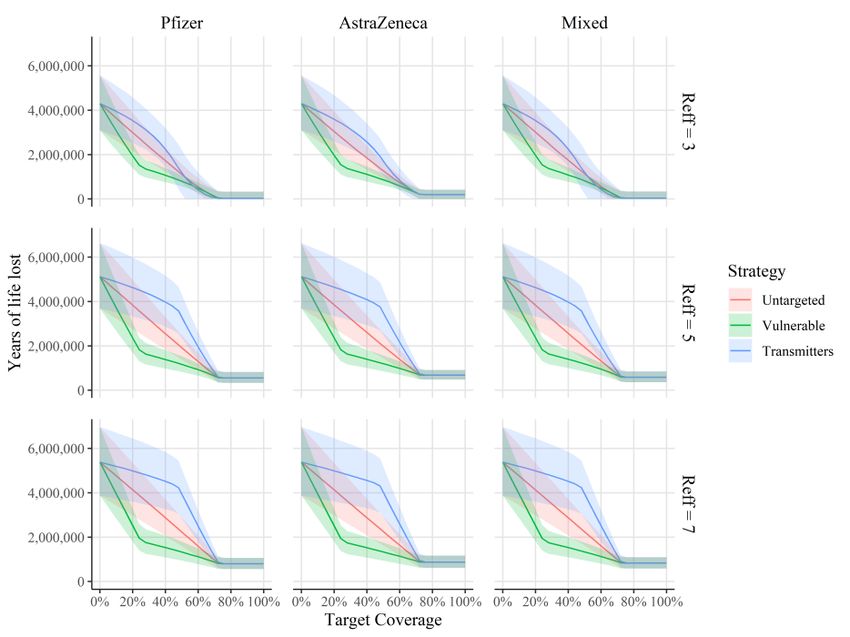
The Medical Journal of Australia - Accepted Article - 6 September 2021

each age and vaccination group over the course of an epidemic wave, using the final-size
equation (20):
 ̃ −1 ∑
 1 − ̃ = exp[− ̃
 ̃ ̃ ],

where ̃ is the fraction of individuals in group (where indexes both age and vaccination
status) that become infected throughout the course of the epidemic, and ̃ is the total number
of individuals in this group.
Next, we combine age-specific estimates for infection-fatality rate (21, 22) and life-
expectancy with estimates for vaccine efficacy from Table 1. This allows us to calculate the
cumulative number of infections, deaths and years of life lost under each strategy.
Our online tool is available at: https://covid-19-
aithm.shinyapps.io/vaccine_coverage_analysis
Our code is publicly available here:
https://github.com/michaeltmeehan/covid19/tree/main/immunization_australia
Our default assumption for the effective reproduction number before vaccination ( eff ̅ ) for
the Delta strain is 5.0, but we explore values from 3 to 7 in Figure 1. We define coverage as
the number of vaccine courses (2 doses) available divided by the total Australian population
(independent of the minimum vaccination age or the uptake proportion).

Results
Infections and herd protection
For all effective reproduction numbers and vaccination programs, prioritizing transmitters
leads to fewer (or, at worst, an equal number of) infections (Figure 1, panel a). Extending
vaccine recipients to 5+ (from 15+) improves the outcomes for infections in the Pfizer and
Mixed programs (Figure 1, panel a) if eff ̅ = 5 and eff ̅ = 7 but not for eff ̅ = 3.
Notably, if eff ̅ = 7 (Figure 1, bottom row), then no program or strategy achieves herd
immunity, regardless of age of eligibility. For eff̅ = 5 (Figure 1, middle row) herd
immunity can be achieved only if the minimum vaccination age is extended down to 5+. If
 eff ̅ = 3 (Figure 1, top row), we estimate that we can achieve herd immunity at 60%
coverage using a Pfizer or Mixed program and transmitter strategy, regardless of age of
eligibility. This threshold increases to 70% coverage when using the untargeted or vulnerable
strategies. AstraZeneca program does not achieve herd immunity under any model
assumptions.
Deaths, years of life lost, hospitalisations
For preventing years of life lost, the optimal strategy depends on eff ̅ . When eff ̅ ≥ 5
(Figure 1, middle and bottom rows), we find that the vulnerable strategy is either superior, or
equivalent to both the untargeted and transmitter strategies (Figure 1, panel b). The only
exception is a small window between 75 and 82% coverage where the transmitter strategy
marginally outperforms the other two strategies, provided the minimum vaccination age is
five years old and Pfizer is included in the vaccination program.
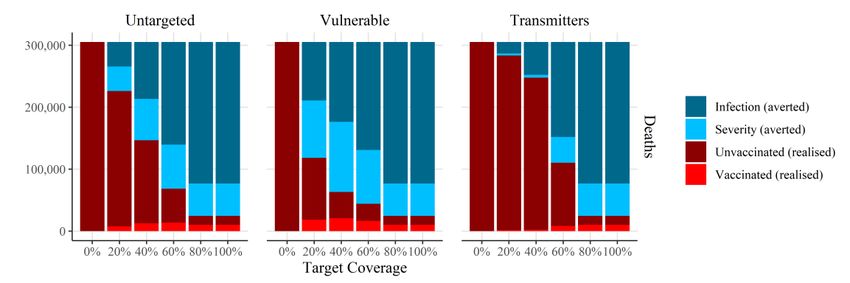
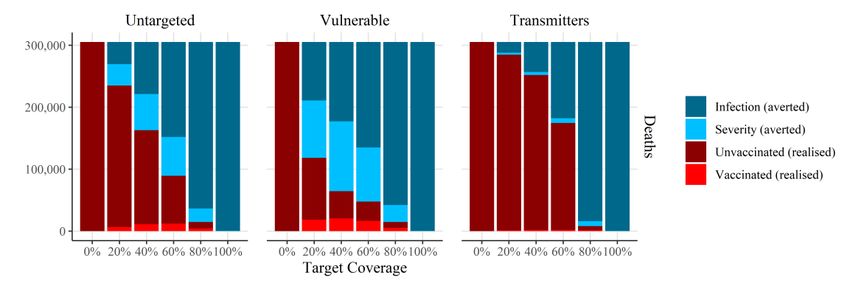
The Medical Journal of Australia - Accepted Article - 6 September 2021

When eff ̅ = 3 we find that within the coverage range of 50-70% for the Mixed and Pfizer
programs, the transmitter strategy is superior to the vulnerable strategy at reducing years of
life lost (YLL). For coverages less than 50%, the vulnerable strategy is always superior.
Similar results are found for both hospitalizations and deaths (see Figure A2, Appendix).
Outcomes for each of the three strategies converge when the entire eligible population is fully
vaccinated.
Lowering the age of vaccine eligibility to include 5 year-olds typically worsens the outcome
for YLL for a given coverage (Figure 1, panel b) until adult coverage is saturated. At this
point, vaccinating those aged 5-15 years reduces YLL.
In all cases the Pfizer and Mixed vaccination programs outperform the AstraZeneca only
program. The difference is most pronounced for infections (Figure 1, panel a) but much less
so for hospitalizations (Figure A2, panel a), deaths (Figure A2, panel b) and years of life lost
(Figure 1, panel b).
Figure 2 examines deaths given the current Mixed vaccination program in more detail and
compares the expected deaths from COVID-19 to that of a completed outbreak in an
unvaccinated population. It compares vaccinating 15+ in the lower panel with over 5+ in the
upper panel. It divides deaths into those occurring amongst the vaccinated (red) and
unvaccinated (maroon) populations. The plots also show the deaths averted (blue) which are
divided into deaths averted in infected people who survive because of the vaccine effect on
severity / mortality (light blue), and those who do not die because they never acquire
infection (dark blue). The figures show the importance of expanding vaccine eligibility to 5+
in order to achieve herd immunity at over 80% coverage. They also show that at high level of
vaccination, a substantial minority of deaths will be in the vaccinated population.
Sensitivity analysis
The results depend crucially on the assumed input parameter values. If eff̅ is as high as 7, as
shown in Figure 1, then herd immunity is not possible. On the other hand, if the effective
reproduction ratio could be constrained to below 2.7, through non-vaccination means, then
herd immunity is achievable using AstraZeneca, Pfizer or mixed programs.
We provide an online tool in which the user can explore a range of assumptions and
determine the sensitivity of the model outputs to these.
Further, in the appendix, we present a thorough sensitivity analysis that considers variations
in additional key input parameters not presented above (the infectiousness of asymptomatic
relative to symptomatic cases, the overall vaccine efficacy Ve against symptomatic infection,
and the odds ratio of death for Delta v. original SARS-CoV-2 strains). We also examine a
second synthetic contact matrix, more directly matched to empirical matrices. In all cases we
find that our general conclusions regarding the ability of vaccination to achieve herd
immunity, and the ranked performance of each vaccination strategy are robust.

Discussion
We show that the current decision in Australia to vaccinate the vulnerable older age groups
first is the optimal strategy for reducing hospitalizations, deaths and years of life lost from
The Medical Journal of Australia - Accepted Article - 6 September 2021

COVID-19 for a highly infectious COVID-19 variant like Delta. The use of AstraZeneca for
the elderly and Pfizer for the younger population allows for the possibility of herd immunity.
However, if the effective reproduction number of the Delta strain is as high as five, at least
85% of total Australian population -including children- would need to be vaccinated to
achieve herd immunity. Hence the current plan to vaccinate 80% of the adult population -or
about 65% of the total population- falls far short of herd immunity. Even without herd
immunity, vaccination averts many deaths and years of life lost, by both reducing infection
(in vaccinated and unvaccinated individuals) and directly reducing severity of disease in the
vaccinee.
For lower reproduction numbers – reflective of typical Australian city undergoing partial
lockdown measures or an alternative form of mitigation – we show that targeting transmitters
first could provide a shortcut to herd immunity at lower vaccine coverage rates, compared
with untargeted strategies, or strategies targeting the vulnerable older age-groups.
The Doherty model predictions (10) (pp 1-12) for a given reproduction number are based on
similar methods (see Meehan, 2020 (6)) and are in overall alignment with this work.
Differences arise in considering plausible effective reproduction numbers in the setting of
multiple public health interventions. In particular, the need to vaccinate teenagers and even
younger children to achieve herd immunity and avoid substantial loss of life is evident when
the reproduction number is slightly higher than the Doherty input of 3.6.
This work considers pre-vaccination effective reproduction number, encompassing all public
health and individual mitigations strategies excluding vaccination ( eff ̅ ). This value changes
with public health response; under partial lockdown conditions we may expect it to be under
three, and favour targeting vaccination to high transmitters. Our baseline eff ̅ was five, to
simulate relaxation of all general mitigation measures and reliance on a specific public health
response. We also investigated a fully unmitigated epidemic in which we assume eff ̅ =7,
which would preclude herd immunity with currently available vaccines. To accommodate
uncertainty in eff ̅ , we have produced a flexible tool and open-source code to which these
emerging values can be input.
Our model has simplifications and limitations. We combine all non-vaccination public health
interventions into a single value, reflected in eff ̅ , rather than modelling them separately.
This value is fixed for each simulation, and our model examines the final size of an epidemic
not dynamic timesteps. Hence our model is not designed to predict the unfolding epidemic
curve, sequential interventions or the effects of waning immunity – the last of which remains
poorly understood. We examine outcomes of years of life lost, deaths, hospitalisations and
infections. Long-COVID is another outcome currently being quantified, which can be
estimated from our model outputs using the age-specific infections when precise data are
available but is currently not considered. Contact pattern heterogeneity is incorporated but
only to the level of 5-year age groups and uses synthetic matrices, not empirical data (12).
We do not model the impact of different occupations, or subgroups. This may lead to over-
estimation of vaccine effect if subgroups remain unvaccinated or under-estimation of the
effect of targeting high-transmitter subgroups.
The Medical Journal of Australia - Accepted Article - 6 September 2021

At the time of writing, the highest risk groups, including all Australians over 70, have had the
opportunity to be fully vaccinated, with vaccination rates (first or second dose) over 80% in
this age group (23). Australia’s current focus is vaccinating 60+ with AstraZeneca and 40-59
year-olds with Pfizer, although this is changing rapidly, particularly in hotspots. Our results
suggest that short-term future priorities should be to expand vaccination access to all ages
who are approved for Pfizer; namely, 12-39 year-olds. Supply of mRNA vaccines – Pfizer
and Moderna – is the current rate-limiting step.
As a nation, we need to start considering what level of vaccination is acceptable before
opening Australia to international travellers and transitioning away from our aggressive
control strategy. With existing intentions of the Australian population regarding vaccination,
current vaccine efficacy and the infectiousness of the Delta variant, herd immunity through
vaccination alone seems improbable. If children are vaccinated and new vaccines with long
lasting sterilising immunity become available this could change. However, even without herd
immunity, we can expect to achieve substantial reductions in deaths, hospitalisations and
years of life lost from COVID-19 provided we strategically vaccinate the majority of the
elderly and vulnerable population, then also vaccinate the highest transmitters. Therefore,
reaching herd immunity should be our aim but not be the arbiter of transition to Phase B in
the National Plan (1). Substantial levels of herd protection still occur at coverage levels lower
than that required to reach true herd immunity.

References

1. Prime Minister of Australia. National plan to transition Australia’s national COVID response
[media release]. 2 July 2021. https://www.pm.gov.au/media/national-cabinet-statement-6 (viewed
July 2021).
2. Meehan MT, Rojas DP, Adekunle AI, et al. Modelling insights into the COVID-19 pandemic.
Paediatr Respir Rev 2020; 35: 64-69.
3. Hoffmann M, Hofmann-Winkler H, Krüger N, et al. SARS-CoV-2 variant B.1.617 is resistant
to bamlanivimab and evades antibodies induced by infection and vaccination. Cell Rep 2021; 36:
109415.
4. Liu Y, Liu J, Xia H, et al. Neutralizing activity of BNT162b2-elicited serum. N Engl J Med
2021; 384: 1466-1468.
5. Lopez Bernal J, Andrews N, Gower C, et al. Effectiveness of Covid-19 vaccines against the
B.1.617.2 (Delta) variant. N Engl J Med 2021; 385: 585-594.
6. Meehan MT, Cocks DG, Caldwell JM, et al. Age-targeted dose allocation can halve COVID-
19 vaccine requirements [preprint], version 2. medRxiv 2020.10.08.20208108; 2 Dec 2020. doi:
https://doi.org/10.1101/2020.10.08.20208108 (viewed July 2021).
7. Centers for Disease Control and Prevention. Delta variant: what we know about the science.
Updated 26 Aug 2021. https://www.cdc.gov/coronavirus/2019-ncov/variants/delta-variant.html
(viewed Aug 2021).
8. Blakely A, Wilson T, Sundararajan V. COVID-19 pandemic trade-offs: version 2, July 2021,
including border opening. https://populationinterventions.science.unimelb.edu.au/pandemic-trade-
offs-july-2021 (viewed Aug 2021).
The Medical Journal of Australia - Accepted Article - 6 September 2021

9. Duckett S, Wood D, Coates B, et al. Race to 80: our best shot at living with COVID. July
2021. https://grattan.edu.au/wp-content/uploads/2021/07/Race-to-80-our-best-shot-at-living-with-
COVID-Grattan-Report.pdf (viewed Aug 2021).
10. Doherty Institute. Doherty modelling report for National Cabinet. Revised 10 Aug 2021.
https://www.doherty.edu.au/uploads/content_doc/DohertyModelling_NationalPlan_and_Addendum_2
0210810.pdf (viewed Aug 2021).
11. Australian Technical Advisory Group on Immunisation. ATAGI update following weekly
COVID-19 meeting, 7 July 2021. https://www.health.gov.au/news/atagi-update-following-weekly-
covid-19-meeting-7-july-2021 (viewed July 2021).
12. Prem K, Zandvoort KV, Klepac P, et al; Centre for the Mathematical Modelling of Infectious
Diseases COVID-19 Working Group. Projecting contact matrices in 177 geographical regions: an
update and comparison with empirical data for the COVID-19 era. PLoS Comput Biol 2021; 17:
e1009098.
13. Lopez Bernal J, Andrews N, Gower C, et al. Effectiveness of the Pfizer-BioNTech and
Oxford‒AstraZeneca vaccines on covid-19 related symptoms, hospital admissions, and mortality in
older adults in England: test negative case-control study. BMJ 2021; 373: n1088.
14. Levine-Tiefenbrun M, Yelin I, Katz R, et al. Initial report of decreased SARS-CoV-2 viral
load after inoculation with the BNT162b2 vaccine. Nat Med 2021; 27: 790-792.
15. Harris RJ, Hall JA, Zaidi A, et al. Effect of vaccination on household transmission of SARS-
CoV-2 in England. N Engl J Med 2021; 385: 759-760.
16. Stowe J, Andrews N, Gower C, et al. Effectiveness of COVID-19 vaccines against hospital
admission with the Delta (B.1.617.2) variant [preprint]. Fiocruz (The Global Health Network); 14
June 2021. https://fiocruz.tghn.org/articles/effectiveness-covid-19-vaccines-against-hospital-
admission-delta-b16172-variant (viewed Aug 2021).
17. Voysey M, Clemens SAC, Madhi SA, et al. Safety and efficacy of the ChAdOx1 nCoV-19
vaccine (AZD1222) against SARS-CoV-2: an interim analysis of four randomised controlled trials in
Brazil, South Africa, and the UK. Lancet 2021; 397: 99-111.
18. Davies NG, Klepac P, Liu Y, et al. Age-dependent effects in the transmission and control of
COVID-19 epidemics. Nat Med 2020; 26: 1205-1211.
19. Diekmann O, Heesterbeek JA, Roberts MG. The construction of next-generation matrices for
compartmental epidemic models. J R Soc Interface 2010; 7: 873-885.
20. Andreasen V. The final size of an epidemic and its relation to the basic reproduction number.
Bull Math Biol 2011; 73: 2305-2321.
21. O’Driscoll M, Ribeiro Dos Santos G, Wang L, et al. Age-specific mortality and immunity
patterns of SARS-CoV-2. Nature 2021; 590: 140-145.
22. Fisman DN, Tuite AR. Progressive increase in virulence of novel SARS-CoV-2 variants in
Ontario, Canada [preprint], version 3. medRxiv 2021.07.05.21260050; 4 Aug 2021. doi:
https://doi.org/10.1101/2021.07.05.21260050 (viewed Aug 2021).
23. Australian Department of Health. COVID-19 vaccination: doses by age and sex. Updated 26
Aug 2021. https://www.health.gov.au/resources/publications/covid-19-vaccination-doses-by-age-and-
sex (viewed Aug 2021).
The Medical Journal of Australia - Accepted Article - 6 September 2021

Table 1. Inputs into the model for vaccine efficacy against the Delta variant of SARS-CoV-2.
 Vaccine Va Vs Reduction in References Vt References Vm References
 symptomatic
 COVID (Ve)
 Pfizer 0.76 0.50 0.88 (5, 13, 14) 0.5 (15) 0.5 (16)
 AstraZeneca 0.48 0.37 0.67 (5, 13, 17) 0.5 (15) 0.8 (16)
The Medical Journal of Australia - Accepted Article - 6 September 2021

Figure 1. Model predictions for the impact of different vaccine programs: Pfizer, AstraZeneca
or Mixed, indicated by column. Each is considered for values of eff ̅ of 3, 5 and 7, indicated
by rows. Vaccine uptake ceiling is fixed at 90%. For each subgraph there are three strategies
(vulnerable, transmitters and untargeted), indicated by colours, and two age of vaccine cut-
offs (5 years and 15 years), indicated by line type. Panel a shows coverage versus infections
and panel b shows coverage versus years of life lost.
a. Coverage versus infections

b. Coverage versus years of life lost
The Medical Journal of Australia - Accepted Article - 6 September 2021

Figure 2 Total deaths for the three different strategies of age-specific vaccine coverage for
the Mixed program, eff ̅ = 5 and uptake =90%. Panel a) presents estimates for an age cut-
off for vaccination of 5 years and panel b) shows results for vaccination age cut-off of 15.
The expected number of deaths (in a completed outbreak in a fully unvaccinated population)
is the height of the stacked bar of both red and blue colours. We have divided the averted
deaths into those who became infected but did not die as a result of being vaccinated (light
blue) and those who did not become infected, as a result of personal or herd immunity (dark
blue).

 a. Vaccine eligibility age: over 5 years

 b. Vaccine eligibility age: over 15 years
The Medical Journal of Australia - Accepted Article - 6 September 2021

Modelling direct and herd protection effects of vaccination against
the SARS-CoV-2 Delta variant in Australia: Technical appendix

1 Non-technical explanation of methods
We build a 16 by 16 next generation matrix which provides the class-specific reproduction number
for each of 16 age-classes {0 − 4, 5 − 9, 10 − 14, … , 70 − 74, 75+}. For example, the value in row
0-4 column 0-4 is the expected number of 0-4 year olds infected by a typical 0-4 year old case
throughout their infectious period.

To build this matrix, we start with the age-based contact matrix for Australia, published by Prem et
al. (2021) (1) which is also 16x16 and based on 5-year age groups, Figure A, left panel. We modify
this by changing the risk of transmission per contact according to the age of the transmitter and the
age of the susceptible receiver of contacts (Davies et al. 2020, (2)). Each cell is then multiplied
through by the duration of infection and scaled to ensure that it calibrates to the effective
reproduction number under investigation, shown in Figure A1 right panel. It can be seen that the
highest transmitters are in the 15 to 50 year old groups.

Figure A1. Left panel provides the age specific contact matrix for Australia, taken from Prem et al.
(2021). Right panel provides the next generation matrix based on Prem and modified for
infectiousness susceptibility, duration of infection and scaling constant.

We then expand the matrix further to account for vaccinated and unvaccinated in each age group
(yielding a 32 x 32 element matrix) and apply the effects of vaccine on both susceptibility and
infectiousness to the next generation matrix.

From the next generation matrix, we can derive the effective reproduction number (as the dominant
eigenvalue) and the final size (total number of infections at the end of a completed epidemic) using
an adaptation of well-known final size methods, described in detail in section 2. This latter value is
age-specific and vaccine status-specific, allowing the following further estimates to be made: death
and hospitalisation rates modified by age and vaccination status, years of life lost, and relative
proportions of vaccinated and unvaccinated populations infected or dying.
The Medical Journal of Australia - Accepted Article - 6 September 2021
2 Mathematical methods
To model the transmission of SARS-CoV-2 we stratify the population into 16 5-year age bands ∈
{0 − 4, 5 − 9, 10 − 14, … , 70 − 74, 75+} and assume that individuals in age group possess a
relative susceptibility to infection . Once infected, an age-dependent fraction go on to develop
symptomatic (i.e., clinical) disease whilst the remaining 1 − develop asymptomatic (i.e., sub-
clinical) disease. We assume that individuals in the sub-clinical class are less infectious than those in
the clinical class by a relative factor (baseline value 0.25 (2-7)) and that the total time spent
infectious for both classes is days.
Each day, each individual in age group makes ′ contacts with individuals in age group ′ leading
to the following expression for the (unscaled) next-generation matrix (NGM) (Diekmann et al. 2010
(8)):
′
̅ ′ =
[ ′ + (1 − ′ ) ]
′
where is the number of susceptible individuals in age group and ′ is the total number of
individuals in age group ′. We allow that prior to vaccination an age-specific fraction of
individuals have immunity as a result of previous infection, such that = (1 − ) .
The ( , ′)th entry of the 16 × 16 NGM ̅ is proportional to the average number of new infections
in age group generated by an individual in age group ′ over their infectious lifetime. To calculate
the actual number of infections generated by each individual these entries must be scaled by the
(pseudo-)probability of transmission given contact, which we denote . In particular, the effective
reproduction number in the absence of vaccination, eff ̅ , which is proportional to the maximal
̅ (or (
eigenvalue, or spectral radius of ̅ )), can be expressed as
eff ̅
̅ )
eff ̅ = ( ⇒ =
̅ )
(
Incorporating this definition of along with the possibility of pre-existing immunity the next-
generation matrix is given by
′
′ = ⋅ [ ′ + (1 − ′ ) ] .
′
For a given eff ̅ we use the expression given above to calculate the scaling factor in terms of eff ̅
and ( ̅ ). Daily, age-specific contact rates ′ are provided by the synthetic matrices presented in
(Prem et al. 2021).
2.1 Incorporating vaccination
In the presence of vaccination we further subdivide the population into those who are vaccinated
and those who are unvaccinated. Individuals who are vaccinated experience a reduced risk of
acquiring infection (by a factor 1 − ), a reduced risk of symptomatic disease (by a factor 1 − ),
a reduced risk of hospitalisation or death (by a factor 1 − ) and are potentially less infectious (by
a factor 1 − ). Each of these factors is dependent on the combination of SARS-CoV-2 strain and
vaccine. If a proportion of individuals in age group are vaccinated, then the modified 16 × 16
next-generation matrix in the presence of vaccination is given byThe Medical Journal of Australia - Accepted Article - 6 September 2021
′
vac ′ = ⋅ {[ ′ + (1 − ′ ) ](1 − ′ )
′
+ [(1 − ) ′ + (1 − (1 − ) ′ ) ](1 − )(1 − ) ′ } .
Note that this expression does not include the reduced risk of hospitalisation or death (1 − ) as
this is assumed to impact patient outcome only, and have no effect on transmission.
Further, this expression only stratifies the population according to age (i.e., the indices , ′ only
index the 16 age groups introduced above). If we wish to additionally track the transmission rates
between individuals of different ages and different vaccination status, then we can use the
expanded (32 × 32) next-generation matrix ̃ , which can be expressed as the matrix product:
̃=[ 1−
[ ]
(1 − ) ]
where the terms 1 − and (1 − ) in the first factor are 16 × 16 diagonal matrices, the matrix
is defined above and
= ⋅ [(1 − ⋅ ) + (1 − (1 − ⋅ ) ) ](1 − ⋅ ) .
The indices , in the expression above span the full set of 32 possible age-group x vaccination
categories.
2.2 Calculating the final size and disease-related mortality
To calculate the total number of infections and deaths throughout the course of an epidemic wave
we use the vectorised form of the final size equation given by (Andreasen 2011(9)):
̃ −1 ∑
1 − ̃ = exp [− ̃
̃ ̃ ]
where ̃ is the fraction of individuals in group that become infected throughout the epidemic, ̃ is
̃
the population size of group and is the extended next-generation matrix defined in the previous
section. Note that here we use the extended (32 × 32) next-generation matrix ̃ that stratifies by
both age and vaccination status because the infection-fatality rate for vaccinated individuals is
reduced by a factor (1 − ) × (1 − ) relative to those that are unvaccinated. Moreover, the
population size ̃ = ((1 − ) , ) is a combined vector of the number of vaccinated and
unvaccinated individuals in each age group.
Solving the final size equation numerically, we can determine the total number of deaths using the
following expression:
= Unvaccinated deaths + Vaccinated deaths
= ∑ (1 − )(1 − ) + ∑ (1 − )(1 − ) (1 − )
∈{0−4,…,75+} ∈{0−4,…,75+}
= ∑ [ (1 − ) + (1 − )(1 − ) ](1 − )
∈{0−4,…,75+}
where is the age-specific infection-fatality rate (O’Driscoll et al. 2020(10), Fisman et al. 2021(11)),
and and are the fractions of the unvaccinated and vaccinated populations in each age groupThe Medical Journal of Australia - Accepted Article - 6 September 2021
that become infected, respectively. The values are listed in Table 2. Using the total numbers of
deaths in each group and the life expectancy we also estimate the years of life lost (see Table 2).
Similarly, the total number of hospitalisation is calculated as
= Unvaccinated hospitalisations + Vaccinated hospitalisations
= ∑ ℎ [ (1 − ) + (1 − )(1 − ) ](1 − )
∈{0−4,…,75+}
where ℎ is the age-specific hospitalisation rate.The Medical Journal of Australia - Accepted Article - 6 September 2021 3. Parameter values Table 1. Model parameters. Parameter Description Value Relative susceptibility of age group See Table 2 Fraction of infected individuals in age group that develop See Table 2 clinical symptoms Infectious period 5.0 days Relative infectiousness of asymptomatic individuals 0.25 Fraction of individuals in age group with pre-existing 0.016 immunity (Pseudo-)Probability of transmission given contact Fitted Proportion of vaccinated individuals in age group Variable Table 2. Age-specific epidemiological parameters. Data for age-specific relative susceptibility and clinical fraction taken from (Davies et al. 2020 (2)); data for hospitalisation and infection-fatality rate taken from (Walker et al. 2020) and (O’Driscoll et al. 2020 (10)), respectively; life expectancy table interpolated from Australian Bureau of Statistics (12). **Note that the age-specific hospitalisation and infection-fatality rates provided below are specific to the wild-type SARS-CoV-2 strain. In our analysis, these values are scaled by the odds ratios given in Table 3. Age group Relative Clinical Hospitalisation Infection- Life (years) susceptibility fraction rate** fatality rate** expectancy ( )* ( ) (ℎ ) ( ) (years) 0-4 0.39 0.28 0.001 2.98E-05 81.1 5-9 0.39 0.28 0.001 6.9E-06 81.2 10-14 0.38 0.2 0.001 1.1E-05 81.3 15-19 0.38 0.2 0.002 2.57E-05 81.4 20-24 0.79 0.26 0.005 7.88E-05 81.5 25-29 0.79 0.26 0.01 0.000171 81.7 30-34 0.87 0.33 0.016 0.00033 81.9 35-39 0.87 0.33 0.023 0.000545 82.2 40-44 0.80 0.4 0.029 0.001052 82.4 45-49 0.80 0.4 0.039 0.001675 82.8 50-54 0.82 0.49 0.058 0.002992 83.4 55-59 0.82 0.49 0.072 0.004583 84.1 60-64 0.89 0.63 0.102 0.006017 84.7 65-69 0.89 0.63 0.117 0.015209 85.8 70-74 0.74 0.69 0.146 0.024209 87.4 75+ 0.74 0.69 0.177 0.043257 89.0 *these values are as published, and are later scaled, so the relative values are more important than the absolute values
The Medical Journal of Australia - Accepted Article - 6 September 2021

Table 3. (Adjusted) Odds ratios for hospitalisation and infection for Delta variant relative to non-
VOC strains (Fisman et al. 2021 (11)).

 Outcome Odds ratio (95% CI)
 Hospitalisation 2.08 (1.80, 2.38)

 Death 2.32 (1.47, 3.30)

Table 4. Vaccine efficacy.
 Vaccine Clinical trial Efficacy Efficacy against Efficacy Efficacy against
 efficacy against symptomatic against severe disease
 ( ) acquisition disease transmission given
 (95% CI) ( ) ( ) ( ) symptomatic
 disease
 ( )
 BNT162b2 0.880
 0.76 0.5 0.5 0.5
 (Pfizer) (0.853, 0.901)
 ChAdOx1 0.670
 0.48 0.37 0.5
 (AstraZeneca) (0.613, 0.718) 0.8
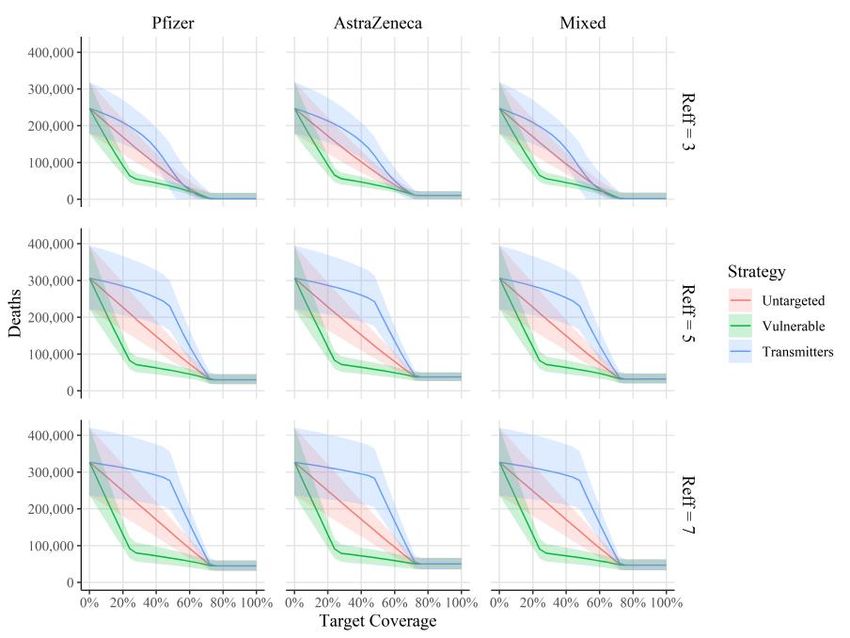
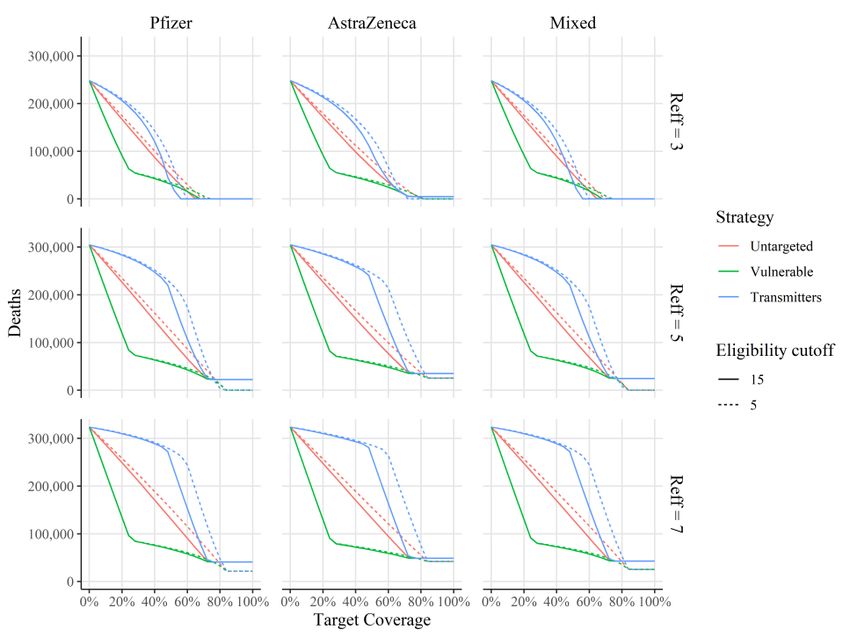
The Medical Journal of Australia - Accepted Article - 6 September 2021

4. Hospitalisation and deaths
a. Coverage versus hospitalisations

b. Coverage versus deaths

Figure A2. Model predictions for the impact of different vaccine programs: Pfizer, AstraZeneca or
Mixed, indicated by column. Each is considered for values of eff ̅ of 3, 5 and 7, indicated by rows.
Vaccine uptake is fixed at 90%. For each subgraph there are three strategies (vulnerable,
transmitters and untargeted), indicated by colours, and two age of vaccine cut-offs (5 years and 15
years), indicated by line type. Panel a shows coverage versus hospitalisations and panel b shows
coverage versus deaths.
The Medical Journal of Australia - Accepted Article - 6 September 2021

5. Sensitivity analysis
Owing to the relatively recent emergence and dominance of the Delta variant of SARS-CoV-2, several
of the parameters used in our primary analysis remain considerably uncertain. Outcome sensitivity
to the most central of these, the effective reproduction number in the absence of vaccination ( eff ̅ ),
is explored in the main article; however, uncertainty in the remaining model parameters may still
have significant impacts on our results.

To encapsulate this uncertainty and explore their effect on each of our measured outcomes, we
conducted a Monte-Carlo-type sensitivity analysis where 1,000 parameter combinations were drawn
from the probability distributions described in Table 5 using Latin-Hypercube-Sampling. Given these
parameter combinations, we then forward-simulated our model (i.e., solved the generalised final
size equation) to calculate the cumulative number of infections, hospitalisations, deaths and years of
life lost. The results of this analysis are presented in Figure A3. Note, for clarity, we also reproduce
the first panel of Figure A3 (infections v. coverage) in Figure A4 using a discrete x-axis.

Table 5. Monte Carlo parameter distributions
 Parameter Description Central estimate Monte Carlo
 (95% CI) or (Range) distribution
 Relative infectiousness 0.25 Triangular(
 of asymptomatic (Range: 0.15, 1) Min = 0.15,
 individuals Mode = 0.25,
 Max = 1
 )
 Pfizer Clinical efficacy of Pfizer 0.880 Triangular(
 at preventing (95% CI: 0.853, 0.901) Min = 0.853,
 symptomatic COVID-19 Mode = 0.880,
 Max = 0.901
 )
 AstraZeneca Clinical efficacy of 0.670 Triangular(
 AstraZeneca at (95% CI: 0.613, 0.718) Min = 0.613,
 preventing Mode = 0.670,
 symptomatic COVID-19 Max = 0.718
 )
 hospitalisation Odds ratio of 2.08 Triangular(
 hospitalisation for Delta (95% CI: 1.80, 2.38) Min = 1.80,
 variant (relative non- Mode = 2.08,
 VOCs) Max = 2.38
 )
 death Odds ratio of death for 2.32 Triangular(
 Delta variant (relative (95% CI: 1.47, 3.30) Min = 1.47,
 non-VOCs) Mode = 2.32,
 Max = 3.30
 )

Note that overall vaccine efficacy is not a direct model input. Instead, we decompose this value
into a component responsible for conferring protection against acquisition of infection ( ), and the
remainder into conferring protection against developing symptomatic disease given infection ( ).
The decomposition is conducted randomly using a uniform distribution to first assign the value of
(which ranges from 0.25 times the overall vaccine efficacy up to the overall vaccine efficacy):
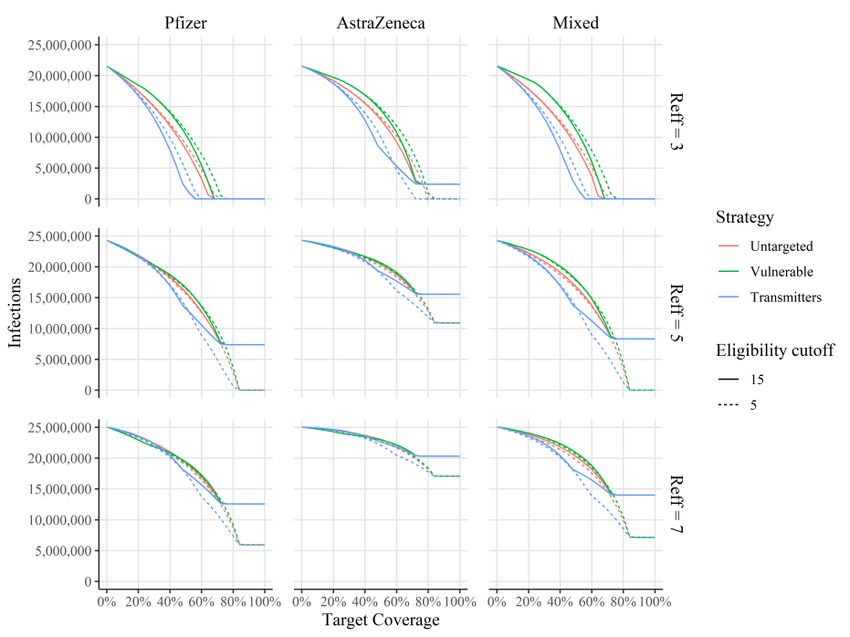
The Medical Journal of Australia - Accepted Article - 6 September 2021

 ∼ (0.25 × , )
and then back-calculating to preserve the overall vaccine efficacy :
 1 −
 = 1 − .
 1 −
a. Coverage versus infections

b. Coverage versus hospitalisations
The Medical Journal of Australia - Accepted Article - 6 September 2021

c. Coverage versus deaths

d. Coverage versus years of life lost

Figure A3. Sensitivity analysis for model predictions for the impact of different vaccine programs:
Pfizer, AstraZeneca or Mixed, indicated by column. Each is considered for values of eff ̅ of 3, 5 and
7, indicated by rows. Vaccine uptake is fixed at 90% and eligibility age at 15. For each subgraph there
are three strategies (vulnerable, transmitters and untargeted), indicated by colours. Panel a shows
coverage versus infections; panel b shows coverage versus hospitalisations; panel c shows coverage
versus deaths; and panel d shows coverage versus years of life lost. The central line in each subpanel
for each vaccination strategy gives the median outcome estimate across the range of sampled
parameters, whilst the upper and lower limits of each ribbon give the 95% central confidence
interval.
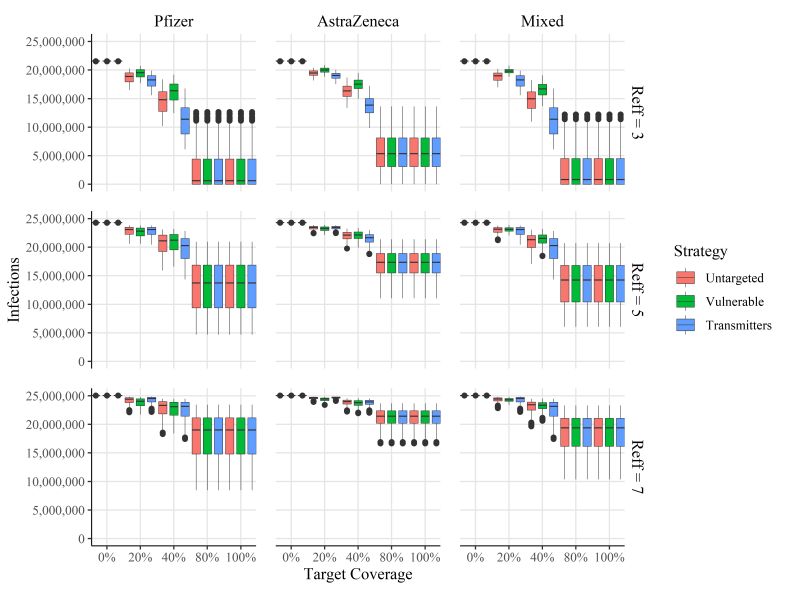
The Medical Journal of Australia - Accepted Article - 6 September 2021

Figure A4. Reproduction of Figure A3, panel a using a discrete coverage lattice. Sensitivity analysis
for model predictions for the impact of different vaccine programs: Pfizer, AstraZeneca or Mixed,
indicated by column. Each is considered for values of eff ̅ of 3, 5 and 7, indicated by rows. Vaccine
uptake is fixed at 90% and eligibility age at 15. For each subgraph there are three strategies
(vulnerable, transmitters and untargeted), indicated by colours.
Incorporating uncertainty into the parameters described in Table 5, we find an apparent increase in
the overlap between the performance of each of the three vaccination strategies (untargeted,
vulnerable and transmitters) across the different outcomes; however, we emphasise that the ranking
described in the main article is largely preserved for fixed parameter values (e.g., equal vaccine
efficacy, relative infectiousness). Notably, the range of predicted values can vary considerably for
certain outcomes when parameter uncertainty is included; however, our conclusions regarding the
predicted capacity for vaccination to achieve herd immunity remain robust. That is, across the
parameter ranges considered, herd immunity remains unachievable for eff ̅ ≥ 5 whilst vaccine
eligibility is constrained to those over 15 years of age (which is the case for all panels in Figure A3.)
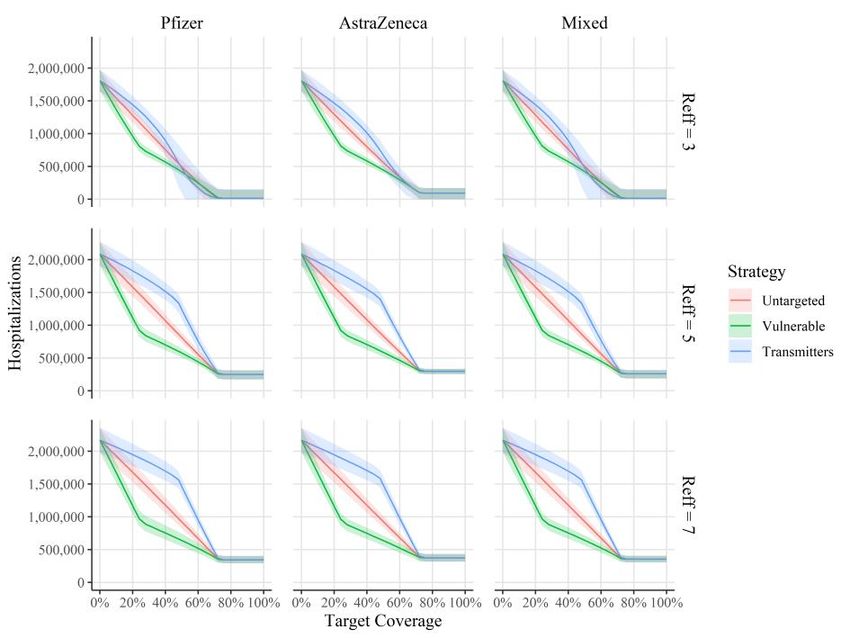
The Medical Journal of Australia - Accepted Article - 6 September 2021

5.1 Contact matrix
In a sensitivity analysis, we used an alternative approach to generate the age-specific contact rates
 . These rates were obtained by extrapolating the contact rates estimated for the United Kingdom
(UK), where a contact survey was conducted in 2005-2006 (13). We used the R package socialmixr (v
 POLYMOD
0.1.8) to extract the UK age-specific contact rates ( ) emerging from the contact survey. We
then applied age-specific adjustments to account for age distribution differences between Australia
and the UK, such that

 POLYMOD
 AUS
 = × ,
 UK
where AUS and UK are the proportion of the population aged in Australia and the UK,
respectively. The results are shown in Figure A5.

a. Coverage versus infections

b. Coverage versus hospitalisations
The Medical Journal of Australia - Accepted Article - 6 September 2021

c. Coverage versus deaths

d. Coverage versus years of life lost

Figure A5. Contact sensitivity analysis for model predictions for the impact of different vaccine
programs: Pfizer, AstraZeneca or Mixed, indicated by column. Each is considered for values of eff ̅
of 3, 5 and 7, indicated by rows. Vaccine uptake is fixed at 90% and eligibility age at 15. For each
subgraph there are three strategies (vulnerable, transmitters and untargeted), indicated by colours.
Panel a shows coverage versus infections; panel b shows coverage versus hospitalisations; panel c
shows coverage versus deaths; and panel d shows coverage versus years of life lost. The central line
in each subpanel for each vaccination strategy gives the median outcome estimate across the range
of sampled parameters, whilst the upper and lower limits of each ribbon give the 95% central
confidence interval.
The Medical Journal of Australia - Accepted Article - 6 September 2021

References
1. Prem K, Zandvoort KV, Klepac P, et al; Centre for the Mathematical Modelling of Infectious
Diseases COVID-19 Working Group. Projecting contact matrices in 177 geographical regions: an
update and comparison with empirical data for the COVID-19 era. PLoS Comput Biol 2021; 17:
e1009098.
2. Davies NG, Klepac P, Liu Y, et al. Age-dependent effects in the transmission and control of
COVID-19 epidemics. Nat Med 2020; 26: 1205-1211.
3. Buitrago-Garcia D, Egli-Gany D, Counotte MJ, et al. Occurrence and transmission potential
of asymptomatic and presymptomatic SARS-CoV-2 infections: a living systematic review and meta-
analysis. PLoS Med 2020; 17: e1003346.
4. Nakajo K, Nishiura H. Transmissibility of asymptomatic COVID-19: data from Japanese
clusters. Int J Infect Dis 2021; 105: 236-238.
5. Qiu X, Nergiz AI, Maraolo AE, et al. Defining the role of asymptomatic and pre-symptomatic
SARS-CoV-2 transmission: a living systematic review. Clin Microbiol Infect 2021; 27: 511-519.
6. Sayampanathan AA, Heng CS, Pin PH, et al. Infectivity of asymptomatic versus symptomatic
COVID-19. Lancet 2021; 397: 93-94.
7. Yan D, Zhang X, Chen C, et al. Characteristics of viral shedding time in SARS-CoV-2
infections: a systematic review and meta-analysis. Front Public Health 2021; 9: 209.
8. Diekmann O, Heesterbeek JA, Roberts MG. The construction of next-generation matrices for
compartmental epidemic models. J R Soc Interface 2010; 7: 873-885.
9. Andreasen V. The final size of an epidemic and its relation to the basic reproduction number.
Bull Math Biol 2011; 73: 2305-2321.
10. O’Driscoll M, Ribeiro Dos Santos G, Wang L, et al. Age-specific mortality and immunity
patterns of SARS-CoV-2. Nature 2021; 590: 140-145.
11. Fisman DN, Tuite AR. Progressive increase in virulence of novel SARS-CoV-2 variants in
Ontario, Canada [preprint], version 3. medRxiv 2021.07.05.21260050; 4 Aug 2021. doi:
https://doi.org/10.1101/2021.07.05.21260050 (viewed Aug 2021).
12. Australian Bureau of Statistics. Deaths in Australia. Updated 25 June 2021.
https://www.aihw.gov.au/reports/life-expectancy-death/deaths-in-australia/contents/life-expectancy
(viewed Aug 2021).
13. Mossong J, Hens N, Jit M, Beutels P, Auranen K, Mikolajczyk R, et al. Social contacts and
mixing patterns relevant to the spread of infectious diseases. PLoS Med 2008; 5: e74.
You can also read