Driving returns and profitable growth in European aviation - 10 September 2013
←
→
Page content transcription
If your browser does not render page correctly, please read the page content below
Driving returns and
profitable growth in
  European aviation
      10 September 2013

                          1
Agenda

Introduction                            Carolyn McCall, CEO

Build No.1 and No.2 network positions   Carolyn McCall, CEO

Maintain cost advantage                 Warwick Brady, Chief Operations Officer

Drive demand, conversion and yield      Peter Duffy, Group Marketing Director

Capital discipline                      Chris Kennedy, CFO

Summary                                 Carolyn McCall, CEO

                                                                                2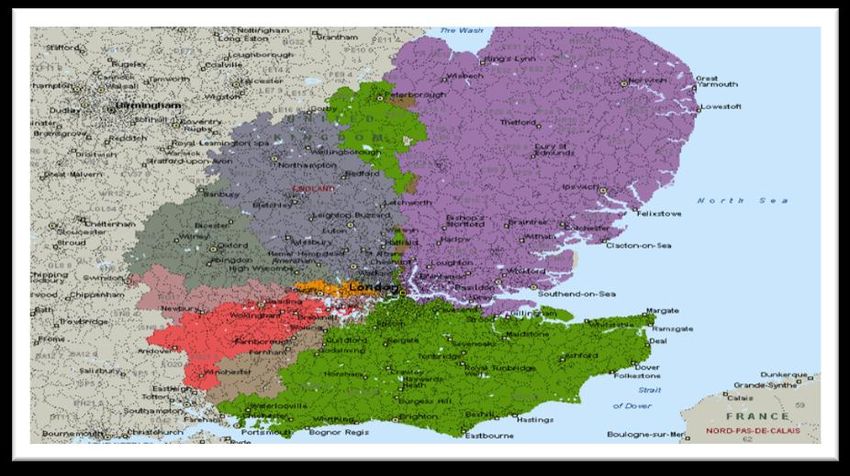
Europe's leading short haul air travel network
•   60.5m passengers, 67.8m seats flown
    load factors 89.2% (1)
•   fleet of 212 aircraft with an average
    fleet age of 4.9 years
•   leading presence on Europe’s top
    100 routes
•   over 612 routes across more than
    30 countries
•   strong position in key markets:
    No.1 in London Gatwick, Milan, Geneva
•   employs over 8,000 people including
    2,000 pilots and 4,500 cabin crew
•   300 million people live within a one
    hour drive of an easyJet airport

                  (1) As at 31 August 2013 or 12 months to 31 August 2013   3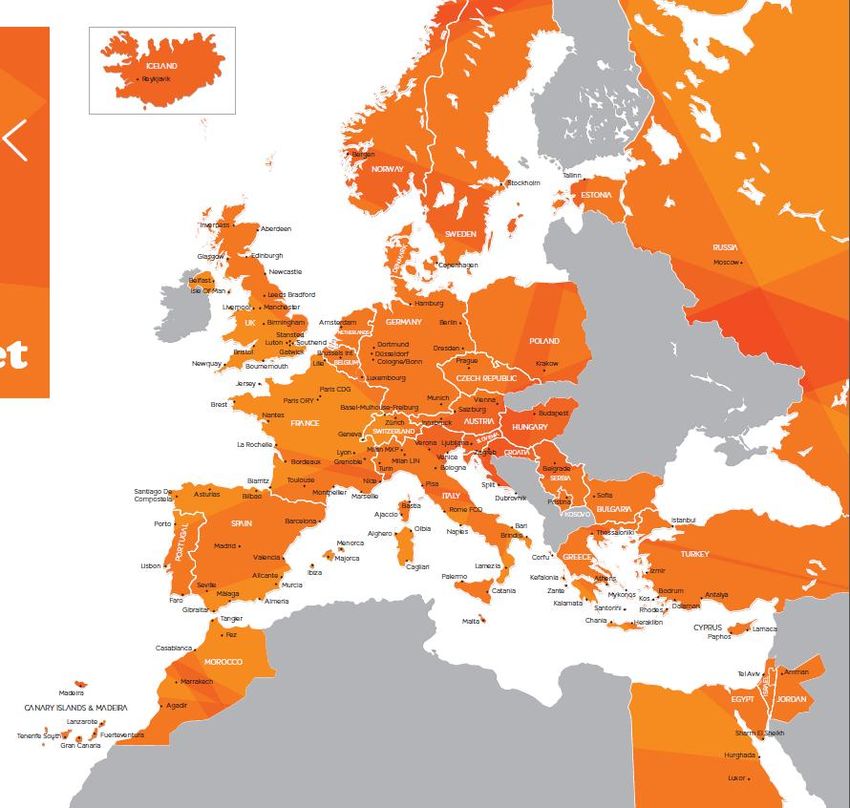
Delivering returns and profitable growth

                                                                                            Growing returns
                                                                                            ROCE incl. lease adjustments                              16%

                                                                                                                                       11%
                                                                                                                       10%
                                                                                                             7%
Competitive advantages
                                                                                                 4%

1. Efficient, low cost model
                                                                                                 2009       2010        2011           2012           Mar'13
                                                                                                                                                   (annualised)
2. Strong network and market
   positions                                                                                Profit per seat and margin growth
                                                                                        8                                                              c.11%
                                                                                        7
3. easyJet.com and brand                                                                6                                             8.2%             >£6
                                                                                                                                                       >£6
                                                                                                                      7.2%
                                                                                        5                 6.3%
4. Strong balance sheet                                                   P BT / seat   4                                              4.81
                                                                                        3
                                                                                                                      3.97
                                                                                                          3.36
                                                                                        2
                                                                                               1.6%
                                                                                        1
                                                                                               0.83
                                                                                        0
                                                                                               2009        2010        2011            2012        2013 consensus

                                                                                                         PBT / seat                   PBT margin

                                                                                                                                                                Year
             Source: Bloomberg consensus profit before tax of £470m for the financial year ending 30 September 2013. Data as at 6 September 2013
                                                                                                                                                            4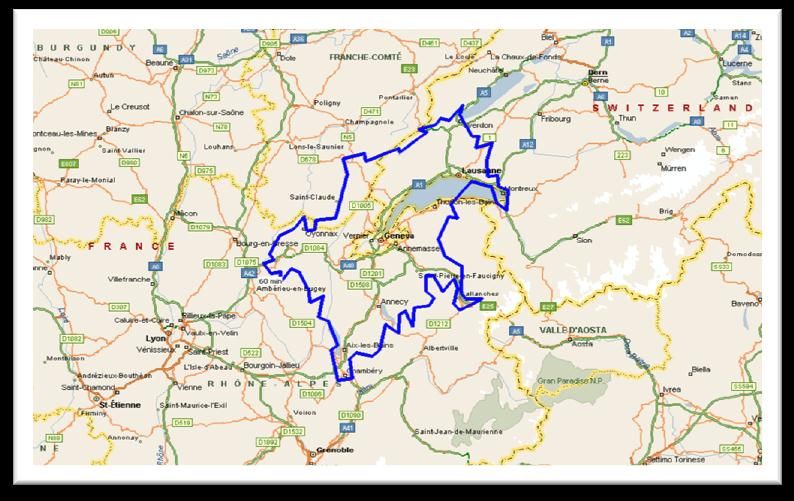
Evolving industry dynamics

          Competition                                 Consumers
          & supply                                    • Continue to value low
       • Restructuring                                  fares and convenience
         and
                                                      • Price, frequency and
         consolidation
                                                        availability are key
       • Legacy losses
       • Convergence of
         models                       well
       • New fleet                 positioned
         orders from                to be a
         successful
         airlines
                                   structural
                                    winner

                          Government
                          • Rising airport charges
                            and taxes
                          • Infrastructure projects
                            need funding

                                                                                5
easyJet’s competitive position
On an airport pairs basis, easyJet’s main competitors are the legacy carriers

                               60%

                               50%                                                                        IAG

                                                                                                                                                               Air France
                                                                                                                                                                  KLM
                               40%
   % Overlap on a city basis

                                                                 Ryanair
                               30%
                                                                                                                                           Network / legacy carriers

                                               Lufthansa Grp
                                                                                                                                           Low-cost competition
                               20%                                                            Alitalia
                                                                                                                                           Charter carriers
                                                                                                                                                                                      CompDrop
                                                                                                                                                                                      CompDrop
                                                                                                                                                                                      CompDrop
                               10%          Air                        TUI                                                          Size of bubble reflects market share              CompDrop
                                           Berlin      Vueling                                                                                                                        CompDrop
                                                                   Monarch                                                          in European short haul market                     CompDrop
                                                       Thomas                                                                                                                         CompDrop
                                                        Cook                                                                                                                          CompDrop
                                                Jet2
                                       Wizz                                                                                                                                           CompDrop
                                0%                                                                                                                                                    CompDrop
                                               Norwegian                                                                                                                              CompDrop
                                                                                                                                                                                      CompDrop
                                                                                                                                                                                      CompDrop
                                                                                                         % overlap on an airport pairs basis                                          CompDrop

                               -10%
                                      0%                          5%                    10%                       15%                20%               25%                  30%

                                                       Source: easyJet analysis using OAG                                                                                         6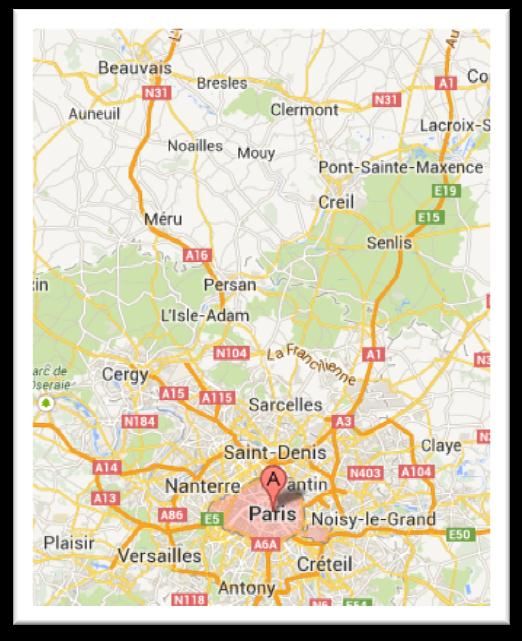
Structural advantage against legacies

On-going cost advantage           Typical A320 aircraft   easyJet      Typical Legacy
against legacies and              Seats                     180                  156
charter airlines
                                  Load factor              90%                  70%
• Seat density
                                  Passengers / flight       162                  109
• Load factors
                                  Daily sectors            5.45                    4
• Point to point vs. feeder
                                  Revenue / a.c.per day   £278k                £278k
• Fleet
                                  Ave fare                £68/pax            £136/pax
• Pensions / crew costs                                             Source: Redburn, 13 March 2013

• Overheads
                                  Legacy would have to charge double easyJet
                                  fare to generate same revenue per aircraft

  Cost advantage and ability to offer affordable fares allows easyJet to continue
               to grow profitably and to take share from legacies

                                                                                             7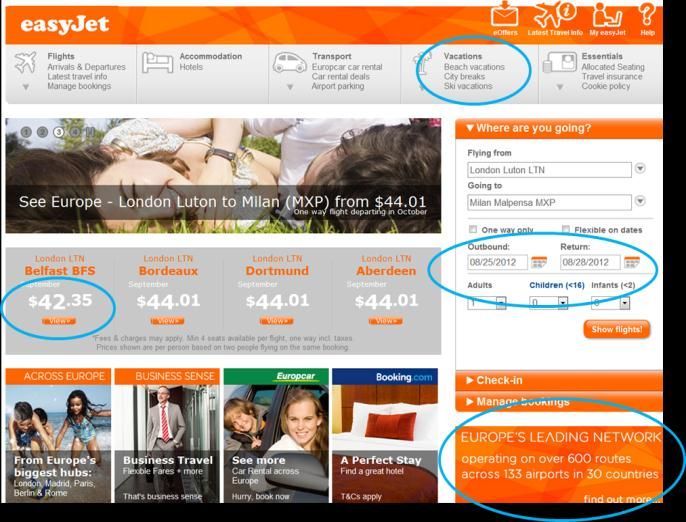
Winning against low-cost competition
                                                      London Gatwick arrival / departures slots
•   Strength of network                               0600-0855 Summer ‘13

    • Pan-European network and
      market presence                                     Norwegian             Other
                                                             4%                  12%
    • No. 1 or 2 positions at primary
      airports                                        Thomas Cook
                                                          4%
                                                                                                     easyJet
    • Peak slots                                        Monarch                                       41%
                                                          6%
•   Strong balance sheet
                                                                  FlyBE
•   Scale and purchasing power                                     8%

•   Pan-European brand                                                    TUI
                                                                          8%
                                                                                   British Airways
•   easyJet.com                                                                          17%

•   Friendly service
                                                      easyJet has strong position in London
                                                      Gatwick first wave – enables large portfolio
                                                      of business friendly timings

                Source:
                ACL (Airport Coordination Limited)                                                             8
                https://www.online-coordination.com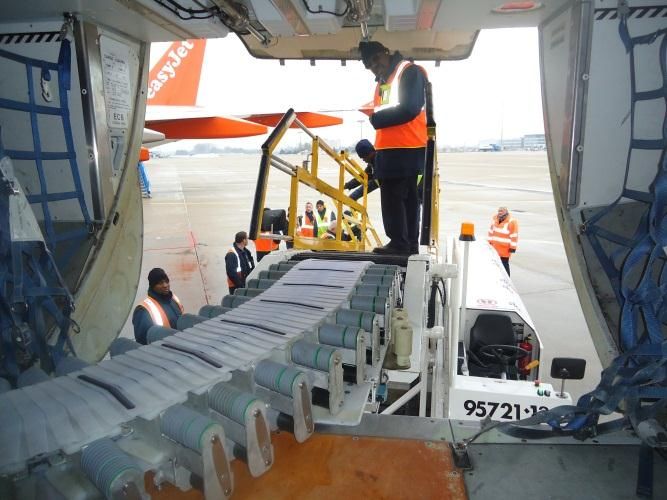
Strategy to drive growth and returns
Leverage easyJet’s cost advantage, leading market positions and brand
to deliver point-to-point low fares with operational efficiency and
friendly service for our customers

1.   Build strong number 1 and 2        • Sustainable growth
     network positions                     •   slightly in excess of market
2. Maintain cost advantage                     c. 3% to 5% per annum

3. Drive demand, conversion             • Improved returns
   and yield across Europe              • Tangible and regular cash
4. Disciplined use of capital             returns via 3x cover dividend

                                                                              9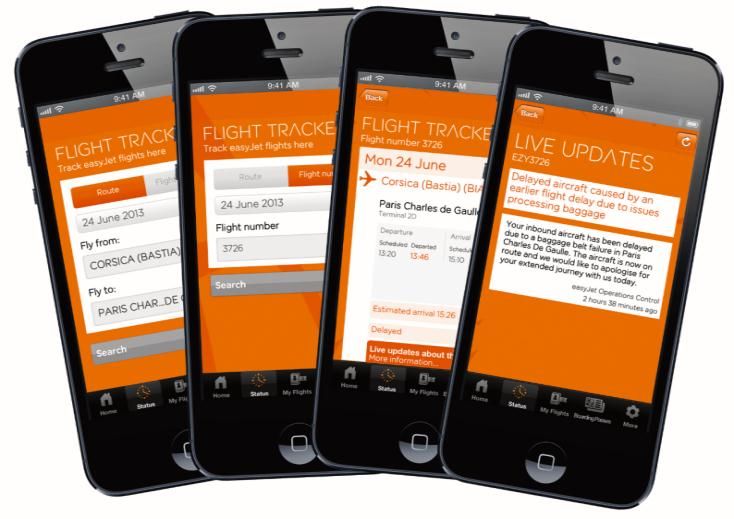
Building strong
  no 1 and no 2
Network positions
     Carolyn McCall
   Chief Executive Officer

                             10
European airport landscape
Capacity across all European airports Slot constrained airports
• easyJet has c.70% of its
capacity at ‘Level 3’ slot
constrained airports
Top 20
• ‘Level 3’ airports are slot
airports
constrained airports where
c.40%
airlines are allocated slots
Remaining and fines are incurred by
531 airports airlines for not using them
c.60% • e.g. London Gatwick – up to
52 slots an hour
• easyJet’s slot portfolio has
taken over 15 years to build
easyJet is present in all but 6 of Europe’s top 20 airports
Source: OAG 11easyJet has strong positions in key cities
Paris Milan
Beauvais
Malpensa
Bergamo
Charles
de Gaulle Linate
Orly
Milan Malpensa
Charles de Gaulle • Largest airport in Milan with c.17m passengers
a year
• 3rd largest airport in Europe • Attractive catchment area, also near Italy’s 4th
• c.43m seats a year largest city Turin
• easyJet #2 with 10.7% market share • easyJet #1 with 40.5% market share
Orly • easyJet’s 2nd largest base
• c.28m seats a year Milan Linate
• easyJet #2 12.4% market share • c.13m passengers
12Leading positions across Europe
easyJet capacity easyJet’s #1 and #2 positions
EDI
Other
16m
24% LPL
No.1 LTN STN
SEN
31m
LGW
46%
CDG
BSL
GVA
No. 2 LYS
21m
30%
OLB
ALC
AGP
• Majority of easyJet’s
capacity is in airports where
it has leading positions
Source: OAG 13Leading position on top 100 European markets
Presence in top 100 market pairs
50
45 1 Non primary airports
40
35
30
16
25
45 2
20
15 33
24 21 22
10 20 18 16 15 14
5
- 3
• easyJet has a strong position across much of Europe on the top 100 markets
• From all the EU city pairs, the top 100 routes have a 24% capacity share
• easyJet’s capacity share of the top 100 is 12.4%
• 35% of easyJet’s overall capacity is on the top 100 routes
Source: OAG, easyJet 14easyJet is the No.1 airline at Geneva
Increase in capacity… …has delivered sustainable returns
easyJet Lufthansa Grp
Seats Air France-KLM Grp IAG
Returns Seats Returns Seats
8
£2,500 7.5
7
Millions
Millions
6 £2,000 6.0
5
£1,500 4.5
4
3 £1,000 3.0
2
£500 1.5
1
0 £0 0.0
2006 2007 2008 2009 2010 2011 2012 2013 FY08 FY09 FY10 FY11 FY12
Market characteristics Geneva catchment area
• Network mirrors the mobile, high earning,
multinational customer base
• Business routes with high frequencies
• Key gateway to ski breaks
• Visiting friends and relative routes to Italy,
Portugal and Spain
• 5.6m passengers in 2012 with and easyJet
has c.40% market share
Year
Source: OAG, easyJet 15easyJet is the No.1 airline at London Gatwick
Increase in capacity…. …driving returns at London Gatwick
easyJet British Airways Monarch Seats Returns Seats
Seats Norwegian Ryanair Returns
18 £1,800 18
16 £1,600 16
Millions
14 £1,400 14
Millions
12 £1,200 12
10 £1,000 10
8 £800 8
6 £600 6
4 £400 4
2
£200 2
0
£0 0
2006 2007 2008 2009 2010 2011 2012 2013
FY08 FY09 FY10 FY11 FY12
Market characteristics London Gatwick catchment area
• Large and affluent core catchment STN / LTN
area - 12.2m passengers LTN / STN
• London Gatwick serves both the LHR Core (LTN) STN Core
leisure and business markets LTN Core
LHR / LTN
• Increasing frequencies in Summer STN / LGW
2013 LHR Core
(LTN/LGW)
LGW / STN
LGW
• Amsterdam – 5 to 6 daily LHR / LGW Core
• Nice – 4 to 5 daily
Year
Source: OAG, easyJet 16Many further opportunities in core markets
Share of traffic at
easyJet’s top 20 airports Growth in existing markets
• easyJet has approximately 22% share
of capacity at its top 20 airports –
equating to around 46m seats
EZJ
46m seats
Other LCC • Other low cost carriers (LCCs) have
51m seats
~25% share
• Non-LCCs account for 53%, with 12%
Non-LCC
transfer (est) estimated to be for connections to
26m seats Non-LCC P2P long-haul flights
(est)
86m seats • 41% or 86m seats opportunity within
easyJet’s top 20 airports
A further 41% or 86m seats opportunity within easyJet’s top 20 airports
Source:
Market size sourced from OAG data based on easyJet definition of short-haul routes; estimates of transfer traffic obtained from airport and 17
company external announcements. P2P = point to point; LCC = Low-cost carrier.Maintain cost
advantage
Warwick Brady
Chief Operations Officer
18Our operation is pan European and large scale
Flight Operations
• 2,300 Pilots
Cabin Services
• 4,800 Cabin Crew
Ground Operations
• 628 routes across 137 airports
in 34 countries
Engineering & Maintenance
• 212 aircraft
• 7 maintenance bases
• 22 line maintenance bases
Operations Control
• 22 aircraft/crew bases
• c. 1,300 sectors/day
Source: Seabury Group 19The easyJet way
• Committed to providing the safest, most efficient and most reliable
service to our customers
• Lean, low-cost operating model
• Strong safety culture, with advanced safety management tools
• Industry-leading On Time Performance
CASK ex. fuel On Time Performance – FY12
easyJet 3.29
Ryanair 1.59
Norwegian 3.64 Difference due to :
1. Airport choice
Air Berlin 4.50 2. 189 seat 737
IAG 4.46 aircraft vs. 156
seat A319
KLM 5.01
Air France 6.14
Lufthansa 5.94
Source: Airline Analyst, press reports, company filings
OTP figures from flight stat.com & reflect average number of arrivals within 15 minutes for period Oct 11 to Sept 12
20Rigorous turn process drives OTP
Turnround Ground Handlers
2175.00%
70.00%
60.00%
65.00%
90.00%
95.00%
80.00%
85.00%
Jan-11
Feb-11
Mar-11
Apr-11
May-11
Jun-11
Jul-11
Aug-11
Sep-11
Oct-11
Nov-11
Dec-11
Jan-12
Feb-12
Mar-12
Apr-12
May-12
Jun-12
Jul-12
Aug-12
Sep-12
Oct-12
Nov-12
Dec-12
Jan-13
Feb-13
Mar-13
Apr-13
May-13
Improved OTP has increased customer satisfaction
Jun-13
Jul-13
OTP
OTP drives customer satisfaction and reduces cost
Customer
22
SatisfactionCost: maintaining our advantage
easyJet’s cost base – FY12
27%
32%
Ground operations
Fuel ~ £1.1bn £1.0bn
12%
8% Crew £0.4bn
Navigation ~ £0.3bn
3% 6%
Marketing - £0.1bn 6%
Maintenance £0.2bn
Fixed/other - £0.2bn
Innovating and re-engineering processes to deliver sustainable savings
23easyJet lean – lowest cost for our network
• Programme with governance
Fuel
and milestones efficiency
Airports
• Aimed at both long term and & ground Crew
short term handling
• Embedding a lean culture and easyJet
continuous improvement lean
Sales and Engineering
• Operationally focused but marketing
overs whole cost base
• Sustainable benefits, not one-
off benefits Ownership Other &
Fixed
• On track to deliver £135m of Navigation
cost savings in 2013
Innovative thinking to drive long-term, sustainable savings, benchmarked
against the best in class
24Driving ground operations efficiencies
Airports Ground handling cost per turn
• Sophisticated approach to working with
regulated airports
• Marketing support, bilateral deals,
infrastructure initiatives
Ground Handling
• Consolidating the market
• Efficient procurement tendering FY09 FY10 FY11 FY12 FY13
(forecast)
Cost saving projects
• Drive down margins
• Automated Bag Drop and Gates
• Forced air de-icing
• Bendi-belt baggage loaders
25Engineering and maintenance
• Already a source of competitive advantage to easyJet and continually
improving through lean process management
• 95% of the annual easyJet E&M spend is up for re-tender by 2017
• This is a huge opportunity to make a step change in our costs, and we will
review the full range of options available to us
Wholly Partner ‘Batch’/
Full Mixed Full
owned or Unbundled
Insource Mode Outsource
subsidiary Franchise contracts
26Progressive approach to crew costs
• No seniority system – rewards given based
on performance
• Different pay in our different jurisdictions to
reduce costs
• Local contracts in line with latest
European Regulations
• Improved flexibility through new
entrant contracts
• Offer lifestyle choices - select between pay,
time off or part time
• Optimisation software ensures our crew are
as productive as possible
• Connected crew, giving better customer
experience and helping drive savings
27Fuel – our biggest expense
• One engine taxiing
• Flap 3 landings
• Delayed engine start
• Engine washing
• Lightweight seats and trolleys
• Fuel burn information shared with
flight crew
• Implementation of fuel burn
analysis tools
• New aircraft with sharklets
• Zonal drying
• Continuous improvement together
with manufacturers
28New fleet enhancing easyJet’s advantage
Chart assumes fuel at US$1,100/tonne 29Summary
• Rigorous cost control across all departments
• Leading OTP in Europe
• High customer satisfaction
• Advantageous operating model
• Cost containment program on track
30Drive demand,
conversion and yield
across Europe
Peter Duffy
Marketing Director
31Who are our customers?
Booking volume by market
• Increasingly European profile -
over the last 5 years, the FY 08 FY 13
percentage of bookings
originating in the UK has fallen
by c.10%
• 40% UK
• 15% France
• 13% Italy
• 50%+ of bookings are made Time between booking and departure
inside 4 weeks of departure
• 18% of bookings are made more
than 3 months (12 weeks)
from departure
32Who are our customers
Average age by market
• The current average age of
bookers on the database
is 41.5
• The oldest market is the UK
(42.6) and the youngest is
Germany (38.2)
• The average age has risen by
1.2 years since 2009
• We drive 60 million seat sales Booker age
from 21 million bookings
33Brand performance Q3 13
Awareness, preference and consideration are strong in all markets with the
exception of Germany where our footprint is concentrated mainly on Berlin
Q3 13 Awareness Consideration Preference
99 61 16
97 62 19
86 28 4
93 59 20
100 66 36
34Industry drivers of consideration
When asked directly most people state price/value for money, safety and
punctuality as their primary drivers of choice
1. Price/value 1. Price/value 1. Price/value 1. Staff/service 1. Price/value
2. = Comfort 2. Safety 2. Reliability 2. Price/value 2. Staff friendliness/service
2. = Staff 3. Staff/service 3. Safety 3. Safety 3. Safety/security
4. Airport/destination 4. Punctuality 4. Flight times 4. Comfort/cleanliness 4. Punctuality
convenience
5. Reliability/trust 5. Comfort 5. Airport/destination 5. Punctuality 5. Flight availability
convenience /scheduling
6. Safety 6. Reliability 6. = Staff/service 6. Company reputation 6. Reputation
7. Punctuality 7. Flight times 6. = Comfort 7. Reliability
6. = Punctuality
35How easyJet fares on the things that matter
1 2 3 1 2 3 1 2 3 1 2 3 1 2 3
Costs the
least
Makes travel
easier
Flies to/from
convenient
locations
Has a good
reputation
for safety
Friendly and
approachable
staff
36Understanding customer service
• We understand the
relative importance of
the different
components of the
customer journey
• Our action areas do
not involve layering
cost – they are about
the way we do things
37How we sell
High volume Demand based
Conversion Pricing Model
focused
e-Commerce
engine
Proposition Structured
re-design and re-targetting
segmentation customers and
prospects
38E Commerce engine
• 370M visits
• 17.5M sales
• Common pan-European content managed
platform
• Personalisation/conversion
• Structured test and learn programme
• Integrated email – abandoned basket
• Integrated digital re-targeting
• 6M app downloads
• 5%+ digital bookings
• c.9% visits to easyjet.com from mobile / +20%
including tablets
39Pricing
Days
To Go
Yield curve
Price paid
Supply
Selling Available
Profile Capacity
0 50 100 150 200
Optimal
Special
Events Yield
Sector Days to departure
Costs
Demand Costs
Competitor DOW & Incremental
Capacity Flight Passenger
Fuel Price
& Fares Time Costs
40Structured re-targetting
• 53.4M customers on the database
– 40% marketable
• 414K added last month – 86%
marketable
• Data driven creative approach
• Customers in the contact
programme are 30% more
valuable than those who are not
• Emailed customers book 11% more
frequently than non-emailed
customers
• For every £1 spent – driving £50 in
revenue
• Significant contributor to
reduction in Marketing Cost per
seat falling from £0.91 in 2009 to
£0.66 budgeted for 2014
41Proposition re-design - Cost reduction initiatives
• Online check-in and mobile
boarding cards to facilitate auto-
bag drop off and optimise ground
handling costs
• Best in class flight digitised flight
information and automated
disruption management process to
minimise contact centre costs
42Proposition re-design - Allocated seating
• Delivered against all objectives
• No impact on asset utilisation. No
long term erosion of strong
operational performance. No
negative impact on cost per seat
• Improved customer satisfaction with
boarding experience - increased by
5% to 73.5%
• In Q3 2013 allocated seating drove
c.1% of the 6.1%1 underlying increase
in revenue per seat
1 Revenue per seat at constant currency 43Proposition re-design - Business travel
Building blocks FY11 FY12 FY13 FY14 FY15
Proposition
improve punctuality Delivered
o add new network points Ongoing
o increase frequency Ongoing
Product
launch & develop flexi fare Delivered
deploy allocated seating Delivered
o enable Fast Track Security Ongoing
Sales
recruit pan European sales force Delivered
o negotiate TMC incentives Ongoing
o deliver corporate fares Ongoing
Distribution
agree new commercial terms with GDS Delivered
o standardise GDS booking process In progress
o strengthen position on Self Booking Tools In progress
o enhance online & mobile capability Planned
Consideration
develop Business Sense campaign Delivered
o increase allocation of media weight Planned
44Summary
• Strong European footprint
• Well positioned brand against the broad range of criteria that are
important to customers
• Leading digital presence
• Advanced pricing model
• Integrated customer relationship management
• Focus on driving cost saving and RPS growth through sensible product
design
45capital Discipline
Chris Kennedy
Chief Financial Officer
46Financial principles
• Absolute focus on ROCE
• Invest in growth opportunities where returns are attractive and are in excess of
cost of capital
• Maintain strong balance sheet
• Maximum gearing of 50%
• Target £4m cash per aircraft
• Cap of £10m adjusted net debt per aircraft
• Policy of returning excess cash to shareholders
• Ordinary dividend of 3x cover
• Consider additional returns to reduce excess capital
• Ownership
• Maintain flexibility around fleet size and deployment
Clear set of financial principles to deliver sustainable growth and returns
for shareholders
Return on capital employed—Normalised profit after tax divided by average capital employed. Normalised profit after tax comprises operating
profit adjusted for implied interest on operating leases (calculated at one-third of the charge for aircraft dry leasing for the year), less tax
calculated divided by average capital employed at the standard rate of corporation tax ruling at the end of the year. Average capital employed 47
comprises the average sum of Shareholders’ equity and adjusted net debt at the start and end of the year.easyJet’s hedging policy
• Clear hedging policy to reduce short term earnings volatility
• easyJet hedges forward, on a rolling basis, between:
• 65% and 85% of the next 12 months anticipated fuel and currency requirements; and
• 45% and 65% of the following 12 months’ anticipated requirements
Fuel US Dollar Euro
requirement requirement surplus
Three months to 30 September 2013 85% 82% 83%
Average rate $974/ tonne 1.59 1.17
Full year ending 30 September 2013 85% 83% 85%
Average rate $983/ tonne 1.60 1.18
Full year ending 30 September 2014 67% 65% 73%
Average rate $984/ tonne 1.58 1.20
Rates as at 22 July 2013: Euro to sterling 1.1630; US$ to sterling 1.5326; Jet fuel cif US$986per metric tonne .
FX sensitivities shown relate to the impact of changes in the fx rate on the unhedged element of currency over and away from the outlook 48
statement and the rates shown aboveCapital allocation process
• Set strategic direction
• Focus markets
Strategic • Scenario planning
Plan
• Portfolio review of
network performance
• Asset allocation
• ROCE performance
Long term by route vs. budget
Weekly route
- management • Competitor activity
Capital meeting • Pricing and
promotion activity
Allocation
Fleet Network
planning development Short term
forum forum -
Capacity
Allocation
• Financial evaluation of • Execution of
different aircraft types Monthly network plan
planning • Optimise
• Fleet and capex plan meeting network cost
49Use of Capital: focus on network returns
Returns by base - July 2012 Rolling 12 months returns: April –
March ‘13 vs. April to March ‘12
Returns
Market attractiveness
Liv’pool
Madrid Rolling 12 to March 12 Rolling 12m to March 13
12% ROCE
0% ROCE
R o utes
FY returns (network touching)
Decisive action taken to improve Improving network returns
network returns year on year
50New route selection process
• New route process looks at areas of
Market Attractiveness
strategic focus
• Detailed financial and operational
Competitive Bilateral evaluations carried out
Environment Constraints
• Evaluation based on taking fair share of
existing revenue pools
Detailed financial evaluation
• All short listed routes require sign-off before
launch
Join New network
the dots points
New route shortlist
Airport Operations
negotiations review
Finalise New route Continuous performance
New route sign-off schedule on sale monitoring
51Building a sustainable model
easyJet five year plan 2011 to 2015
Maintenance
Growth
Replacement
Cash generated Special dividend Ordinary dividend Expenditure on Sale and Lease Debt reduction Free cash
from Operations £150m (March @20% payout engine Back
2012) maintenance and
aircraft
52Strong balance sheet
£m Mar ‘13 Sep’12
Property, plant and equipment 2,192 2,395
Goodwill and other intangible assets 456 456
Other assets 554 561
Liabilities (excluding debt) (1,968) (1,544)
1,234 1,868
Debt 761 957
Cash and money market deposits (1,194) (883)
Net debt / (cash) (433) 74
Shareholders’ equity 1,667 1,794
Capital employed 1,234 1,868
Gearing* 11% 29%
*Gearing defined as (debt + 7 x annual lease payments – cash) divided by (shareholders’ equity + debt +7 x annual lease payments – cash) 53Profit & loss
£m F ’12 F ’11 Change
Total revenue 3,854 3,452 11.6%
Fuel (1,149) (917) (25.3)%
Operating costs excluding fuel (2,174) (2,067) (5.1)%
EBITDAR 531 468 13.5%
Ownership costs (214) (220) 2.7%
Profit before tax 317 248 27.9%
PBT margin 8.2% 7.2% 1.0 ppt
Tax charge (62) (23) (169.6)%
Profit after tax 255 225 13.3%
1
Effective tax rate 19.6% 9.3% (10.4) ppt
Earnings per share 62.5p 52.5p 19.0%
Ordinary dividend per share 21.5p 10.5p 104.8%
Special dividend per share - 34.9p -
Return on capital employed – including operating leases 11.3% 9.8% 1.5 ppt
1. easyJet’s effective tax rate in 2012 was 19.6%. In 2011 resolution of various tax matters with UK and European tax authorities resulted in an
abnormally low tax charge in the P&L. In 2012, as in 2011 easyJet benefitted from a reduction in its deferred tax liability due to the fall in the 54
rate of UK corporation tax.Cashflow
£m
45 28
109 46
389
331
1,400 364
150
25 883
Sep 2011 * Operating Depn & Net Working Tax, net Ordinary CAPEX Financing Special FX Sep 2012 *
Profit amort Capital int & other dividend dividend
paid paid
* Includes money market deposits but excludes restricted cash 55Fleet flexibility
Maximum, minimum and base case fleet size under New Framework agreement
306
300 301 298
279
262
247 276 276
237 269
261 264
226 256
241
231
223
215 217
185
177
167 165
162
FY'14 FY'15 FY'16 FY'17 FY'18 FY'19 FY'20 FY'21 FY'22
Max Base case Min
Flexible fleet arrangements to respond to appropriately to market conditions
1. At the end of the relevant Financial Year
2. Based on fleet plan – base case 56
3. Maximum fleet does not include the purchase rightsFleet expenditure broadly in line with current levels
1 2 2 2
2005-2012 2013 – 2014 2015-2017 2018-2022
Additional aircraft 49% 37% 48% 16%
Replacement
42% 39% 12% 54%
aircraft
Maintenance 9% 24% 40% 30%
Total 100% 100% 100% 100%
Total expected fleet
acquisition and
overhaul expenditure 18% 10% c.8% 10% - 12%
as a % of easyJet
revenue
Fleet acquisition and overhaul expenditure expected to be funded through a
combination of easyJet’s internal resources, cashflow, sale and leaseback
transactions and debt
1 . Based on actual revenue for the 2005 – 2012 Financial Years
2 . Based on estimated revenue 57Increasing the proportion of A320s in the fleet
2014 2015 2016 2017 2018 2019 2020 2021 2022
Fleet plan – base case1 226 231 241 256 261 264 269 276 276
Current Generation
32% 36% 39% 42% 41% 41% 40% 39% 39%
A3201, 2
Current Generation
68% 64% 61% 57% 52% 44% 41% 33% 25%
A3191, 2
New Generation
- - - 1% 7% 15% 19% 28% 36%
A320neo1, 2
Average age of fleet
5.8 6.4 7.2 7.6 7.7 7.8 8.3 8.0 7.9
(years)1
Seats flown growth 4.7% 4.6% 5.4% 4.8% 3.0% 3.0% 3.0% 2.8% 3.1%
Maximum fleet1, 3 226 237 247 262 279 300 301 306 298
Minimum fleet1 226 215 217 223 185 167 177 162 165
1. At the end of the relevant Financial Year
2. Based on fleet plan – base case 58
3. Maximum fleet does not include the purchase rightsStrategy has delivered improved margins
easyJet’s RASK – CASK vs. competitors
RASK - CASK (pence)
2010 2012 Change
0.6
0.4
0.2
0.0
-0.2
-0.4
-0.6
-0.8
-1.0
-1.2
easyJet Ryanair Vueling Norwegian IAG Lufthansa Grp Air France-KLM
2010 0.33 0.40 0.40 -0.01 -0.92 -0.22 -0.76
2012 0.46 0.49 0.21 0.16 -1.03 -0.22 -0.93
Change 0.13 0.09 -0.20 0.17 -0.11 0.00 -0.17
RASK = Revenue per ASK
CASK = Cost per ASK
ASK = Available Seat Kilometres
Source: Goldman Sachs and internal easyJet analysis. Ryanair calendarised for 2012. Air France-KLM and IAG cargo data
excluded; Lufthansa data for passenger airlines in group.
2010 data at constant currency (based on 2012 rates)
59easyJet generates highest returns in sector
Key competitors Legacy carriers
easyJet Ryanair Vueling Norwegian Air Berlin IAG Air France Lufthansa
ROCE 16% 16% 7% 9% 3% 1% 0% 9%
3.2
Median: 4.8%
2.7
Lufthansa
9%
Adj. Asset Turnover
2.2
IAG Vueling easyJet
1% 7% 16%
1.7
Median: 1.6x
1.2
Norwegian
Air Berlin
9% Ryanair
3%
16%
0.7
0.0% 3.0% 6.0% 9.0% 12.0% 15.0% 18.0%
Size of bubble represents ROCE Adj. NOPAT Margin
easyJet’s leading ROCE is driven by a combination of strong margins
and high asset utilisation
1) Data from company filings
2) Local corporation tax rates for 2012 sourced from KPMG www.kpmg.com/global/en/services/tax/tax-tools 60
3) ROCE shown calculated using leases capitalised at 7x for 12 months to end March 2013
4) Lufthansa’s ROCE and asset turnover are calculated excluding the €3,459m write down due to changes in accounting policies.summary
Carolyn McCall
Chief Executive Officer
61Summary: strategy continues to deliver
Strategy is delivering Favourable Further opportunities
Modest capacity growth
competitive to take profitable share
environment 1. Efficient, low cost
Strong unit revenue
growth • Legacy carriers’ losses model
Controlling costs • Weaker carriers 2. Strong network and
retreating or exiting market positions
Capital discipline
• Consumers valuing 3. easyJet.com and brand
Improving returns low fares
4. Strong balance sheet
Clear opportunity to continue to deliver growing returns to shareholders
62Adr details and
investor relations
contacts
63Sponsored ADR programme
easyJet has established a sponsored Level I ADR programme in the US.
The ADRs trade on the premier tier of Over-The-Counter (“OTC”) market in the US.
Details are as follows:
Ticker Symbol ESYJY
CUSIP 277856209
Ratio 1 ADR : 4 Ordinary Shares
ADR depositary Deutsche Bank
Share price information www.otcqx.com or www.adr.db.com
Please contact the Deutsche Bank’s dedicated ADR broker desks:
Jay Berman (New York) Simon Davies (London)
Tel: +1 212 250 9100 Tel: +44 20 7547 6500
Email: jay.x.berman@db.com Email: simon.davies@db.com
64Investor relations contacts
Rachel Kentleton
Director of Investor Relations, Strategy and Regulatory Affairs
rachel.kentleton@easyjet.com
+44 (0) 7961 754 458
Tom Oliver
Group Investor Relations Manager
tom.oliver@easyjet.com
+44 (0) 7950 996 262
Will MacLaren
Group Investor Relations Manager
william.maclaren@easyjet.com
+44 (0) 7961 763 879
65appendix
66Outlook – Q3 IMS 24 July 2013
Capacity (seats flown)
• Q4 c.+3.1% (assuming no further significant disruption)
• H2 c.+3.3% (assuming no further significant disruption)
Revenue per seat (constant currency)
• H2 up to 6% (assuming no further significant disruption)
Cost per seat ex fuel (constant currency)
• H2 c.+4% (assuming no further significant disruption)
Fuel and foreign exchange
• It is estimated that at current exchange rates(1) and with fuel at around $985 m/t,
easyJet’s unit fuel bill for the second half of the financial year will be around £9 million
favourable year on year
• Using current exchange rates(1), it is estimated that year on year exchange rate
movements (including those related to fuel) will have an adverse impact of around £10
million in the second half of the financial year.
easyJet is performing strongly driven by a combination of management initiatives
and a benign capacity environment for easyJet in 2013. Therefore the Board
expects that pre-tax profits for the year ended 30 September 2013 to be between
£450 million and £480 million assuming no further significant disruption.
(1) based on spot rates:, US $ to £ sterling 1.5326 euro to £ sterling 1.1630 Jet fuel cif US$986per metric tonne as at noon on 22 July 2013
67easyJet generates highest returns in sector
All figures expressed in reported
easyJet Ryanair Vueling Norwegian Air Berlin IAG Air France Lufthansa
local currency units (LCU)
LCU LCU LCU LCU LCU LCU LCU LCU
EBIT 390 718 34 1,047 31 -52 -219 1,257
Interest on leases (33%) 31 33 43 346 198 143 322 33
Adjusted EBIT 421 751 77 1,393 229 91 103 1,290
Tax (local enacted rate) -101 -94 -23 -390 -68 -43 -107 -381
NOPAT 320 657 54 1,003 161 48 -5 909
Tax rate % 24% 13% 30% 28% 30% 30% 33% 30%
Ave. equity 1,587 3,290 227 1,982 -26 5,061 4,671 7,854
Ave. net debt / (cash) -238 54 -331 3,004 703 1,431 7,054 1,923
Ave. capitalised leases (7.0x) 683 661 823 6,693 4,116 2,891 6,409 826
Average capital employed 2,032 4,005 719 11,679 4,792 9,383 18,133 10,603
ROCE 16% 16% 7% 9% 3% 1% 0% 9%
Capitalised leases at 7.0x and local tax rate
1) Data from company filings
2) Local corporation tax rates for 2012 sourced from KPMG www.kpmg.com/global/en/services/tax/tax-tools 68
3) ROCE shown calculated using leases capitalised at 7x for 12 months to end March 2013
4) Lufthansa’s ROCE and asset turnover are shown excluding the €3,459m write down due to changes in accounting policies.List of awards easyJet has won
2013 2012
• Best Airline - airline retail • Family Engagement Award - Family Friendly awards - (Private Sector)
conference awards 2013 • Best Low-Cost Airline in Europe - World Airline Awards 2012
• Best Airline for Inflight Food • Number 1 airline - The Kaizo Advocacy Index (KAI) Spring/Summer 2012
• Carolyn McCall - airline Strategy airline category
award for low cost leadership • Best Low Cost Carrier - Business Traveller Magazine Awards 2012
2013 • Best Low Cost airline - Conde Nast Traveller
• Carolyn McCall - Gold medal • Best Short-Haul Airline Of The Year - Food and Travel Magazine awards
award, chartered management • CEO of the Year - World Low Cost Airline Congress 2012 - The Budgies
institute MARKETING ON
MOBILE AWARDS 2013 (MOMA) • Best Business Traveller offering - Best Low Cost Airline
Business Traveller Awards 2012 (12th year in a row)
• Best B2C App
• Most innovative use of boarding gate - Future Travel Experience Awards
2012
• Europe’s Leading Low Cost Airline - Technology around the globe -
World Travel Awards 2012 - Favourite short haul airline
The Golden Backpack Awards (TNT)
• World’s Leading Low-Cost Airline 2012
World Travel Awards
• Most Effective mobile Application
Effective Mobile Marketing Awards 2012
• Air Press Green Aviation Award
easyJet’s outstanding commitment to sustainable development and
contribution to air transport developments
• Best airline app for Android - AndroidPIT
69Disclaimer
This communication is directed only at (i) persons having professional experience in matters relating to investments who
fall within the definition of “investment professionals” in Article 19(5) of the Financial Services and Markets Act 2000 (Financial
Promotion) Order 2001; or (ii) high net worth bodies corporate, unincorporated associations and partnerships and trustees of
high value trusts as described in Article 49(2) of the Financial Services and Markets Act 2000 (Financial Promotion) Order
2001. Persons within the United Kingdom who receive this communication (other than those falling within (i) and (ii) above)
should not rely on or act upon the contents of this communication. Nothing in this presentation is intended to constitute an
invitation or inducement to engage in investment activity for the purposes of the prohibition on financial promotion contained
in the Financial Services and Markets Act 2000.
This presentation has been furnished to you solely for information and may not be reproduced, redistributed or passed on
to any other person, nor may it be published in whole or in part, for any other purpose.
This presentation does not constitute or form part of, and should not be construed as, an offer for sale or subscription of,
or solicitation of any offer to buy or subscribe for, any securities of easyJet plc (“easyJet”) in any jurisdiction nor should it or
any part of it form the basis of, or be relied on in connection with, any contract or commitment whatsoever. This presentation
does not constitute a recommendation regarding the securities of easyJet. Without limitation to the foregoing, these
materials do not constitute an offer of securities for sale in the United States. Securities may not be offered or sold into the
United States absent registration under the US Securities Act of 1933 or an exemption there from.
easyJet has not verified any of the information set out in this presentation. Without prejudice to the foregoing, neither
easyJet nor its associates nor any officer, director, employee or representative of any of them accepts any liability
whatsoever for any loss however arising, directly or indirectly, from any reliance on this presentation or its contents.
This presentation is not being issued, and is not for distribution in, the United States (with certain limited exceptions in
accordance with the US Securities Act of 1933) or in any jurisdiction where such distribution is unlawful and is not for
distribution to publications with a general circulation in the United States.
By attending or reading this presentation you agree to be bound by the foregoing limitations.
70You can also read